An Assessment of Silicon Carbide as a Cladding Material for Light Water Reactors
by
David Michael Carpenter B.S. Nuclear Science and Engineering M.S. Nuclear Science and Engineering Massachusetts Institute of Technology, 2006
Submitted to the Department of Nuclear Science and Engineering in Partial Fulfillment of the Requirements for the Degree of
Doctor of Philosophy at the
Massachusetts Institute of Technology October 2010
C Massachusetts Institute of Technology, 2010. All rights reserved.
Signature of Author:
DepartmeKt of Nuclear Science and Engineering October 15, 2010 Certified By:
Mujid S. Kazimi, Ph.D. essor of Nuclear Engineering Thesis Supervisor Certified By:
Bilge Yildiz, Ph.D. Norman K. Rasmussen ss n Professor of Nuclear Science and Engineering Thesis Reader Certified By:
Gordon Kohse, Ph.D. Principal Research Engineer Thesis Reader Accepted By:
Mujid S. Kazimi, Ph.D. ghaian, Committee on Graduate Students
An Assessment of Silicon Carbide as a Cladding Material for Light Water Reactors
by
David Michael Carpenter
Submitted to the Department of Nuclear Science and Engineering on October 15, 2010 in Partial Fulfillment of the
Requirements for the Degree of Doctor of Philosophy
ABSTRACT
An investigation into the properties and performance of a novel silicon carbide-based fuel rod cladding under PWR conditions was conducted. The novel design is a triplex, with the inner and outermost layers consisting of monolithic SiC, while the middle layer consists of a SiC fiber-wound composite. The goal of this work was evaluation of the suitability of this design for use as a fuel rod cladding material in PWRs and the identification of the effects of design alternatives on the cladding performance. An in-core loop at the MITR-II was used to irradiate prototype triplex SiC cladding specimens under typical PWR temperature, pressure, and neutron flux conditions. The irradiation involved about 70 specimens, of monolithic as well as of triplex constitution, manufactured using several different processes to form the monolith, composite, and coating layers. Post-irradiation examination found some SiC specimens had acceptably low irradiation-enhanced corrosion rates and predictable swelling behavior. However, other specimens did not fare as well and showed excessive corrosion and cracking. Therefore, the performance of the SiC cladding will depend on appropriate selection of manufacturing techniques. Hoop strength testing found wide variations in tensile strength, but patterns or performance similar to the corrosion tests. The computer code FRAPCON, which is widely used for today's fuel assessment, modified properly to account for SiC properties, was applied to simulate effects of steady-state irradiation in an LWR core. The results demonstrated that utilizing SiC cladding in a 17x17 fuel assembly for existing PWRs may allow fuel to be run to somewhat higher burnup. However, due to lack of early gap closure by creep as well as the lower
conductivity of the cladding, the fuel will experience higher temperatures than with zircaloy cladding. Several options were explored to reduce the fuel temperature, and it was concluded that annular fuel pellets were a solution with industrial experience that could improve the performance sufficiently to allow reaching 40% higher burnup. Management of the fuel-cladding gap was identified as essential for control of fuel temperature and PCMI. SiC cladding performance may be limited unless cladding/fuel conductivity or gap conductance is improved.
Thesis Supervisor: Mujid S. Kazimi, TEPCO Professor of Nuclear Engineering
ACKNOWLEDGEMENTS
This work was supported by the U.S. Department of Energy, Gamma Engineering Corporation, Ceramic Tubular Products, Westinghouse Electric Corporation, and the Electric Power Research Institute. I would like to thank the supportive contacts from those organizations, including Herb Feinroth, Matt Ales, Eric Barringer, Ed Lahoda, and Ken Yueh.
None of this would have been possible without the guidance and support of my advisor, Professor Mujid Kazimi, who over the last eight years has guided me through both my undergraduate and graduate research. I owe the success of my projects and the developments of my research skills in large part to Dr. Gordon Kohse and Yakov Ostrovsky at the Nuclear Reactor Laboratory who have always made themselves available to provide opportunities and assistance.
Others at MIT who have helped me to reach this point include Dr. Ed Pilat, Dr. Pavel Hejzlar, Dr. Tom Newton, Dr. Sung Joong Kim, and Dr. Eugene Shwageraus. I've been fortunate to have the help of fellow students along the way, including Jake Dobisesky, John Stempien, Uuganbayar Otgonbaatar, and John Styczynski. I would also like to thank the staff at the MIT Nuclear Reactor Lab for assistance and tolerance over all these years, and the administrative staff of the Department of Nuclear Science and Engineering for countless acts of kindness, help, and advice.
I would be remiss not to acknowledge my fellow travelers from undergrad to doctorate; Michael Elliott,
Erik Johnson, Tyler Ellis, and Mike Short. I don't think any of us would have guessed, back as freshmen in 2001, what we four would accomplish here in the next nine years, but it seems we've made it, after all.
I am grateful for my mother and father, Sandy and Terry, for everything they've done to get me where I
am. They made it possible for me to explore, learn, and conquer challenges many people will never have the opportunity to try, and I am eternally grateful. My brothers, Chris and Jeffrey, who have kept me entertained, hooked into the wider world, and proud. And finally, my heartfelt thanks to my lovely fiancee Michelle who has supported me through all of the late and sleepless nights and has put up with all of my distraction and delinquency. She has been with me for the last seven years and was critical in helping me to finally mount this latest hurdle. I am eagerly awaiting our future life together.
TABLE OF CONTENTS
ABSTRACT ... 4
ACKNOW LEDGEM ENTS ... 6
TABLE OF CONTENTS ... 7 LIST OF FIGURES ... 10 LIST OF TABLES ... 14 NO M ENCLATURE... 15 1. Introduction ... 16 1.1. Background ... 16
1.1.1. Early Fuel Cladding Development ... 16
1.1.2. Lim itations of Zircaloy ... 17
1.1.3. SIC Cladding as a Solution... 19
1.2. Objectives and Scope... 20
1.3. Thesis Organization... 21
2. Overview of Silicon Carbide ... 23
2.1. M anufacturing... 23
2.1.1. Fibers... 23
2.1.2. Fiber Com posites ... 24
2.1.3. Solids... 25
2.2. Previous Studies ...F si... 25
2.2.1. SiC for Nuclear Fusion ... 26
2.2.2. SiC for Nuclear Fission... 27
2.3. SiC Properties ... 29
2.3.1. Structure and Density... 30
2.3.2. Strength and Elastic M oduli... 31
2.3.3. Corrosion in W ater ... 33
2.3.4. Interactions with Fuel... 35
2.3.5. Therm al Shock... 36
2.3.6. Cross Sections and Transm utation ... 37
2.3.7. Radiation Effects on M icrostructure ... 37
2.3.9. Sum m ary of Properties... 40
2.3.10. Fuel Perform ance M odeling ... 41
2.4. CTP SiC Cladding Program ... 42
2.5. Triplex Cladding Design ... 43
3. The Advanced Cladding Irradiation... 46
3.1. Background ... 46
3.2. The ACI Loop and Reactor Description ... 46
3.3. ACI Loop Design ... 49
3.3.1. System Description ... 49
3.3.2. Heating and Flow Control... 54
3.3.3. Chem istry M onitoring and Cleanup ... 57
3.3.4. Data Acquisition and Control ... 59
3.3.5. Loop Sensors Error Estimation ... 65
3.3.6. Operation ... 65 3.4. ACI Run 1... 68 3.4.1. Specimen Descriptions ... 68 3.4.2. Pre-Irradiation Analyses ... 69 3.4.3. Operation Notes ... 73 3.5. ACI Run 2... 76 3.5.1. Pre-Irradiation Analysis ... 76 3.5.2. Operation Notes ... 77 3.6. ACI Run 3... 80
3.6.1. Sam ple Descriptions ... 81
3.6.2. Pre-Irradiation Analysis ... 82
3.6.3. Operation Notes... 82
4. Post-Irradiation Exam inations ... 86
4.1. Sum m ary of Irradiations ... 86
4.2. Flux Shape and Spectrum ... 88
4.3. Visual Exam ination ... 92
4.4. Activation and Corrosion Products ... 103
4.5. Swelling ... 103
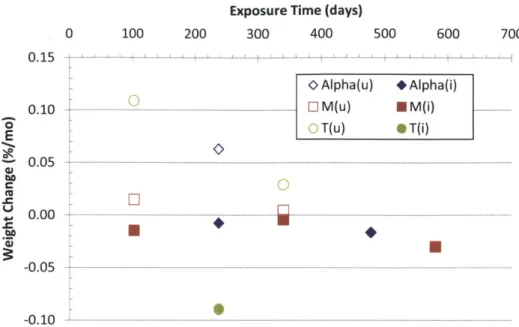
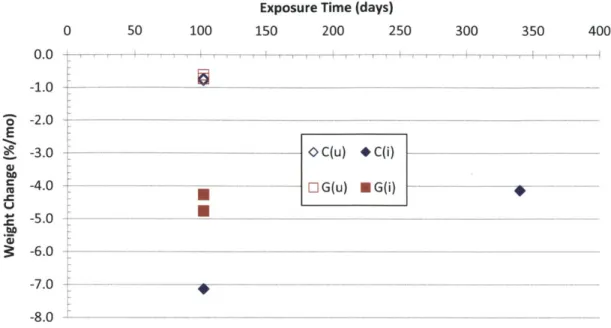
4.6. W eight Change & Recision ... 107
5. Cladding Hoop Strength Testing ... 121
5.1. Description of Expanding Plug Apparatus ... 121
5.2. Plug Test Procedure ... 123
5.3. Hoop Strength Testing Results... 124
5.4. Analysis of Plug Testing Results ... 131
6. FRAPCON Analysis ... 138
6.1. Code Description and Background ... 138
6.2. SiC Cladding M odel Changes... 141
6.3. Overview of Previous Results ... 142
6.4. Test Case Descriptions and Benchmarking ... 146
6.4.1. Description of FRAPCON-3.3HBv2... 146
6.4.2. Description of FRAPCON-SiCv2... 151
6.5. Cladding Design Optim ization... 154
6.5.1. M odifying the Fuel and Cladding Therm al Conductivity... 155
6.5.2. M odifying the Fuel and Cladding Geometry ... 158
6.5.3. M odifying the Gap Conductance... 163
6.6. SiC Fuel Rod Performance at High Burnup ... 169
6.6.1. Up-rated SiC Peak Power Pin... 170
6.6.2. Up-rated SiC Average Power Pin ... 178
7. Sum m ary and Recom m endations for Future W ork ... 184
7.1. Sum m ary of Irradiation Studies ... 184
7.2. Sum m ary of M echanical Testing... 186
7.3. Sum m ary of M odeling Reactor Fuel Behavior... 187
7.4. Conclusions on SiC for LW R Fuel Rod Cladding ... 188
7.5. Future W ork ... 191
7.5.1. Proposed Experim ental Studies ... 191
7.5.2. Proposed M odeling and Simulation ... 192
REFERENCES ... 194
APPENDIX A: FRAPCON M odifications... 202
LIST OF FIGURES
Figure 2-1 Calculated SiC DPA cross section. [Heinisch, 2004]... 38
Figure 2-2. Triplex SiC cladding design... 44
Figure 3-1 Top view of the MITR-1l core with the ACI insertion position B-3 highlighted. In this photo there is a solid dummy element in that position... 47
Figure 3-2 Axially-averaged neutron flux in loop in-core section calculated by MCNP... 48
Figure 3-3 Calculated axial neutron flux profile in MITR-1l core... 48
Figure 3-4 ACI general system layout. ... 50
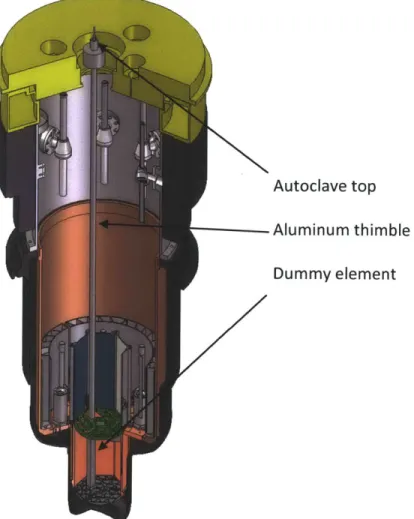
Figure 3-5 ACI thimble and autoclave inserted into dummy element in MITR-11 core. ... 51
Figure 3-6 ACI autoclave top... 52
Figure 3-7 In-core ACI specim en stack... 52
Figure 3-8 Example three-layer specimen module for SiC tubes. ... 53
Figure 3-9 ACI letdown and charging system schematic. [Chatela in, 2000] ... 55
Figure 3-10 ACI heater control cabinet... 60
Figure 3-11 Execution diagram for the original ACI data acquisition software... 61
Figure 3-12 New ACI cFP-based data acquisition execution diagram. ... 63
Figure 3-13 ACI PC data display in LabView ... 64
Figure 3-14 ACI specimen modules attached to the spine and outflow tube... 66
Figure 3-15 ACI autoclave top and piping after insulation (left) and shielding... 67
Figure 3-16 ACI run 1 end-cap specim en module... 73
Figure 3-17 Loop temperature and reactor power for ACI run 1. ... 75
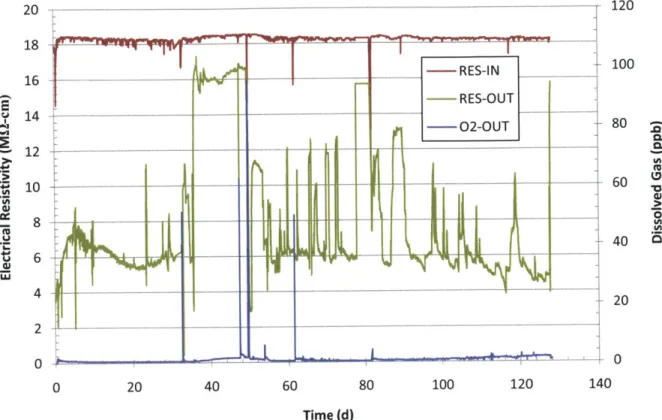
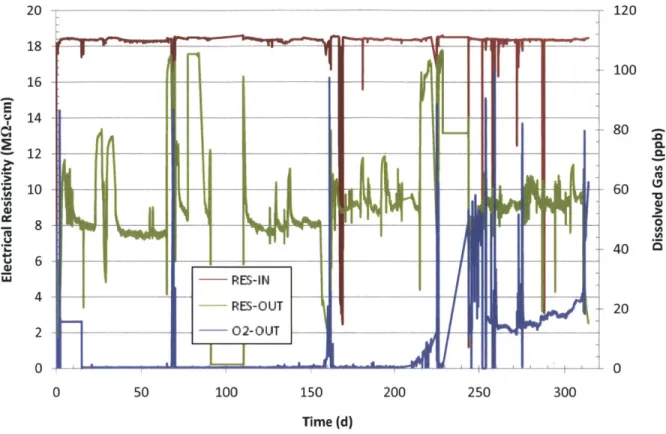
Figure 3-18 Run 1 loop electrical resistivity in the charging water tank (RES-IN), at loop letdown (RES-OUT) and dissolved 02 concentration at the loop letdown. ... 76
Figure 3-19 Loop temperature and reactor power for ACI run 2... 79
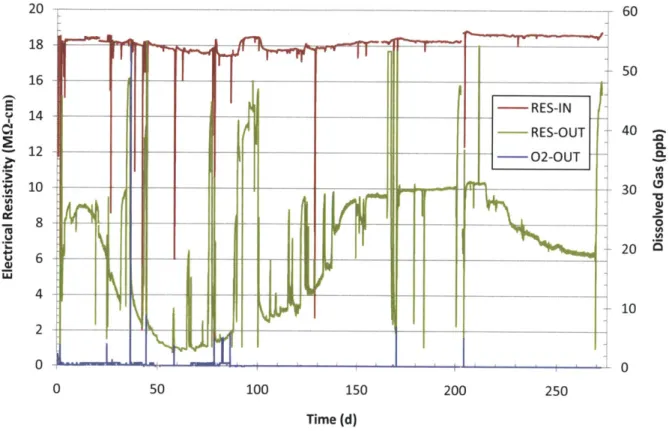
Figure 3-20 Run 2 loop electrical resistivity in charging water tank (RES-IN), at loop letdown (RES-OUT) and dissolved 02 concentration at the loop letdown. ... 80
Figure 3-21 In-core specim en stack for ACI run 3... 81
Figure 3-22 Loop temperature and reactor power for ACI run 3. ... 83
Figure 3-23 Run 3 loop electrical resistivity in charging water tank (RES-IN), at loop letdown (RES-OUT) and dissolved 02 concentration at the loop letdown. ... 84
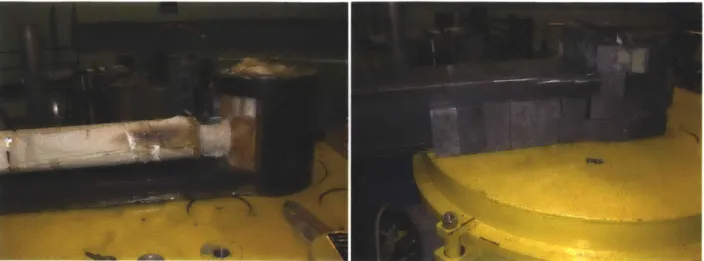
Figure 4-1 ACI disassembly in hot cell. The spine rod and outlet flow tube are visible hanging in the center of the left photo. Several modules and tubes are sitting on the table...86
Figure 4-2 Cross sections used for ACI fluence measurement. ... 89
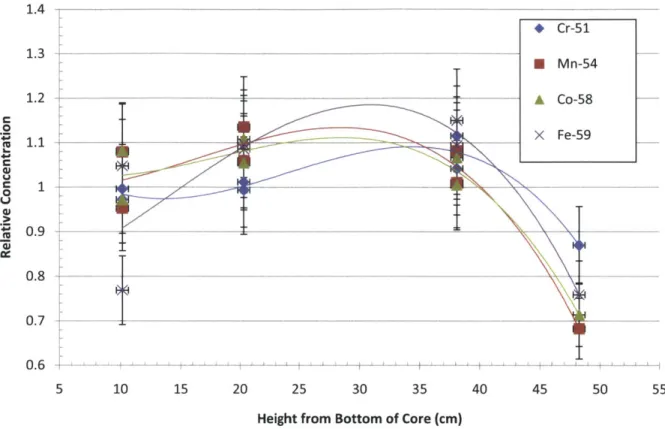
Figure 4-3 Relative isotope concentrations measured in flux wires at various axial locations in ru n 3 ... 9 1 Figure 4-4 Calculated EFPD based on four measured isotopes in flux wires in run 3... 92
Figure 4-5 Alpha-1 pre- and post-irradiation... 93
Figure 4-6 Alpha-2 pre- and post-irradiation... 93
Figure 4-7 M 1-1 and M 1-2 post-exposure... 94
Figure 4-8 T1 and T2 post-exposure. ... 94
Figure 4-10 A1-3 and A1-4 post-exposure ... 96
Figure 4-11 B1-3 and B1-4 post-exposure. ... 96
Figure 4-12 C1-3 and C1-4 post-exposure. ... 96
Figure 4-13 D1-3 and D1-4 post-exposure... 96
Figure 4-14 E1-2 and E1-4 post-exposure... 97
Figure 4-15 F1-2 and F1-4 post-exposure... 97
Figure 4-16 G1-3 and G1-4 post-exposure. ... 97
Figure 4-17 H1-5 and H3-4 post-exposure... 97
Figure 4-18 11-3 and 11-4 post-exposure... 98
Figure 4-19 R7 M odule prior to assem bly. ... 99
Figure 4-20 R7-10-1 pre- and post-irradiation with detail. ... 100
Figure 4-21 R7-26-2 pre- and post-irradiation with detail. ... 101
Figure 4-22 R7-23-1 pre- and post-irradiation with detail. ... 102
Figure 4-23 R7 m odule cut-aw ay... 102
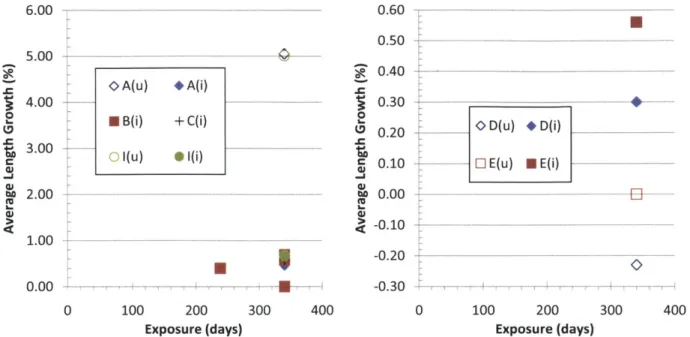
Figure 4-24 Length change for un-irradiated (u) and irradiated (i) triplex tubes with TREX monoliths and various composite and EBC constructions. ... 106
Figure 4-25 Length change for un-irradiated (u) and irradiated (i) CoorsTek and monolith-only tu b e s. ... 1 0 6 Figure 4-26 Length and OD change for irradiated (i) R7 tubes... 107
Figure 4-27 Measured weight change rate for un-irradiated (u) and irradiated (i) monolithic SiC tu b e s. ... 1 1 1 Figure 4-28 Measured weight change rate for un-irradiated (u) and irradiated (i) triplex tubes w ith TREX m onolith and different EBCs... 112
Figure 4-29 Measured weight change rate for un-irradiated (u) and irradiated (i) triplex tubes constructed w ith PIP m atrices... 113
Figure 4-30 Measured weight change rate for un-irradiated (u) and irradiated (i) triplex tubes w ith CV D o r CV I EBC... 114
Figure 4-31 Measured weight change rate for un-irradiated (u) and irradiated (i) triplex tubes w ith H i-N icalon or Sylram ic fibers. ... 114
Figure 4-32 Measured weight change rate for irradiated (i) R7 triplex tubes... 115
Figure 4-33 Photo and SEM images of H1-4 during post-irradiation exam with "dark spot" deposit. Detail of deposit on right. ... 118
Figure 4-34 SEM photos of H1-4. Clockwise from top left: cut cross section, cross section of composite with large voids, detail of composite, detail of monolith inner surface. 120 Figure 5-1 Expanding plug test load frame layout. Specimen tube loaded under fragment deflector show n in bottom right photo... 122
Figure 5-2 LabView interface for hoop test m achine. ... 123
Figure 5-3 Hoop test results for tube R7-04-A... 125
Figure 5-4 Hoop test results for tube M 1-1... 127
Figure 5-5 Failure pressure for un-irradiated SiC tubes categorized by ACI exposure time. ... 130
Figure 5-6 Failure pressure for irradiated SiC tubes categorized by ACI irradiation time... 130
Figure 5-7 M1-1 before and after hoop strength testing. After the tube was removed from the ram only the fragments in the lower picture remained... 134
Figure 5-8 F4-1 before and after hoop strength testing. The fractured surface is highlighted in
the lo w e r p hoto . ... 135
Figure 5-9 T-2 before and after hoop strength testing. After removal from the ram only the fragm ents in the low er photo rem ain. ... 136
Figure 5-10 11-3 before and after hoop strength testing. The fracture surface is highlighted in the lo w e r p hoto . ... 13 7 Figure 6-1 FRAPCON-3 iterative solutions scheme. [Berna, 1997]... 139
Figure 6-2 Cladding thermal conductivity at constant power. [Carpenter, 2006] ... 143
Figure 6-3 Fuel-cladding radial gap width at constant power. [Carpenter, 2006]... 144
Figure 6-4 Average LHGR for Manzel high-burnup case. [Carpenter, 2006]... 145
Figure 6-5 Fuel centerline and OD temperature for the Manzel high-burnup case. [Carpenter, 2 0 0 6 ] ... 14 5 Figure 6-6 Axial power shapes based on Seabrook UFSAR for BOL (top), MOL (center), and EOL (b o tto m )... 14 8 Figure 6-7 Power history and burnup for the Seabrook peak rod... 149
Figure 6-8 Average fuel temperature for Seabrook peak rod for different FRAPCON versions. 150 Figure 6-9 Fission gas release for Seabrook peak rod for different FRAPCON versions. ... 151
Figure 6-10 Minimum radial fuel-cladding gap thickness for zircaloy- and SiC-clad fuel rods... 152
Figure 6-11 Maximum pellet-cladding contact pressure for zircaloy- and SiC-clad fuel rods.... 152
Figure 6-12 Average fuel temperature for zircaloy- and SiC-clad fuel rods... 153
Figure 6-13 Maximum fuel temperature for zircaloy- and SiC clad fuel rods. ... 154
Figure 6-14 Average fuel temperature for SiC-clad fuel rods with higher cladding (SiC 12 W/m-K) or fuel (U02 k x 2) therm al conductivity. ... 156
Figure 6-15 Maximum fuel temperature for SiC-clad fuel rods with higher cladding (SiC 12 W/m-K) or fuel (U02 k x 2) therm al conductivity. ... 156
Figure 6-16 Fission gas release percentage for SiC-clad fuel rods with higher cladding (SiC 12 W/m-K) or fuel (U02 k x 2) thermal conductivity... 157
Figure 6-17 Minimum fuel-cladding radial gap thickness for SiC-clad fuel rods with higher cladding (SiC 12 W/m-K) or fuel (U02 k x 2) thermal conductivity. ... 158
Figure 6-18 Minimum fuel-cladding gap thickness for SiC-clad fuel rods with ~ 3 mil radial gaps. ... 1 5 9 Figure 6-19 Average fuel temperature for SiC-clad fuel rods with ~ 3 mil radial gaps. ... 160
Figure 6-20 Fission gas release fraction for SiC-clad fuel rods with ~ 3 mil radial gaps... 160
Figure 6-21 Maximum fuel centerline temperature for SiC-clad fuel rods with annular pellets. ... 1 6 1 Figure 6-22 Average fuel temperature for SiC-clad fuel rods with annular pellets. ... 162
Figure 6-23 Minimum fuel-cladding gap thickness for SiC-clad fuel rods with annular pellets. 163 Figure 6-24 Average fuel temperature for SiC-clad fuel rods with nominal, 20% higher, and 60% higher initial H e fill gas pressure... 164
Figure 6-25 Fuel rod internal free gas pressure for SiC-clad fuel rods with nominal, 20% higher, and 60% higher initial He fill gas pressure... 165
Figure 6-26 Maximum cladding hoop stress for SiC-clad fuel rods with nominal, 20% higher, and 60% higher initial He fill gas pressure... 166
Figure 6-27 Average fuel temperature for SiC-clad fuel rods with helium or lead-bismuth
e u te ctic fill... 16 8
Figure 6-28 Minimum gap thickness for SiC-clad fuel rods with helium or lead-bismuth eutectic
fill... 1 6 8 Figure 6-29 Plenum gas pressure for SiC-clad fuel rods with helium or lead-bismuth eutectic fill.
... 169
Figure 6-30 Power history and burnup of the SiC-clad peak rod with annular pellets under Seabrook conditions with cycles extended by 26% to reach 100 MWd/kg... 171 Figure 6-31 Power history and burnup of the SiC-clad peak rod with annular pellets under
Seabrook conditions up-rated 25% to reach 100 MWd/kg... 172 Figure 6-32 Power history and burnup of the SiC-clad peak rod with annular pellets under
Seabrook conditions with 10% up-rate and 13.7% cycle extensions to reach 100 M W d /kg . ... 17 3 Figure 6-33 Maximum local power in SiC-clad fuel rods for high burnup... 173 Figure 6-34 Average fuel temperature for the SiC-clad peak fuel rods for high burnup. ... 174 Figure 6-35 Maximum temperature for the SiC-clad peak fuel rods for high burnup... 175 Figure 6-36 Minimum fuel-cladding gap thickness for the SiC-clad peak fuel rods for high
b u rn u p ... 17 5 Figure 6-37 Fission gas release percentage for the SiC-clad peak fuel rods for high burnup.... 176 Figure 6-38 Fuel rod internal free gas pressure for the SiC-clad peak fuel rods for high burnup.
.
... 1 7 7
Figure 6-39 Maximum cladding hoop stress for the SiC-clad peak fuel rods for high burnup... 178 Figure 6-40 Average LHGR and burnup of the average power zircaloy-clad pin under Seabrook
co n d itio ns ... 17 9 Figure 6-41 Average LHGR and burnup of the average power SiC-clad fuel rod under the
"Com posite" up-rate conditions... 179
Figure 6-42 Average fuel temperature for the average and peak power fuel rods under nominal Seabrook (zircaloy) and "Composite" up-rated (SiC) conditions... 180 Figure 6-43 Maximum fuel temperature for the average and peak power fuel rods under
nominal Seabrook (zircaloy) and "Composite" up-rated (SiC) conditions... 181 Figure 6-44 Minimum fuel-cladding radial gap thickness for the average and peak power fuel
rods under nominal Seabrook (zircaloy) and "Composite" up-rated (SiC) conditions. ... 1 8 1
Figure 6-45 Fission gas release percentage for the average and peak power fuel rods under nominal Seabrook (zircaloy) and "Composite" up-rated (SiC) conditions... 182 Figure 6-46 Maximum cladding hoop stress for the average and peak power fuel rods under
nominal Seabrook (zircaloy) and "Composite" up-rated (SiC) conditions... 183 Figure 6-47 Plenum pressure for the average and peak power fuel rods under nominal Seabrook (zircaloy) and "Composite" up-rated (SiC) conditions... 183 Figure 7-1 SiC irradiation conditions and microstructure development for nuclear applications.
LIST OF TABLES
Table 2-1 Solid SiC aqueous corrosion data... 35
Table 2-2 Friction coefficients for solid SiC versus relative humidity... 40
Table 2-3 Average properties for zircaloy and CVD SiC at typical PWR cladding temperature co nd itio ns... 4 1 Table 3-1 ACI run 1 sam ple type descriptions. ... 69
Table 3-2 ACI run 1 pre-irradiation specimen measurements. ... 70
Table 3-3 NAA sam ple descriptions ... 71
Table 3-4 Elem ents identified in sam ple C1. ... 71
Table 3-5 Elem ents identified in sam ple G2 ... 72
Table 3-6 Elem ents identified in sam ple F1... 72
Table 3-7 Elem ents identified in sam ple El... 73
Table 3-8 Location of specimens for ACI run 1 labeled by tier from the bottom of core and by lettered radial position. ... 74
Table 3-9 ACI run 2 pre-irradiation specimen measurements (new specimens only)... 77
Table 3-10 Location of specimens for ACI run 2 labeled by tier from bottom of core and lettered rad ia l po sitio n . ... 7 8 Table 3-11 ACI R7 specim en description. ... 81
Table 3-12 ACI run 3 pre-irradiation specimen measurements (new specimens only)... 82
Table 3-13 Location of specimens for ACI run 3 labeled by tier from bottom of core and lettered rad ia l p o sitio n . ... 8 2 Table 4-1 Summary of ACI specimen exposure from runs 1 to 3... 87
Table 4-2 SS304 flux w ires irradiated in ACI run 3... 88
Table 4-3 Concentration of isotopes of interest in ACI flux wires. Mass and concentration uncertainty is 10% ... 90
Table 4-4 Isotopes identified in sam ple H1-4. ... 103
Table 4-5 ACI specimen dimensional changes. The measurement error is ±0.2%... 105
Table 4-6 ACI specimen weight changes. The measurement error is ±0.5%. ... 108
Table 4-7 ACI specimen weight changes corrected for end-effects. The measurement error is ± 0 .5 % ... 1 10 Table 4-8 Calculated zirconium oxide layer thickness... 117
Table 5-1 Results of plug test on SiC tube specimens. The error in failure pressure is ±4%... 129
Table 6-1 Initial fuel and cladding parameters for constant power test case. [Carpenter, 2006] ... 1 4 2 Table 6-2 Initial cold fuel and cladding parameters for Seabrook test case. ... 146
Table 6-3 Reactor conditions for Seabrook test case. ... 146 Table 6-4 Design parameters for SiC-clad fuel rod with 10% central void for high-burnup cases.
NOMENCLATURE
ACI Advanced Cladding Irradiation BOL Beginning-of-Life
BWR Boiling Water Reactor CCW Component Cooling Water cFP Compact FieldPoint
CVD Chemical Vapor Deposition CVI Chemical Vapor Infiltration DPA Displacements Per Atom EBC Environmental Barrier Coating EFPD Effective Full-Power Days EFPY Effective Full-Power Years EOL End-of-Life
FCCI Fuel-Cladding Chemical Interaction
FCMI Fuel-Cladding Mechanical Interaction
HTGR High-Temperature Gas-Cooled Reactor
ID Inner Diameter
LHGR Linear Heat Generation Rate LOCA Loss-of-Coolant Accident LOFA Loss-of-Flow Accident LWR Light Water Reactor
MIT Massachusetts Institute of Technology
MITR-II Massachusetts Institute of Technology Reactor II MOL Middle-of-Life
MOX Mixed Oxide
MWd MegaWatt-Day
NAA Neutron Activation Analysis NRC Nuclear Regulatory Commission NRL Nuclear Reactor Laboratory OD Outer Diameter
PC Personal Computer PCCI Pellet-Cladding Chemical
Interaction
PCMI Pellet-Cladding Mechanical Interaction
PID Proportional-Integral-Differential PIP Polymer Impregnation Pyrolysis PWR Pressurized Water Reactor
SEM Scanning Electron Microscope SiC Silicon Carbide
1. Introduction
1.1. Background
The role of the cladding in a nuclear fuel rod is two-fold: first, to encapsulate the fuel and fission by-products over the life of the rod, and second, to conduct the heat generated in the fuel to the coolant. To accomplish these two goals a material is required that has high strength, good thermal conductivity, and tolerance of high levels of neutron irradiation. It will be further challenged by an environment with varying temperatures, stress, and chemicals over multiple years.
1.1.1. Early Fuel Cladding Development
Stainless steel was chosen as a structural material and fuel rod cladding early in the development of light water reactors (LWRs). Stainless steels were a familiar class of alloys that were easily obtained and worked, had good strength, and had excellent corrosion resistance in oxidizing environments. However, there were drawbacks to its use in a neutron radiation field, including considerable parasitic neutron absorption and activation. When stainless steel was found to be particularly susceptible to stress corrosion cracking in boiling water reactor (BWR) environments due to the presence of dissolved oxygen, there was a rapid and organized push to find a replacement. [Locke, 1975]
The search for a new cladding material for commercial light water reactors soon settled on a zirconium-based alloy (zircaloy) as had been used in naval reactors since the 1940s. Although more expensive to manufacture than the steel claddings, zircaloy has a lower neutron absorption cross section and is not as susceptible to cracking. During the 1960s most light water reactors, led by the BWRs, converted to zircaloy cladding. [Thomas, 1974]
Initial problems with zircaloy involved manufacturing flaws, corrosion, and hydride formation that caused sporadic fuel failures. Reformulations of the alloying ratios (traditionally zircaloy cladding has contained small amounts of Sn, Fe, Cr, Ni, 0, and C) and determination of the proper forging, machining, and annealing steps eventually addressed these issues by giving the
rods a more consistent microstructure that enhanced ductility, avoided brittle structures, and minimized hydrogen uptake. This resulted in the alloys Zircaloy-2 (1.5% Sn, 0.12% Fe, 0.1% Cr, 0.05% Ni) in 1952 and Zircaloy-4 (1.5% Sn, 0.2% Fe, 0.1% Cr) in the late 1950s. [Pickman,
1972] [Videm, 1972]
Although our understanding, operation, and regulation of LWRs have continued to evolve since that time, Zircaloy-2 and -4 have remained the reactor fuel cladding materials of choice for light water reactors. Only recently have new zirconium alloys with slightly improved corrosion performance been accepted for use in the U.S.: Zirlo (from Westinghouse Electric Corporation)
in 1991 and M5 (from Framatome ANP) in 2003. [Yueh, 2005] [NRC, 2003]
1.1.2. Limitations of Zircaloy
Zircaloy ultimately proved to be a reliable choice and as industry experience increased, rates of fuel cladding damage and failure decreased significantly from initial defect rates of about 1/100 fuel rods in the late 1960s to less than 1/105 in 2005. [Rusch, 2008] This can be attributed to optimizations in the fuel, cladding, and assembly design, and improvements in general plant operation and chemistry control.
In recent years, however, this trend of reduced fuel failures has begun to reverse. An increase in corrosion and fretting related failures has been noted in both types of LWRs. This increase is blamed on a range of factors including more aggressive operating conditions, higher power levels, longer cycle lengths, and chemistry changes to combat corrosion in other areas of the primary system. [Yang, 2006]
Defects in the cladding are significant for the operation of a plant because they can release radioactive material into the primary coolant system and can make the fuel rods more susceptible to damage in transients. This can increase the contamination of plant systems and the dose to workers, and cause de-rating of the plant's operating power. Therefore, there are direct safety and economic benefits to reducing the cladding defect rate. In addition, more robust fuel would allow plants to continue their drives to higher efficiency and higher output. Towards this end, in 2006 the Institute for Nuclear Power Operations set a goal for the U.S. commercial nuclear
power industry to reach zero fuel failures by 2010 through operational and material improvements. Now in the second quarter of that year, it is still not clear if that goal can be reached, and at what cost to plant operations.
As the basic zircaloy cladding has not changed significantly since the 1950s, the limitations recognized then are making themselves felt now. In particular, embrittlement of the cladding and the resulting uncertainty surrounding its performance in transient conditions after long in-core residence times have forced regulatory limits on fuel rod discharge burnup. In the U.S. this limit is set by analysis of the particular cladding alloy and reactor conditions, and is currently up to 62 MWd/kgU average for the peak rod with the most advanced cladding types. [NRC, 1997] While this was not an issue forty years ago due to an average discharge bumup around 30 MWd/kgU, today commercial reactors are regularly able to run fuel up to the 62 MWd/kgU limit, and there is potential to further enhance the productivity and efficiency of LWRs by allowing even higher burnup. [Olander, 2001]
Zircaloy cladding embrittlement occurs through several means: radiation damage, oxide layer growth, and hydride formation. In particular, brittle zirconium oxides and hydrides are target sites for crack initiation and growth that can lead to through-wall cladding failures. Oxidation occurs on the outer surface of the cladding due to exposure to the coolant (water) both from dissolved oxygen in BWRs and radiolytic free oxygen and zircaloy-water reactions in pressurized water reactors (PWRs). Zirconium hydrides can form due to hydrogen uptake from both inside and outside the cladding, but hydride formation near the outer surface where tensile stresses are the highest is of primary concern.
During normal operation both the oxidation and hydride formation occur at a steady rate (depending on factors such as dissolved gases, temperature, pH, and cladding microstructure), but higher burnup and changes in operating conditions can significantly affect the rate of these processes. For instance, there is experimental evidence that the oxide layer growth may considerably accelerate above 35 MWd/kgU for both Zircaloy-2 and Zircaloy-4. [Motta, 2008] Also, as the cladding temperature increases, the oxidation reaction becomes much more rapid,
with oxide growth rate increasing exponentially above the nominal cladding temperature of 300'C. [Videm, 1972]
During a severe transient such as a Loss-of-Coolant Accident (LOCA), cladding temperatures may increase dramatically due to film boiling or complete voiding of the coolant. Above 1200'C, the rapid exothermic oxidation reactions generate additional heat, and eutectic reactions can take place between zircaloy and the fuel. [Hofmann, 1989] Fuel-cladding chemical interaction (FCCI) and the zircaloy-water oxidation reaction can result in rapid corrosion (and embrittlement) of significant portions of the cladding wall thickness and consequential generation of large amounts of hydrogen gas. For this reason, by law plants and fuel must be designed and operated such that cladding temperature during loss-of-cooling accidents is below 2200OF (12000C). [10 CFR
§
50.46]As evidenced by the oxidation behavior, considering cladding outside of normal operating conditions is important. The cladding must maintain its integrity under a variety of adverse conditions as it is considered the first of the layers of protection against release of radioactive material from a reactor. The embrittlement discussed above not only makes the cladding more vulnerable to damage during normal operation, but especially during transients when stresses may be increased due to larger thermal gradients or pellet-cladding mechanical interaction
(PCMI).
As the zircaloy temperature increases, its strength decreases about 2% every 100C above 300'C, and the elastic modulus 1% every 100C. [Pickman, 1972] [Northwood, 1975] The thermal creep rate also increases exponentially with temperature. [Matsuo, 1987] All of these effects lead to reduced margin to failure of zircaloy cladding as temperature increases, and greater chance for gross cladding deformation such as ballooning or collapse.
1.1.3. SiC Cladding as a Solution
A change from the traditional zirconium-based cladding model may allow many of the deficiencies of current fuel rods to be addressed. In this work, silicon carbide (SiC) is explored as a possible replacement material for zircaloy.
While retaining the same fuel rod geometry and fuel design, it is possible that SiC cladding will better tolerate the LWR core conditions, especially in the regimes where it is difficult or prohibited to operate current zircaloy-clad fuel. In particular, it is hoped SiC-clad fuel will allow operation to high burnup (>62 MWd/kgU), with longer cycle lengths and higher heat fluxes, while simultaneously providing larger safety margins during transients. SiC cladding may also be useful for advanced reactor concepts that require fuel or coolant to run at higher temperatures, such as superheated coolant or high-temperature gas reactors where metals suffer from both loss of strength and radiation damage.
Unlike zircaloy, SiC will retain its strength and will not creep up to 1300'C, and it remains viable to even twice that temperature. SiC is also stable under irradiation, with swelling and changes to strength and thermal conductivity saturating after a few months of typical irradiation. There is also a benefit neutronically, as SiC parasitically captures fewer neutrons than zircaloy and has very low activation. [Snead, 2007]
In order to understand the benefits and limitations of SiC cladding, and whether it is a viable option to pursue, the new cladding design must be evaluated in LWR in-core conditions. Such tests will help to gauge its tolerance of the unique combination of chemical (fuel and coolant), mechanical, thermal, and radiation stressors present in-core. This will provide the data needed for a better understanding of the critical material properties such as SiC corrosion, swelling, and mechanical strength, and their change over time. It will also permit the crucial evaluation of the sum of those properties -its performance in comparison to existing zircaloy fuel rod cladding.
1.2. Objectives and Scope
The objective of this work is to investigate the novel use of silicon carbide as the cladding material for fuel rods in light water reactors. The cladding is evaluated for its response to the thermal, mechanical, chemical, and radiation stressors expected during service, and compared to existing cladding performance to determine if it offers benefits for reactor performance. This is accomplished through both computer modeling and experiments.
This work includes the design, construction, and operation of an experiment to probe the behavior of SiC cladding under neutron irradiation at the MIT research reactor. This experiment exposed SiC cladding specimens to typical light water reactor coolant temperature, pressure, radiation, and chemistry conditions. Specimens were removed at various intervals for examination to determine the effects of manufacturing and variations and exposure time.
Post-irradiation examinations include the measurement of corrosion, dimensional changes, activation, and tensile strength. To accomplish the tensile strength measurements, a new apparatus utilizing an expanding plug was constructed and used to simulate internal pressurization of the cladding.
The FRAPCON fuel performance code was updated in previous work [Carpenter, 2006] to include SiC cladding. FRAPCON was updated again and then used to examine the performance of SiC-clad fuel rods under current and speculative LWR operating conditions and to optimize the fuel rod design.
1.3. Thesis Organization
This thesis describes the design, operation, and results of experiments on and computer modeling of SiC cladding under LWR conditions.
Chapter 2 gives general background information on SiC, focusing on the high-purity SiC forms shown to be most applicable to nuclear environments. The history and manufacturing of SiC as well as previous applications of SiC in the nuclear field are reviewed. Then, important properties of SiC not discussed in previous work on SiC cladding are summarized. Finally, the current LWR SiC cladding project is described, and the concept of SiC triplex cladding introduced.
Chapter 3 discusses the design and operation of the Advanced Cladding Irradiation at MIT. The systems and procedures are described, and the details of each of the three irradiation runs are discussed.
Chapter 4 describes all of the post-irradiation examination, excluding hoop strength testing, of the tube specimens from the ACI. This includes visual examinations, weight change, and swelling.
Chapter 5 covers the hoop testing of triplex tubes. A hoop test machine designed by Ceramic Tubular Products, LLC was sent to MIT and used to test new and irradiated SiC tubes. Internal pressurization was simulated by compressing a urethane plug and the resulting stress-time plot recorded.
Chapter 6 covers computer modeling of SiC-clad fuel rods in a PWR using the FRAPCON code. The cladding geometry was optimized for current and uprated conditions in order to allow operation without damage to the cladding or overheating of the fuel and to enable as high a burnup as feasible.
Chapter 7 summarizes the findings and conclusions of this work and suggests future investigations that would enhance our understanding of SiC cladding properties and behavior.
2. Overview of Silicon Carbide
2.1. Manufacturing
Silicon carbide has long been valued as an abrasive due to its high hardness (it has a Vickers hardness around 20 GPa). [Snead, 2007] SiC can be found in limited natural deposits, but it was first synthesized in 1891 by Acheson utilizing a method still used today combining carbon and clay (silica). [Pierson, 1996] Industrial manufacturing processes are able to produce a wide range of forms, from powders and thin films to solid components such as tubes, fins, and crucibles. Due to its stability up to high temperature, SiC is used in furnaces, engines, and heating elements. More recently it has garnered attention from the electronics industry as an excellent thin-film semi-conductor.
Solid silicon carbide parts can be manufactured using several different methods depending on the size and purity required. The starting material may be reactant gases, solids, or liquid solutions that are transformed through application of heat, pressure, and chemical catalysts into the solid SiC form. In this work, the focus will be on SiC solids and fiber composites and therefore the manufacture of both bulk and fibers, and the infiltration of a fiber matrix, are relevant.
2.1.1. Fibers
SiC fibers are generally made via either chemical solution gelling (sol-gel) processing or chemical vapor deposition (CVD). The two fibers used in this work are Nicalon, a product of Nippon Carbon, and Sylramic, from Dow Corning, and are produced by sol-gel processing. The fibers start with a silicon and carbon polymer that is spun, cured, and then pyrolyzed. The composition of the final fibers is influenced by the initial polymer, the curing process, and any sintering aids that are added. The temperature of the pyrolysis will also affect the final crystal and grain structure. CVD fibers are produced by reacting gases in a furnace and depositing the product onto a core, such as carbon fiber. [Ichikawa, 2000]
Traditionally, SiC fibers have suffered from problems such as loss of strength at moderate to high temperatures due to inclusion of impurities and amorphous microstructures. Nicalon fibers
have gone through several manufacturing changes to address these problems, and the latest Hi-Nicalon-S used in this work has been designed to have minimal excess carbon and oxygen and a highly crystalline structure. Similarly, the Sylramic fibers are stoichiometric SiC with traces of boron, nitrogen, and titanium sintering aids. Both types of fibers should have good performance at high temperatures and irradiation behavior more similar to bulk structures of crystalline, stoichiometric SiC solids. Other special stoichiometric fibers under production include Tyranno SA (Ube Industries) and UF-HM (3M).
2.1.2. Fiber Composites
To create structures from SiC fibers, a fiber preform is first constructed and then infiltrated with a matrix material. The exact process of preform construction and matrix infiltration will have an effect on the physical properties of the resulting composite. Depending on the choice of technique, preforms can be manufactured from SiC fibers in a wide range of 2-D and 3-D shapes. The preform may consist of designs as simple as parallel layers of fibers set atop one another to advanced structures woven as a textile that can allow more freedom in fiber directions. [Verpoest, 2000] The composites studied in this work were prepared as woven preforms, with their inter-fiber voids then filled by either Chemical Vapor Infiltration (CVI) or Polymer Impregnation and Pyrolysis (PIP).
Often a fiber coating or binding agent, such as a thin layer of pyrocarbon, will be applied before the matrix CVI or PIP begins (possibly even before creating the preform). This fiber coating helps to tailor the mechanical interaction between the fibers and the matrix; in particular, since the fibers can have a much higher strength than the matrix, cracks will first begin to propagate through the matrix. The interface layer allows the crack tips in the matrix to be deflected around the fiber. Then, as stress on the composite increases and significant matrix cracking occurs, this coating allows control of the fiber sliding friction as fibers are pulled out of the matrix. [Hasegawa, 2000]
Once fibers are coated and the preform is complete, the chosen method of matrix infiltration can begin. CVI is a specialization of CVD where the furnace conditions are set specifically to deposit the SiC around a pre-built fiber form. Current techniques rely either on isothermal gaseous
diffusion, forced flow of reactant gases, or gaseous diffusion with induced temperature gradients. While the CVI reaction process is similar to CVD, it is tailored to allow infiltration of the small gaps and pores in the fiber preform. There is a balance between the maximum rate of deposition and the penetration and uniformity of the deposited SiC. [US DOD, 2002] [Lara-Curzio, 2000] [Langlais, 2000]
Starting with the preform immersed in a liquid polymer, PIP can allow for a more rapid matrix formation. In this process the liquid is allowed to penetrate the preform and is then heated to catalyze SiC formation. Because of the change in density from the liquid polymer to solid SiC, several cycles of immersion and pyrolyzation may be used to help reduce matrix porosity. [Morrell, 2000]
2.1.3. Solids
For bulk SiC manufacturing, one route involves SiC powders, formed via the methods discussed above, that are then pressed and sintered into shape. Other routes include liquid phase sintering, reaction bonding, and hot-pressing. In this work, the tube forms have instead been created via CVD directly onto a graphite mandrel that is later removed. This route reduces the processing steps and allows continuous manufacturing at the cost of higher temperatures and the need to prevent introduction of gaseous impurities. The reaction takes place as gases (such as methyl trichlorosilane and hydrogen, or silane and propane) contact a heated surface and begin to form a SiC film. This film can be built up until the desired thickness, practically usually only a few centimeters, is achieved.
2.2.
Previous Studies
Given the application of SiC in a wide variety of industries, detailed information is available for the general manufacturing, properties, and in-service behavior of SiC solids and composites. Often this information can be found alongside SiC's popular sibling non-oxide ceramic materials, carbon and silicon nitride. Given the variety of manufacturing paths, and ensuing physical variations, it is important to characterize the exact form of SiC under consideration and care should be taken when generalizing information from tests on other varieties.
2.2.1. SiC for Nuclear Fusion
In fusion, SiC in the form of solid blocks and fiber composite panels has been considered as a first wall material for confined fusion experiments [Rovner, 1976] and also as a candidate coating material for diverter plates [Raffray, 2001]. These applications benefit from its strength and stability, even after exposure to very high neutron fluence and temperatures, generally in inert or low pressure atmospheres. Research in this area has produced much of the available data on SiC fiber composites in radiation fields at elevated temperatures and high fluence.
In particular, studies have focused on solids and fiber composites at temperatures up to 1200'C and at neutron doses of over 100 Displacements Per Atom (DPA). 1 DPA for SiC is equivalent to about 4 months of exposure in a PWR core, although the exact rate depends on the flux spectrum. For fusion reactors producing a substantial flux of 14 MeV neutrons the neutron-induced damage rate will be significantly higher. See Section 2.3.7 for a more detailed discussion of DPA.
In a review of the fusion literature, Raffray, et al. highlight the research done on SiC fiber and fiber-composite strength, creep, swelling, fracture toughness, and thermal conductivity, and their change with irradiation. Material development work is also discussed, and in particular the composite's irradiation behavior is shown to benefit by moving to highly stoichiometric, low-impurity fibers. As noted by Hasegawa, et al., the recent emergence of these high purity SiC materials means prior work on fiber and composite performance at high fluence and temperature needs to be reevaluated.
Another area in need of attention is chemical compatibility; for fusion this generally involves helium, lead, lithium, and beryllium, depending on the desired service location. While SiC has been found to be stable in contact with pure lithium and helium, there were some reactions with beryllium and a-phase SiC above 700'C. Oxidation due to ppm levels of oxygen in inert gas has been considered with respect to crack growth, but this type of corrosion was generally not an important focus in fusion work.
SiC joining processes are also an area of interest as the large size of fusion reactor cores would require multiple SiC composite panels, pipes, or blocks to be joined together. Several joining techniques have been developed for general use, such as reaction-bonded and polymer-based SiC or general glassy ceramics. However, the behavior under stress and irradiation, and the chemical compatibility of these joints, has not been well investigated.
2.2.2.
SiC for Nuclear Fission
SiC has been of interest for fission reactors since at least the 1960s, when it was envisioned that SiC could be used as a coating layer for fuel particles. Interest in SiC-coated micro-particle fuel for use in fuel compacts within gas-cooled reactors, such as TRISO fuel for pebble-bed and prismatic block cores, continues today. Work on coated particle fuel has produced a good collection of property data on monolithic SiC under irradiation and on the interaction of SiC thin shells with U0 2 and fission products. Other research has considered using SiC to coat the fuel compacts themselves to prevent fuel damage in high-temperature reactors where steam may be present in the coolant [Schulten, 1993]. SiC coatings over other in-reactor graphite components are intended to reduce the rate of oxidation. [Chunhe, 1995]
There has been much less work evaluating SiC behavior in typical LWR environments. It has been considered as an outer coating for U0 2 pellets in high-temperature gas-cooled reactors (HTGRs) [Kim, 2000], as a container-like casing for U0 2 pellets in LWRs [Lippmann, 2001], and as an inert matrix material for inert matrix fuel in LWRs. [Verrall, 1999] While much of this work is in early stages or not fully elaborated, it can give a general idea of SiC behavior in several regimes: interactions between the fuel and cladding, behavior of the cladding under irradiation, and interaction between the cladding and the coolant.
The significant amount of past research on SiC coated particles deserves special focus. Among the literature on SiC for coated particles, three review works stand out. The earliest, by Price [Price, 1977], covered the work on the structure and properties of SiC coatings under irradiation up to that time. The CEGA report [CEGA, 1993] on pyrocarbon and SiC has until recently provided the most thorough quantitative basis for analysis of the thermal and mechanical behavior of SiC coatings. This comprehensive and often cited volume gives convenient
summaries of SiC properties needed for computer modeling. In 2007, Snead [Snead, 2007] published a "handbook" of SiC properties specifically aimed at providing a more up-to-date and comprehensive reference for SiC under irradiation than the CEGA report.
The use of SiC as a layer in coated particle fuels for fission reactors has been considered since the 1960s. The fuel kernel (often an oxide or carbide) is surrounded by a thin SiC layer to hold the particle together mechanically and seal in fission products. This can be combined with alternating pyrocarbon layers for protection, such as in TRISO fuel, which consists of the spherical kernel, then a carbon buffer and pyrocarbon layer, the SiC layer, and finally an outer pyrocarbon layer. Individual particles are suspended in a matrix, such as a carbon compact, which are shaped as needed for the core. Such a design should allow rapid production of large numbers of coated particles that have good thermal, chemical, and radiation resistance. [Gilchrist, 1972]
For coated particles, the SiC is applied by CVD, often using a fluidized bed chemical reactor. It is recognized that the CVD process allows for the easiest application of the thin, uniform coating, as well as creation of highly stoichiometric, crystalline SiC while minimizing chemical impurities. As discussed above, it has been determined that this type of SiC offers the best performance at elevated temperatures and in a radiation environment. [Snead, 2007]
Beyond the characterization of the SiC properties, the mechanical and chemical behavior of these thin shells has been of intense interest. The consistency of SiC layer preparation is critical as for an approximately 1 mm diameter TRISO particle, the SiC layer is only 35 pm thick. Predicting TRISO performance requires consideration of the statistical behavior of SiC failure as well as the interaction between SiC and solid and gaseous fission products.
Deposition of SiC directly on to a U0 2 LWR fuel pellet was investigated by Kim, et al. [Kim, 2000], where the goal was to form a resilient, impermeable layer to prevent the release of fission products and the reaction of coolant contaminants with the fuel. This work was based on experience with coating spherical fuel particles with layers of SiC at temperatures low enough to prevent significant microstructural alteration of the U0 2. Samples were prepared via several
CVD steps that included the application of an inner pyrocarbon layer and then silicon from silane gas. The pellet was then heated above 1300 C and the layers ignited to form an approximately 10 pm thick layer of
p-SiC
between the layers of pyrocarbon.Lippmann, et al. [Lippmann, 2001] took this concept a step further and examined 8 mm diameter U02 pellets that were encased in pre-made 2 mm thick, 16 mm tall SiC capsules. It was proposed that hermetic encapsulation could help prevent fuel-coolant interaction during severe accidents. This would avoid the dispersal of molten fuel material and the release of fission products in the event of cladding failure. To test their performance after cladding failure, the capsules were exposed to air and water vapor in furnaces between 1500 and 1800'C. While the corrosion rate was not quantified, they noted that it was doubled by the presence of the water vapor. However,
it was concluded that this oxidation would not be a limiting factor for their application.
2.3. SiC Properties
Quantification of the behavior of SiC under LWR conditions is critical to its qualification for use in commercial LWRs. While a significant number of both single-factor and integral tests are still needed, this section attempts to summarize the relevant available data to date. Accurate property models as specific as possible to the type of SiC to be used in the cladding need to be developed and integrated into fuel performance and safety codes so that the vendors, utilities, and regulators can properly judge the performance of SiC fuel in their reactors.
An exhaustive analysis of all SiC properties is not needed to reasonably model cladding behavior, and codes differ as to which properties they consider in their analysis. The following is a list of the most important properties and behaviors to consider:
- Density
- Decomposition temperature - Fracture strength
- Elastic modulus
- Poisson's ratio - Hardness - Thermal expansion - Creep - Swelling - Thermal conductivity - Emissivity - Corrosion - Crud accumulation
These will be influenced by the manufacturing of the SiC (microstructure, macrostructure, and impurities) as well as the environment (chemicals, radiation, heat, and stress).
Many of these properties were discussed in relation to models for the FRAPCON code in previous work by this author [Carpenter, 2006], generally with respect to fiber composites. The following sections address those important items not covered in that work. More detailed correlations for solid SiC mechanical and thermal properties can be found in the recent handbook by Snead, et al. [Snead, 2007].
It should be noted that there are commonly significant differences in the variation of property behavior with temperature and irradiation between fibers, fiber-composites, and monolithic SiC due to the form factor, microstructure, and presence of impurities like excess silicon and carbon and sintering agents.
2.3.1. Structure and Density
SiC consists of a tetrahedral structure of CSi4/SiC4 with strong covalent and weak ionic bonding
between the carbon and silicon. Generally SiC is described as either a- or p-phase, where a-phase is regarded as the higher-temperature fonm. The reality is more complex, as SiC has over 200 known crystal polytypes that can form and survive on an overlapping range of temperatures. The only stable symmetric cubic form is 3C-SiC (p-SiC), and all other polytypes are classified as
a-SiC. Aside from 3C-SiC, the most common crystal structures are hexagonal (4H- and 6H-SiC) and rhombohedral (15R-SiC). [Snead, 2007]
At room temperature the density of
p-SiC
and the common hexagonal a-SiC polytypes is 3.21 g/cm3. This density can be achieved in production via CVD for homogeneous applications. The density of latest-generation SiC fibers (such as Hi-Nicalon and Sylramic) may be up to 15% lower due to non-stoichiometry (excess carbon and silicon or separation of phases) and impurities (introduced as sintering aids or atmospheric contaminates, e.g. oxygen and boron). [Hasegawa, 2000] Composites using these fibers and utilizing CVI or PIP matrix infiltration have an additional reduction in density due to introduction of matrix voids (up to 15%). The precise reduction in bulk density will depend on the specifics of the structure of the fiber preformand the infiltration process. [Youngblood, 2004]
2.3.2. Strength and Elastic Moduli
One of the most obvious changes when moving from a metal to a ceramic cladding is the loss of ductility. While SiC has a high strength, its creep will only appreciable at very high temperatures (~1300'C) and it has an elastic modulus several times higher than most metals; this dictates that in normal LWR temperature conditions applied stresses will not be relieved by yielding.
Because of the low fracture toughness of SiC, and because failure is dictated by the largest initial flaw, its strength is well characterized by Weibull fracture theory. [Hong, 2007] [Miller, 2003] Given a large set of representative samples, Weibull parameters can be calculated that describe the statistical spread in mechanical failures from the theoretical strength. The failure probability Pf is often expressed in the form:
Pf = 1 - e Eq. 2-1
Where G is the strength and (o and m are the Weibull fitting parameters. A small Weibull
modulus, m, indicates larger scatter in the failure data, and therefore less predictable behavior for materials in-service. Years of testing on the many variations of SiC have produced a wide range
of values of this modulus, from 2 to 12, though it is expected to fall between 4 and 6 for the CVD SiC used in modem TRISO fuels. Understanding the flaw distribution, and how to reduce flaws through careful control of the manufacturing and final SiC surface preparation, are key to obtaining consistency in fracture strength. [Snead, 2007]
Snead, et al. reports a wide range of fracture strengths for solid CVD SiC, with very high values for coated particle shells (up to 3170 MPa) and the lowest values for bulk bars (212 MPa). This disparity may be explained by variations in preparation of the SiC specimens, especially their surfaces. Specimens with large surface areas and poor finishes will have a higher likelihood of having a large initial flaw to initiate failure.
The mechanical behavior of the fiber-composite is further complicated by the different stages of failure. The primary advantage of the composite is the more graceful failure mode, as the lower-strength matrix material cracks first. Cracks then propagate around the fibers (facilitated by the fiber coating or binder layer), and the stress on the composite layer can be transferred onto the fibers alone. The matrix cracks and binder layer allow the fibers to pull out and give the composite a pseudo-ductility until the fibers' fracture strength is reached. [Lara-Curzio, 2003]
The initial strength of the composite is therefore a function of the fiber and matrix system, but is lower than the fracture strength of the fibers alone. The composite also has significant anisotropy, as the strength and rigidity of the fibers runs only parallel to their axis. 3-D fiber weaves allow this anisotropy to be tailored, but this does lead to increased complexity when considering explicit modeling of a composite layer.
Data on the variation of monolithic SiC strength with irradiation compiled by Snead show that it is unchanged or slightly increased for CVD SiC, but may be decreased by over 50% in other types of SiC with higher concentrations of impurities. In the work by Carpenter, SiC composites with Hi-Nicalon fibers had 15-50% reduction in ultimate tensile strength. This suggests that irradiation may adversely affect the composite strength much more than the monolith.