Toxins 2021, 13, 25. 10.3390/toxins13010025 1 of 7
Can Cyanobacterial Diversity in the Source Predict the
Diversity in Sludge and the Risk of Toxin Release in a
Drink-ing Water Treatment Plant?
Farhad Jalili, Hana Trigui, Juan Francisco Guerra Maldonado, Sarah Dorner, Arash Zamyadi, B. Jesse Shapiro, Yves Terrat, Nathalie Fortin, Sébastien Sauvé and Michèle Prévost
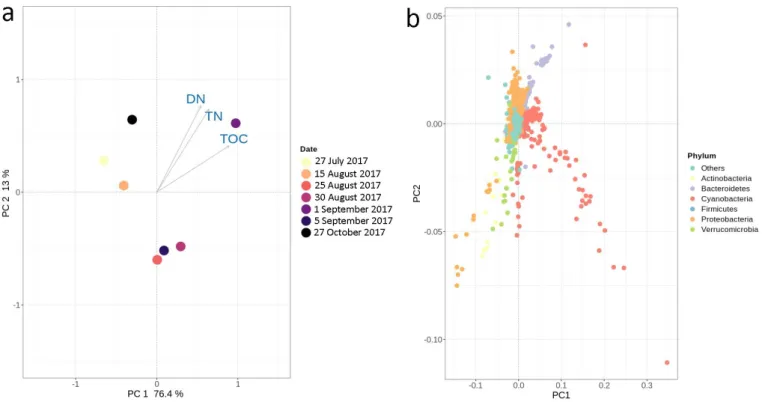
Figure S1. Principle components analysis (PCA) of nutrient parameters’ impact on a) sampling dates, b) bacterial diversity
(phylum level) in raw water (RW) on 27 July, 15, 25, 30 August, 1, 5 September and 27 October 2017. Only the significant parameters were shown (p < 0.05).
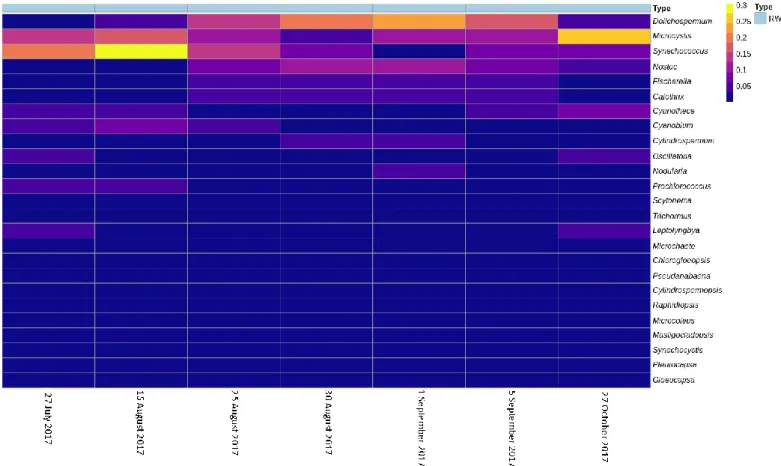
Figure S2. Relative abundance of the top 25 major abundant genera in the raw water (RW). Samples taken on 27 July, 15,
Toxins 2021, 13, 25. 10.3390/toxins13010025 3 of 7
Figure S3. Relative abundance of the top 25 major abundant genera in sludge holding tank (ST)
and sludge holding tank supernatant (SST). Samples taken on 30 August and 5 September 2017.
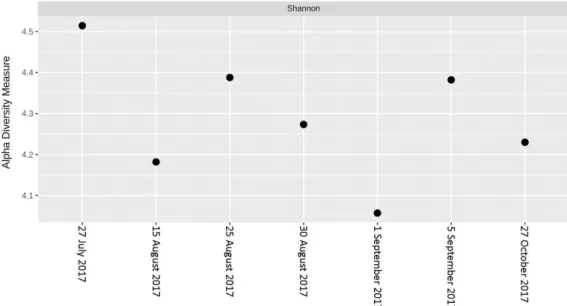
Figure S4. Evaluation of the cyanobacterial diversity in raw water (RW) on 27 July, 15, 25, 30
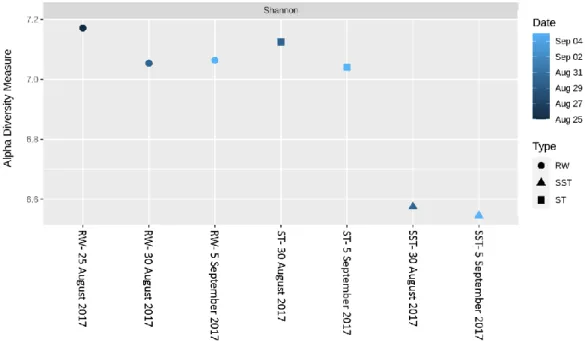
Figure S5. Bacterial diversity in the raw water (RW) on 25, 30 August and 5 September 2017, sludge holding tank (ST) and
Toxins 2021, 13, 25. 10.3390/toxins13010025 5 of 7
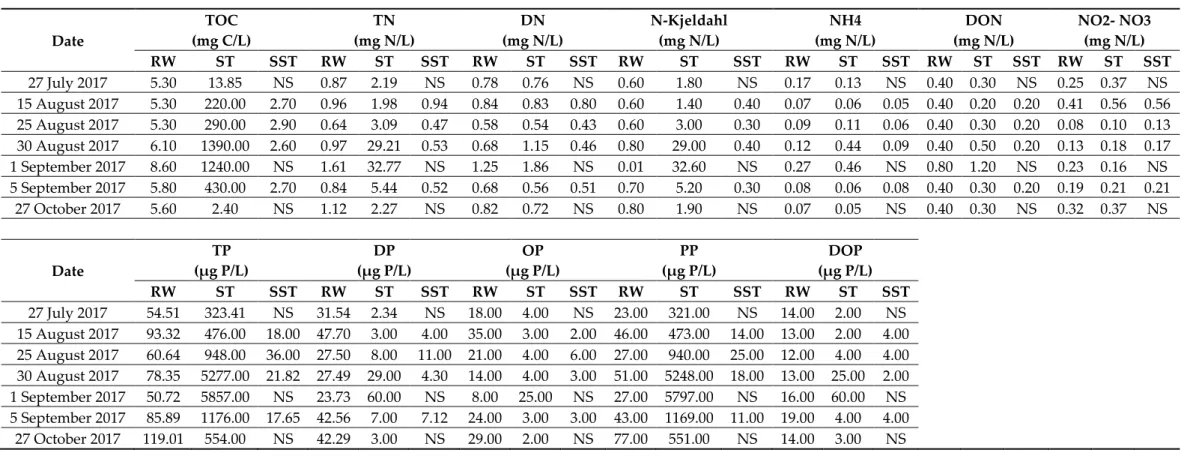
Table S1. Concentration of nutrients in raw water (RW), sludge holding tank (ST) and sludge tank supernatant (SST) on 27 July, 15, 25, 30 August, 1, 5 September and 27
October 2017. NS: Sample not taken.
Date TOC (mg C/L) TN (mg N/L) DN (mg N/L) N-Kjeldahl (mg N/L) NH4 (mg N/L) DON (mg N/L) NO2- NO3 (mg N/L) RW ST SST RW ST SST RW ST SST RW ST SST RW ST SST RW ST SST RW ST SST 27 July 2017 5.30 13.85 NS 0.87 2.19 NS 0.78 0.76 NS 0.60 1.80 NS 0.17 0.13 NS 0.40 0.30 NS 0.25 0.37 NS 15 August 2017 5.30 220.00 2.70 0.96 1.98 0.94 0.84 0.83 0.80 0.60 1.40 0.40 0.07 0.06 0.05 0.40 0.20 0.20 0.41 0.56 0.56 25 August 2017 5.30 290.00 2.90 0.64 3.09 0.47 0.58 0.54 0.43 0.60 3.00 0.30 0.09 0.11 0.06 0.40 0.30 0.20 0.08 0.10 0.13 30 August 2017 6.10 1390.00 2.60 0.97 29.21 0.53 0.68 1.15 0.46 0.80 29.00 0.40 0.12 0.44 0.09 0.40 0.50 0.20 0.13 0.18 0.17 1 September 2017 8.60 1240.00 NS 1.61 32.77 NS 1.25 1.86 NS 0.01 32.60 NS 0.27 0.46 NS 0.80 1.20 NS 0.23 0.16 NS 5 September 2017 5.80 430.00 2.70 0.84 5.44 0.52 0.68 0.56 0.51 0.70 5.20 0.30 0.08 0.06 0.08 0.40 0.30 0.20 0.19 0.21 0.21 27 October 2017 5.60 2.40 NS 1.12 2.27 NS 0.82 0.72 NS 0.80 1.90 NS 0.07 0.05 NS 0.40 0.30 NS 0.32 0.37 NS Date TP (μg P/L) DP (μg P/L) OP (μg P/L) PP (μg P/L) DOP (μg P/L) RW ST SST RW ST SST RW ST SST RW ST SST RW ST SST 27 July 2017 54.51 323.41 NS 31.54 2.34 NS 18.00 4.00 NS 23.00 321.00 NS 14.00 2.00 NS 15 August 2017 93.32 476.00 18.00 47.70 3.00 4.00 35.00 3.00 2.00 46.00 473.00 14.00 13.00 2.00 4.00 25 August 2017 60.64 948.00 36.00 27.50 8.00 11.00 21.00 4.00 6.00 27.00 940.00 25.00 12.00 4.00 4.00 30 August 2017 78.35 5277.00 21.82 27.49 29.00 4.30 14.00 4.00 3.00 51.00 5248.00 18.00 13.00 25.00 2.00 1 September 2017 50.72 5857.00 NS 23.73 60.00 NS 8.00 25.00 NS 27.00 5797.00 NS 16.00 60.00 NS 5 September 2017 85.89 1176.00 17.65 42.56 7.00 7.12 24.00 3.00 3.00 43.00 1169.00 11.00 19.00 4.00 4.00 27 October 2017 119.01 554.00 NS 42.29 3.00 NS 29.00 2.00 NS 77.00 551.00 NS 14.00 3.00 NS
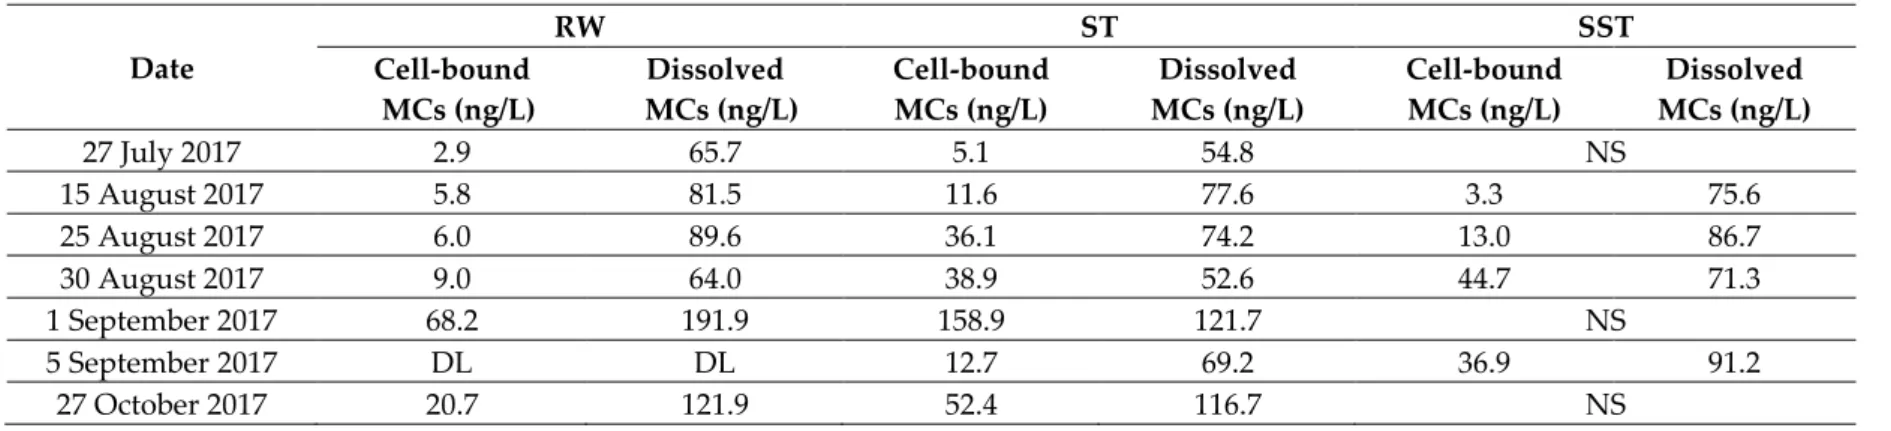
Table S2. Concentrations of cell-bound and dissolved microcystins (MCs) in the RW (raw water), (ST) sludge holding tank and (SST) sludge holding tank. DL: below
detection limit. NS: sample mot taken.
Date RW ST SST Cell-bound MCs (ng/L) Dissolved MCs (ng/L) Cell-bound MCs (ng/L) Dissolved MCs (ng/L) Cell-bound MCs (ng/L) Dissolved MCs (ng/L) 27 July 2017 2.9 65.7 5.1 54.8 NS 15 August 2017 5.8 81.5 11.6 77.6 3.3 75.6 25 August 2017 6.0 89.6 36.1 74.2 13.0 86.7 30 August 2017 9.0 64.0 38.9 52.6 44.7 71.3 1 September 2017 68.2 191.9 158.9 121.7 NS 5 September 2017 DL DL 12.7 69.2 36.9 91.2 27 October 2017 20.7 121.9 52.4 116.7 NS
Toxins 2021, 13, 25. 10.3390/toxins13010025 7 of 7
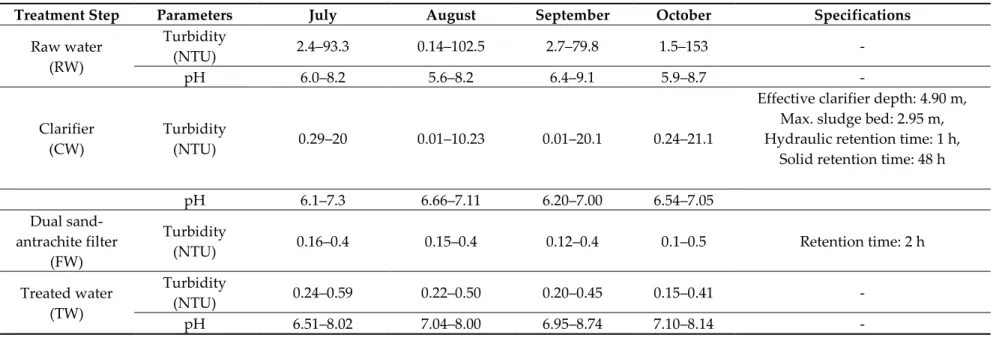
Table S3. Water characteristics of the studied plant in Missisquoi Bay during the sampling campaign from July to October 2017.
Treatment Step Parameters July August September October Specifications
Raw water (RW) Turbidity (NTU) 2.4–93.3 0.14–102.5 2.7–79.8 1.5–153 - pH 6.0–8.2 5.6–8.2 6.4–9.1 5.9–8.7 - Clarifier (CW) Turbidity (NTU) 0.29–20 0.01–10.23 0.01–20.1 0.24–21.1
Effective clarifier depth: 4.90 m, Max. sludge bed: 2.95 m, Hydraulic retention time: 1 h,
Solid retention time: 48 h
pH 6.1–7.3 6.66–7.11 6.20–7.00 6.54–7.05
Dual sand-antrachite filter
(FW)
Turbidity
(NTU) 0.16–0.4 0.15–0.4 0.12–0.4 0.1–0.5 Retention time: 2 h
Treated water (TW)
Turbidity
(NTU) 0.24–0.59 0.22–0.50 0.20–0.45 0.15–0.41 -