Analysis of location uncertainty for a microearhquake cluster: A case study
Gabriela Melo∗, Alison Malcolm, Oleg Poliannikov, and Michael FehlerEarth Resources Laboratory - Earth, Atmospheric, and Planetary Sciences Department - MIT SUMMARY
In many reservoirs, an increase in permeability and conduc-tivity is achieved by hydraulic fracturing/stimulations which open cracks and fractures that then act as pathways for flu-ids to navigate in the subsurface. Mapping, localization, and general characterization of these fracture systems is of key im-portance in oil, gas, and geothermal energy production. The location of the microseismic events triggered during hydraulic fracturing or stimulation can help to characterize the proper-ties of the fracture system. There are many different methods for localizing microearthquakes and, in general, these meth-ods yield different locations, velocity models, and event ori-gin times, due to differences in algorithms and input models. Here we focus on studying location confidence intervals as-sociated with two localization methods, classical (triangula-tion) and Double-Difference, where uncertainties due to ori-gin times can be marori-ginalized away, thus decreasing uncer-tainties in the event locations. We relocate events using these two methods and three different velocity models. Of the two methods used here, Double-Difference produces smallest con-fidence regions. We also illustrate that, for our dataset in par-ticular, marginalizing away the influence of the unknown ori-gin times also improves the confidence intervals.
INTRODUCTION
Geothermal energy is a leading potential source of sustainable energy. An important challenge in geothermal sites is that they often lack the desirable high porosity and permeability. In fact, currently, most geothermal sites are in dry non-permeable rock (Majer et al., 2007). The so-called Enhanced Geother-mal System (EGS) technologies can enhance or create geother-mal resources in hot dry rock by creating the subsurface con-ditions (in particular, the permeability) that are necessary for the exploitation of otherwise uneconomic geothermal systems (Allis, 1982; Batra, 1984; Fehler, 1989).In many reservoirs, this increase in permeability is achieved by hydraulic frac-turing/stimulation. The opened cracks and fractures work as paths for cold water to flow, from injection to production wells, and be heated sufficiently before being pumped to the surface for energy extraction. Thus, mapping, localization, and gen-eral characterization of fracture systems in these reservoirs are crucial for geothermal energy production.
The microseismicity normally triggered during hydraulic stim-ulation is believed to generally occur along newly created and preexisting fractures. Therefore, microearthquakes are usually used for locating and characterizing reservoir fracture systems (Michaud et al., 2004; Bennett et al., 2006; Huang et al., 2006; Majer et al., 2007). Microseismic data are also a potential
source of other important information that can be used, for example, in reservoir imaging and inversion for physical pa-rameters related to, for example, the stress and/or scattering conditions of the field.
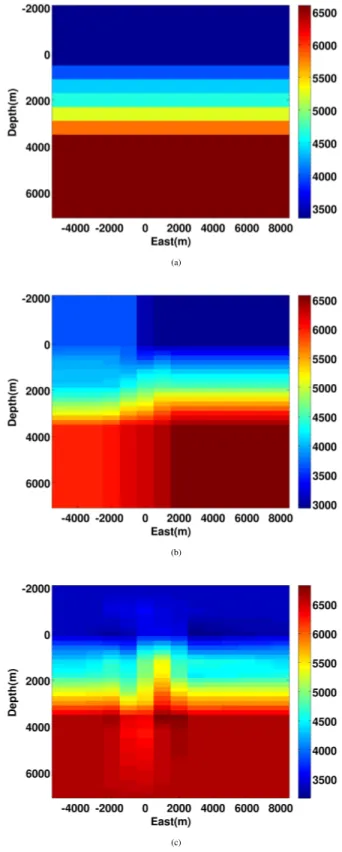
In general, algorithms used to localize microseismic events jointly perform tomography and event location, leading to dif-ferent hypocenter locations, event origin times, and velocity models. However, accurate localization of microearthquake hypocenters remains an active area of research. There are sev-eral different types of localization methods. Here we focus on two types, Classical (Geiger, 1912) and Double-Difference (Waldhauser and Ellsworth, 2000; Zhang and Thurber, 2003). In general, different methods result in different sets of loca-tions due to for example, noise in the data, errors in traveltime picking, and uncertainties and differences in the velocity mod-els. In practice, unfortunately, there is no feasible way to check which locations are correct. Thus, to judge which set of loca-tions seem to be the most accurate, one relies on aspects like how well events cluster, the collapsing of the event locations on planes (thus being associated with propagating fractures or reactivated faults), the correlation between hypocenters and local formation geology, the correlation between hypocenters and velocity heterogeneities, etc. (Fehler et al., 1987). Here we study uncertainties in the locations of a cluster of 69 microearthquakes from a geothermal field. So far, events in this dataset has been located with three different localiza-tion methods, Figure 1. The first set of localocaliza-tions was ob-tained through a simple standard localization method based on Geiger’s method (Geiger, 1912) (method-1) using a simple 1D velocity model (velocity model-1, Figure 2(a)). The sec-ond set was obtained through a joint tomography-localization method (Block et al., 1994) (method-2). This method is based on absolute arrival times only and uses the locations and veloc-ity model from method-1 as a starting point to jointly calcu-late the microearthquake hypocenter parameters while build-ing a more refined 3D velocity model (velocity model-2, Fig-ure 2(b)). Finally, the third set was obtained through another joint tomography-localization method that uses both absolute and relative arrival times (Zhang and Thurber, 2003) (method-3). This method also uses results from method-1 as a starting point to jointly invert for the hypocenter parameters and update the velocity model (velocity model-3, Figure 2(c)).
Since the current event locations have no clear estimates of location uncertainties, here we relocate the events using two localization methods (Poliannikov et al., 2013) that allow for uncertainty region estimates. Here we use only P-wave arrivals and velocity models to relocate the events. For each method, we relocate the events using the three above mentioned ve-locity models, and study the respective location uncertainties. Even though here we study a field dataset from a geother-mal reservoir, our analysis can be applied to any microseismic dataset from either exploration or earthquake seismology.
−5000 0 5000 −5000 0 5000 −2000 0 2000 4000 6000 East (m) Depth (m) North (m)
Figure 1: Microearthquake clusters and station coverage. Green triangles are the station locations. Blue circles corre-spond to the locations obtained through method-1, red circles are locations obtained through method-2, and black circles are locations obtained through method-3. Here the circles corre-spond to point locations only.
THE LOCALIZATION METHODS
Poliannikov et al. (2013) showed that locations of microseis-mic events can be improved by using available information about previously located events, in comparison to locating each event independently. Here we use two of the methods de-scribed in their work:
• Classical localization (triangulation method): events are located individually, i.e., information about previ-ously located events is not used to improve the loca-tions of subsequent events;
• Double-difference: instead of locating events individu-ally, this method proposed by Waldhauser and Ellsworth (2000) uses information about previously located events as constraints to improve the locations of subsequent events. In general, this method requires that previ-ously located and subsequent events are closely located and have well-correlated waveforms. Here we consider pairs of events with at least 70% correlation. By de-sign, this improves at least the relative location among events.
Under the assumption of independent Gaussian noise in the data, they estimate confidence regions associated with each method for various scenarios (varying signal-to-noise ratio, un-certainty in the velocity model, etc). Confidence regions are estimated in terms of location probability density functions (PDF’s). Variations of the main methods are presented for sit-uations such as when event origin times estimates are available or not, and whether the velocity model is assumed correct or uncertain. For both methods used here we assume the velocity model is known but origin times are unknown, and apply both methods to three velocity models.
(a)
(b)
(c)
Figure 2: Velocity models used in localization (a) method-1, (b) method-2, and (c) method-3.
For our dataset, in order to illustrate the effect of using ori-gin time estimates versus assuming they are completely un-known, we perform a brief experiment. Given that we already have three sets of locations, it is possible to estimate the origin times based on these pre-locations (from here on we refer to the location results from the three methods mentioned in the Introduction as pre-locations). We illustrate this for one event; using the pre-location and velocity model from method-1, we can estimate its origin time by:
• calculating propagation times from plocations to re-ceivers;
• subtracting propagation times from absolute arrival times; • averaging over all receivers.
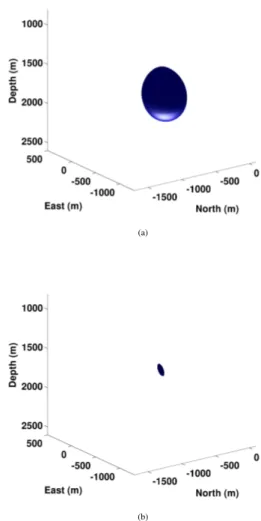
The estimated origin times are then subtracted from the abso-lute arrival times, giving traveltime data that can be used in a classical localization method that fits observed to predicted propagation times (triangulation). In this way, we obtain the 95% confidence region for the location of this event as seen in Figure 3(a).
For comparison, we then localize this same event using a mod-ified version of Classical localization that marginalizes away the origin time. The 95% confidence region for the new lo-cation is shown in Figure 3(b). We see that marginalizing the origin time away improves the confidence region because marginalization uses the fact that the origin time (including the error associated with its estimate) is the same for all receivers. Similar observations are valid for all events studied here.
Next, we relocate events with both Classical and Double-Difference without the need of origin time estimates.
CLUSTER LOCATION RESULTS
Now we relocate the entire cluster using the two previously mentioned methods and three velocity models, thus giving us a total of six different cluster locations.
The color coding used here is the same as before: blue corre-sponds to velocity 1, red correcorre-sponds to velocity model-2, and black corresponds to velocity model-3.
Figure 4(a) and Figure 4(b) and shows the results of Classi-cal and Double-Difference loClassi-calization for the three models, respectively. We notice that the uncertainty regions are much smaller for locations obtained through Double-Difference. This is expected: in the Double-Difference method, by subtracting arrival times of pair of events that travel along similar paths and averaging over receivers, uncertainty due to velocity er-rors largely cancels, thus improving the location confidence intervals.
Also notice that the confidence regions are stretched vertically. This is expected due to the fact that all stations lie above the events and, even though station coverage is sparse, have a large aperture, thus constraining horizontal directions better than the vertical.
(a)
(b)
Figure 3: 95% confidence interval for the location of an event obtained through Classical method (a) assuming an (estimate) of the event origin time e (b) marginalizing away the origin time.
(a)
(b)
Figure 4: Microearthquake clusters locations from the (a) Classical and (b) Double-Difference methods. Confidence re-gions in blue, red, and black correspond to velocity model-1, -2, and -3, respectively.
CONCLUSIONS AND FUTURE WORK
Here we presented results from the relocation of a cluster of microseismic events from a geothermal reservoir using both Classical and Double-Difference localization methods. For each method, events were relocated using three different ve-locity models. First, using the Classical method, we illustrated how marginalizing origin times away improves the location confidence interval. Next, we observed how relative localiza-tion (Double-Difference) makes better use of available infor-mation from previously located events leading to improved lo-cation confidence intervals.
In order to add more information for the uncertainty analysis, future work includes incorporating S-wave arrivals and veloc-ity models in the localization process and studying how the confidence intervals vary as function of uncertainties in the data for our dataset. Ultimately, we will correlate results from microseismic locations with other available information about the field to be able to choose the velocity model that best rep-resents the field, thus allowing us to better charactering the fracture system through microseismic data.
Acknowledgments
This work is supported by grants from the Department of En-ergy (DE-FG36-08GO18197), the National Science Founda-tion (DMS1115406), and the founding members consortium at Earth Resources Laboratory (ERL).
REFERENCES
Allis, R. G., 1982, Mechanism of induced seismicity at the Geysers Geothermal Reservoir, California: Geophysical Research Letters, 9, 629–632.
Batra, R., 1984, Downhole seismic monitoring of an acid treat-ment in the Beowawe geothermal field: Los Alamos Na-tional Laboratory.
Bennett, L., J. L. Calvez, D. R. R. Sarver, K. Tanner, W. S. Birk, G. Waters, J. Drew, G. Michaud, P. Primiero, L. Eis-ner, R. Jones, D. Leslie, M. J. Williams, J. Govenlock, R. C. R. Klem, and K. Tezuka, 2005–2006, The source for hydraulic fracture characterization: Oilfield Review, 17, 42–57.
Block, L. V., C. H. Cheng, M. C. Fehler, and W. S. Phillips, 1994, Seismic imaging using microearthquakes induced by hydraulic fracturing: Geophysics, 59, 102–112.
Fehler, M., 1989, Stress control of seismicity patterns observed during hydraulic fracturing experiments at the Fenton Hill hot dry rock geothermal energy Mechanics, Mining Sci-ences and Geomechanics Abstracts, 26, 211 – 219. Fehler, M., L. House, and H. Kaieda, 1987, Determining
planes along which earthquakes occur: Method and appli-cation to earthquakes accompanying hydraulic fracturing: J. Geophys. Res., 92, 9407–9414.
Geiger, L., 1912, Probability method for the determination of earthquake epicenters from the arrival time only: Bulletin of St. Louis University, 8, 60–71.
Huang, Y. A., J. Chen, and J. Benesty, 2006, Time delay esti-mation and acoustic source localization, in Acoustic MIMO Signal Processing: Springer US, Signals and Communica-tion Technology, 215–259.
Majer, E. L., R. Baria, M. Stark, S. Oates, J. Bommer, B. Smith, and H. Asanuma, 2007, Induced seismicity associ-ated with Enhanced Geothermal Systems: Geothermics, 36, 185 – 222.
Michaud, G., D. Leslie, J. Drew, T. Endo, and K. Tezuka, 2004, Microseismic event localization and characterization in a limited aperture HFM experiment: SEG Expanded Ab-stracts, 23.
Poliannikov, O., M. Prange, A. Malcolm, and H. Djikpesse, 2013, A unified Bayesian framework for relative microseis-mic location: In press Geophysical Journal International. Waldhauser, F., and W. L. Ellsworth, 2000, A
double-difference earthquake location algorithm: Method and ap-plication to the northern Hayward fault, California: Bulletin of the Seismological Society of America, 90, 1353–1368. Zhang, H., and C. H. Thurber, 2003, Double-difference
tomog-raphy: The method and its application to the Hayward fault, California: Bulletin of the Seismological Society of Amer-ica, 93, 1875–1889.