Publisher’s version / Version de l'éditeur:
Cytometry Part B: Clinical Cytometry, 78B, 1, pp. 41-48, 2010-01-01
READ THESE TERMS AND CONDITIONS CAREFULLY BEFORE USING THIS WEBSITE.
https://nrc-publications.canada.ca/eng/copyright
Questions? Contact the NRC Publications Archive team at
PublicationsArchive-ArchivesPublications@nrc-cnrc.gc.ca. If you wish to email the authors directly, please see the first page of the publication for their contact information.
NRC Publications Archive
Archives des publications du CNRC
This publication could be one of several versions: author’s original, accepted manuscript or the publisher’s version. / La version de cette publication peut être l’une des suivantes : la version prépublication de l’auteur, la version acceptée du manuscrit ou la version de l’éditeur.
For the publisher’s version, please access the DOI link below./ Pour consulter la version de l’éditeur, utilisez le lien DOI ci-dessous.
https://doi.org/10.1002/cyto.b.20487
Access and use of this website and the material on it are subject to the Terms and Conditions set forth at
QASI, an international quality management dystem for CD4 T-Cell
enumeration focused to make a global difference
Bergeron, Michèle; Ding, Tao; Houle, Guy; Arès, Linda; Chabot, Christian;
Soucy, Nadia; Seely, Peggy; Sherring, Alice; Bogdanovic, Dragica; Faucher,
Sylvie; Somorjai, Ray; Summers, Randy; Sandstrom, Paul
https://publications-cnrc.canada.ca/fra/droits
L’accès à ce site Web et l’utilisation de son contenu sont assujettis aux conditions présentées dans le site LISEZ CES CONDITIONS ATTENTIVEMENT AVANT D’UTILISER CE SITE WEB.
NRC Publications Record / Notice d'Archives des publications de CNRC:
https://nrc-publications.canada.ca/eng/view/object/?id=66b46ced-e5b2-4b85-890f-c3acf0053773 https://publications-cnrc.canada.ca/fra/voir/objet/?id=66b46ced-e5b2-4b85-890f-c3acf0053773QASI, an International Quality Management System for CD4 T-Cell Enumeration Focused to Make a Global Difference
Michèle Bergeron,1 Tao Ding,1 Guy Houle,1 Linda Arès, 1 Christian
Chabot,1 Nadia Soucy, 1Peggy Seely,1 Alice Sherring,1 Dragica
Bogdanovic,1 Sylvie Faucher,1 Ray Somorjai, 2Randy Summers,2 Paul
Sandstrom 1
1
National HIV Immunology Laboratory, National Microbiology Laboratory, Public Health Agency of Canada, Ottawa, Ontario, Canada
2
Institute for Biodiagnostics, National Research Council Canada, Winnipeg, Manitoba, Canada
ABSTRACT
Background: A significant world-wide mobilization effort to treat people with HIV disease began in 2003. Most guidelines for initiating antiretroviral therapy (ART) require reliable and reproducible CD4 T-cell counting. Therefore any effort that improves global availability of quality managed assessment schemes for CD4 T-cell enumeration is a positive
achievement towards the world-wide reduction of AIDS.
Method: For over a decade the Canadian QASI-Quality Management System (QMS) has been in operation. More recently it has fine-tuned its strategy to optimize the global impact in the fight against the AIDS
pandemic. Three modifications were implemented: 1) introduction of skills and knowledge transfer workshops; initiation of national quality
management programs for CD4 counting, (2) introduction of a road map to establish domestic EQAP for countries that are ready, (3) introduction of a statistical analysis package which permits continuous monitoring of the global impact the QASI-QMS.
Results: Based on QASI-QMS distributed stressed specimens, over four consecutive participation cycles; there was decreased inter-laboratory variation for both low and medium CD4 T-cell levels. After three cycles of consecutive participation, there is an average of 38% and 26% error reduction reported for the Mid and Low CD4 levels respectively.
Conclusion: The above program embellishments have a profound overall performance enhancement effect on laboratories participating in the QASI-QMS. There is a significant reduction in inter-laboratory variability of CD4 T-cell counts resulting from continuous participation in the QASI-QMS.
Keywords: quality management system; quality assessment program; quality assessment schemes; inter-laboratory variation; quality
awareness; national quality intelligence
Running title: QASI; CD4 Quality Management System
Corresponding author: Michèle Bergeron
Public Health Agency of Canada 100 Eglantine Driveway, PL 0603B1
Tunney’s Pasture, Ottawa, Ontario, Canada, K1A 0K9 michele_bergeron@phac-aspc.gc.ca
Introduction:
HIV infection remains one of the leading causes of morbidity and mortality world wide. Around 90% of people living with HIV reside in resource limited countries (1). During the past decade thanks to some remarkable price reduction for antiretroviral therapy (ART), intervention to diminish suffering from AIDS has dramatically increased globally. While the ambitious target of the WHO campaign of treating 3 million individuals by the end of year 2005 was not reached (1), it did prove that mobilization of massive intervention against AIDS on a global scale is possible.
Unfortunately, the cost reductions achieved for ART, did not bring about parallel reductions of other major costs associated with HIV patient management. For adults, the absolute CD4 T-cell count is a pivotal
indicator of the patient’s immune status. More specifically, it is used for
staging and monitoring HIV positive individuals several times a year leading up to and during the life long ART. According to current WHO and CDC recommendations when the CD4 T-cell count drops to 200 cells per µL, ART is initiated even if the patient is asymptomatic (2).
Flow Cytometry remains the most frequently used method to count CD4 T-cells. Many of the newer affordable systems are more cost effective compared to traditional larger clinical instruments (3). Recent models have more simplified operating systems without compromise in accuracy.
Most assay protocols have improved. Some have innovative automated features and many are supplied with improved reagents. There are now significant number of instruments operating world wide under difficult environments where there are often chronic deficiencies in both laboratory infrastructure and human resources. Under such conditions providing quality managed CD4 counts is an enormous challenge. For example, conditions endured in some sub-Saharan rural locations are not conducive to operate a laboratory and try to follow quality management principles (4, 5). It is clear that with the massive mobilization efforts to increase access to ART, some parallel interventions such as external support for CD4 T-cell count performance management, must also be considered.
Back in 1996, an international effort was initiated to assist with quality management of infectious immunology laboratories in resource poor settings. A leading Californian clinical immunologist from UCLA, John Fahey, decided to reduce the enormous existing disparity in health care services specific to the field of infectious immunology between the Northern and Southern hemispheres. He was successful at obtaining a grant from the Fogarty International Centre. A program was established that is now part of the overall international effort to stop the AIDS pandemic in resource limited regions. His objective was to introduce the
quality system approach to diagnostics where ever the laboratories are. Thanks to John Fahey`s initial effort, a partnership was established between his institution, the University of Adelaide in Australia and Health Canada’s National HIV Immunology Laboratory in Ottawa. During the Vancouver International AIDS Congress in 1996, a without-fee external quality assessment program (EQAP) was launched to deal with HIV disease related immune status monitoring in resource poor countries. This new initiative was named: Quality Assessment and Standardization for
Immunological measures relevant to HIV/AIDS (QASI). To this day, the
only objective addressed by the QASI-Quality Management System (QMS) has been the quality assessment challenge of T-cell subset enumeration. The QASI-QMS is operated by the National HIV
Immunology Laboratory (NHIL) of the Public Health Agency of Canada in Ottawa. Over the past decade NHIL has formed close alliances and partnerships with the World Health Organization (WHO), Centers of Disease Control and Prevention (CDC), and the Clinton Foundation to facilitate global access to quality managed clinical laboratories. To
improve effective external implementation of global quality assessment for CD4 T-cells, the most significant break-through occurred when more affordable flow cytometers designed for resource limited regions all shifted to a volumetric analysis using single platform technology (SPT) for
CD45 MAb triggered gating strategy is compatible with commercially prepared stabilized whole blood specimens (6). Unfortunately the traditional dual platform technology (DPT) is incompatible with stabilized blood preparations, yet during the 1980’s in most industrialized countries absolute CD4 T-cell counting was performed with traditional dual light-scatter based lymphocyte gating method with DPT. During the
stabilization process, the morphology of various subsets of leukocytes is altered. The DPT required a hematology instrument to read the total white cell count and the lymphocyte count in order to derive the CD4 T-cell absolute number from the flow cytometer. Most hematology instruments are unable to resolve lymphocytes accurately from manipulated stabilized specimens prepared for flow cytometric analysis. This is why most quality monitoring agencies in the past were evaluating CD4 and CD8 T-cells as lymphocyte percent, not as absolute counts/µL from whole blood (7). The switch to SPT provided a significant opportunity for global extension of quality assessment of CD4 T-cell enumeration. Currently 90% of QASI participant laboratories are using SPT technologies (Table 1). With stabilized whole blood preparations, the two major CD4 T-cell quality assessment providers UK NEQAS and QASI-QMS are able to reach most regional clinics equipped with affordable CD4 T-cell counting technology.
QASI-QMS has embarked on a unique path to accelerate improved management of CD4 T-cell counts globally. While the QASI-QMS had already considerable experience helping individual laboratories (8, 9), through its international EQAP, it also developed additional expertise in transferring skills and knowledge related to quality management of flow cytometry facilities in resource poor regions such as Africa, Asia, the Americas and Eastern Europe. Many of these workshops were organized with support from WHO, CDC or the Clinton Foundation. Building on such experiences over the years, QASI-QMS has initiated a program, parallel with the existing QASI EQAP, to pave the way to self managed nationally coordinated immunophenotyping services. There are three new
components integrated into the QASI-QMS strategy: (a) Support countries to introduce national EQAP including the establishment of country wide coordinating centers to accelerate the implementation of domestically managed CD4 T-cell EQAP. (b) Offer parallel options for QASI-QMS
sponsored EQAP’s to make the transition from the QASI-QMS’s EQAP to
nationally managed EQAP as transparent and rapid as possible. (c) Introduce a powerful statistical analysis package that can objectively monitor and measure changes over time in laboratory performance both at global and regional level. This report describes how such activities have contributed to improve the quality of CD4 T-cell counting with the QASI-QMS.
Materials and Methods Material
The strategy how to choose (stressed challenge) specimen and the distribution of selected commercial whole blood product has been already reported earlier and it has not changed (8). Shipping and delivery
methods used to reach individual laboratories have also been reported before (9). Two samples are provided to each site for testing; they include mid CD4 count level (~ 500 cells /µl) and low CD4 count level (~ 150 cells /µl). There is a different shipping protocol for QASI-QMS bulk
transportation designed for national redistribution. The bulk-shipment arrangement is to accommodate countries that have elected to
redistribute the QASI-QMS package within country. A one-year planner calendar describing the action plan and time frame for each survey cycle is shared with each national coordinating center. Notifications are sent-out by email to each coordinating centre prior to each survey cycle and the number of national participants is reconfirmed at that time. For each country an import permit is required to facilitate entry of the bulk shipment. The material is shipped in a styrofoam box including ice packs to avoid any significant deterioration of specimen quality during transportation. Samples are packaged in a sealed plastic bag with suitable absorbent material to absorb liquid in case of breakage. Adequate cushioning
material is used to protect the product. A set of instructions is provided. Larger bulk shipments are equipped with temperature monitoring devices. They are miniature temperature login devices that record the internal temperature of the container during transit.
Methods
Annual shipment frequency
The decision about the number of shipments per year has been reviewed carefully over the years. While many quality assessment programs in the industrialized world adhere to a six times a year schedule, this was rejected for the QASI-QMS. There are many reasons for such decision. The foremost justification for continuing with the three-shipment cycle per year is to maintain the integrity of the universal remedial action
component. The QASI-QMS has two options for remedial intervention delivery. It can provide assistance directly to a registered participant, or if the registration is through a national program, the assistance will be provided by the delegated expert from the local National External Quality Assessment Program Coordinating Center. In either case, intervention may be required at a site that is without access to the Internet, therefore effective assistance with a problem may take considerably more time. Ignoring poor performance at remote locations is not an acceptable QASI-QMS option. Based on a decade of experience, QASI-QASI-QMS reviewed
specimen scheduling at the end of 2006 and decided that commencing with year 2007, shipping frequency will be set at three times a year. The decision was made to stay with a relatively conservative time module to accommodate sufficient time for global remedial action. With this strategy, very few laboratories are without the benefit of having poor performance data reviewed before the next quality assessment cycle.
Direct access to Web data submission by participants
Most but not all QASI-QMS participants have access to the Internet. Therefore the majority of participants registers and maintains their
connection with the QASI-QMS via the QASI Website called: LymphoSite.
It is located at: www.qasi-lymphosite.ca. This is a language
multi-functional website. The data submission service function permits the selection of a preferred language. At the present time five languages are available for data input: French, English, Mandarin, Russian, and Portuguese. In regions where Internet is unavailable, email is the usual
mode of communication QASI@phac-aspc.gc.ca. That media is
available in both English and French. The on-line data submission collects information about specimen arrival date and date of analysis, specimen processing such as lysing method, monoclonal antibody combination, type of counting beads and instrumentation. To protect the confidentiality of all submission and analyzed results from each participant, a unique
user name and password is assigned to each laboratory. All data relevant to an assessment cycle must be submitted prior to the database closing date. Upon successful submission a confirmation number is issued.
Individual enrolment
During the past 12 years participation has increased dramatically. In 1997 participants were around 25, in 2009 it is above 430. For the first few years all laboratories were enrolled directly in the QASI EQAP. This situation started to change with the introduction of national ART programs to fight AIDS. As ART delivery is rapidly expanding in the Southern hemisphere, Ministries of Health are taking active interest in the national quality management of CD4 T-cell counting. It is anticipated that in the future the QASI-QMS will have fewer directly registered participants. From time to time there is a dramatic decrease in the overall direct participating laboratories. This situation occurred in 2005 and 2008 when national self-administered programs were launched in Brazil and South Africa
respectively (Fig. 1). Another reason for the occasional sudden reduction in total participants is frequent regional political instability. Unfortunately, many laboratories enrolled in QASI-QMS are from countries engaged in political upheavals including wars. Therefore from time to time some laboratories from various African countries were unable to participate in the QASI-QMS. Participation measured as the ratio of laboratories
submitting results over the laboratories who receive samples ranged from a low of 62% to as high as 94%. 10% of laboratories who fail to report results indicate problems related to instrument failure, lack of reagents or unavailability of experienced personnel to process samples. On the average the participation rate remained above 80%. In the past two years the average was at a respectable 85% (Fig. 2).
National group enrolment
Over the past decade there has been an increasing demand from nations to switch from individual participation in the QASI-QMS to a nationally organized and operated quality management option. The QASI-QMS was reorganized in such manner that public health laboratories from a
participating country can be enrolled in the QASI-QMS through a central national coordinating center. This type of progressive transfer started in 1997 and as of date there are 16 countries that have initiated the
operation of their own national external quality management program with or without long term support from the QASI-QMS (Table 2). This
arrangement is possible though the unique privileged access entry to the web based QASI-QMS database. Qualified national coordinators have access to manage their national database.
In order to transfer quality management responsibilities to resource limited countries, a process is put in place to select national coordinating center staff. A federal facility must be designated as the national reference laboratory. It must have the necessary equipment to validate the
performance of laboratories using alternative technologies for CD4 T-cell counting throughout the country. A letter of agreement from the Ministry of Health or equivalent authority is required, indicating that a reference laboratory has been identified to set up to coordinate the national CD4 quality assessment program. QASI-QMS team will help to select the most suitable candidates based on their scientific background, teaching
experience and communication skills. The expectations for the skill building workshops are defined based on candidate’s available expertise along with the technologies used in the peripheral laboratories. The workshop is then adjusted both in terms of depth and duration. A number of conference calls are arranged to work out the logistics of the workshop in Canada (visa, security clearance, vaccination, medical insurance, etc). The workshop trainees from Ottawa are prepared to cover all aspects of a
national implementation scheme for the EQAP. The QASI-QMS’s
Web-based platform for laboratory performance reports is made accessible. Based on the pre-evaluation needs, QASI-QMS provides laboratory scientists from the national coordinating center with training to efficiently and rapidly upscale their quality laboratory management and training
capacities. The workshop is organized to address knowledge, expertise gaps and specifically address needs related to the available CD4 T-cell counting technology used in that country. The workshop is usually in Canada at the QASI-QMS headquarters in Ottawa, where most of the equipment and expertise for quality management are all available. Under exeptional circumstances it is possible to organize the workshop at a national facility. On one occasion the national training workshop was delivered as a webcast. The QASI-QMS skill building workshop will provide certificates to those who successfully pass the examination at the end. The national coordinating center team members will return with all necessary quality training material and the ability to transfer their
enhanced expertise to peripheral laboratory staff. This secondary transfer can be performed through regional workshops conducted by the newly trained instructors, assisted by the QASI-QMS mentoring team. Subsequent in-country workshops can be organized as frequently as required. It is recommended to hold them at least once a year.
Access to data submission for participants without Internet connection
The QASI-QMS has now a number of national coordinating centers trained around the world with varying degrees of autonomy over the national EQAP management ( Table 2). The national coordinating centers
take care of individual laboratory recruitment. Pending on the availability of Internet connection, national coordinating centers may also deal directly with data submission forms for some or all of their clients. Each national coordinator has a unique user ID and password both to protect the integrity of the database and to protect the privacy of data that is not under specific national jurisdiction.
Statistical Analysis Basic data analysis
The method used to collect individual laboratory performance is evaluated by calculating two indices: (i) the Residual and (ii) the Standard Deviation Index (SDI). Details related how these calculations performed have been previously described (9). The residual is the difference between an individual laboratory’s reported value and the aggregate group mean
value. The SDI is the ratio of an individual laboratory’s residual over the
aggregate SD.
Advanced QASI-QMS quality assessment statistics
The objective is to collate and synchronize the “quality period” results and the “participation period” results. The “quality period” refers to a specific
QASI-QMS assessment cycle, where as the “participation period” denotes
laboratory. These two “periods” are not necessarily the same for a
participating laboratory as some may have joined the QASI-QMS at a later date. For example, if during a quality assessment period out of 100 laboratories there are 50 that have been participating consecutively in the program for ten times, thus each laboratory has already nine sequential periods of experience as participants with remedial action benefits. The other 50 laboratories are reporting results for the first time, therefore without any previous remedial response benefits. The overall aggregate inter-laboratory variation (error) is expected to be large, because of the novice laboratories represent 50% of all the data submitted. To get around the detrimental skewing effect of the aggregate data, it is possible
to use a normalization formula to synchronize participants’ error
contribution according to the number of times they have been participating,
hence their date-linked “quality period” results and the frequency-linked
“participation period” results can be synchronized. MQPj denotes the
mean cell count for “quality period” j. The absolute deviation from the
mean for laboratory i and for quality period j = |cell counti - MQPj| which is
denoted by ADM [i,j](t), where t refers to the “participation period”. For
each “participation period” t it is possible to express the mean of all the ADM (i,j)’s included as Mt and the standard deviation of all the ADM[i,j]’s
included as SDt .
t t
n
j](t)
ADM[i,
M
and 2 / 1 t 2 t t1
n
M
-j](t)
ADM[i,
SD
Where nt equals to the number of laboratories included in the
“participation period” t.
The analysis was performed with MAPLE. The regression curves were calculated and plotted using STATISTICA statistical package. No data point was rejected as outlier during the generation of these results. All data is from the original set that was used for all other standard statistical calculations for QASI-QMS.
Results
Because of the frequency of shipment per year varied from one to three
per year during the first decade of QASI’s existence, the time intervals for
“quality periods” in the QASI-QMS were inconsistent. However the minimum of four months gaps between shipments were always maintained. Therefore very few laboratories had performance related problem unresolved before the next testing cycle. This is important as not delivering corrective measures to a few failing laboratories can create a situation with accumulative error contribution damaging to the entire program. Commencing with 2007, the three shipments are space four
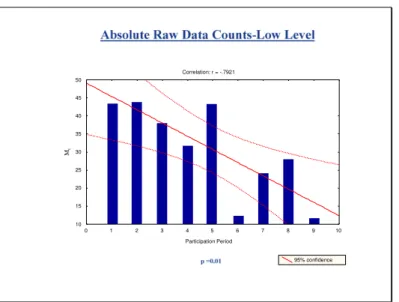
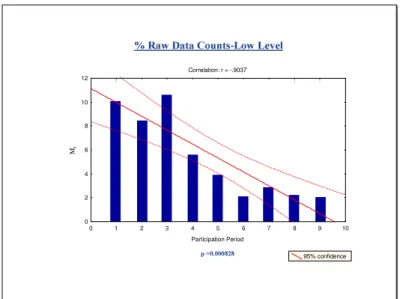
months apart. This means that “quality period” and “participation periods are always on the same time cycle. Therefore the inter-laboratory performance data calculations are readily comparable and valid (Fig.3 A, B and Fig. 3 C, D) for absolute and percentage of CD4 T-cell counts respectively). The numbers of nationally managed programs are on the increase with 437 laboratories. The number of laboratories that are direct participants decreased representing only 9% of total number of QASI-QMS participants (Table 2 and Fig. 1).
QASI-QMS’s overall Impact on the laboratories’ performance as
revealed by frequency of participation
There is a reduction in inter-laboratory variation (error) that is inversely proportional to the frequency of participation. For both the Mean and the
SD when synchronized according to “participation period” ranking, for
both absolute and percentage of CD4 T-cells, there is a continuous and significant decline in inter-laboratory variation with the QASI-QMS (Fig.3). The inter-laboratory error data during quality assessment period are tabulated (Table 3). The first time participation provides the baseline performance level for a given participant as it designates zero experience with EQAP. From that point on it is possible to track and compute a
change in measured parameters such as Mt and SDt respectively.
remained at ≤ 5% for subsequent participations periods for both Mid and Low CD4 level samples. Table 3 A and 3 B show the cumulative error reduction at participation period 4 and 7 currently corresponding to first and second year of enrollment in the QASI program.
Discussion
The objective was to see if improvements to the QASI-Quality
Management System can better support immunophenotyping laboratories with the dramatic increase in the global demand to treat individuals living with HIV. Adjustments were made to accommodate more effective intervention with ART at remote locations in resource poor regions. The three Improvements combined had a significant positive effect on accelerating the delivery of quality managed CD4 T-cell enumeration in
many parts of the world. The reduction of both Mt and SDt, two
independent measures of improvement are both supportive of the value of participation in the QASI program. With three consecutive participation
cycles, the delta Mt was reduced by 38% and 26% for mid and low level
absolute counts respectively (Table 3A and 3B). It is difficult to explain how the adjustments could provide such significant positive impact. It is clear that the frequency of participation indices over a one year stretch delivers a very significant improvement in performance. It is not clear which one element is the major contributor to achieve the desired effect.
Is it the enthusiastic attitude the young charismatic scientists had when they delivered the newly acquired skills and knowledge at home? Their spirited approach to the task and the way they shared new knowledge in local environment with other colleagues? This later activity had probably the most impact. One can speculate endlessly about what is the overall impact of skills and knowledge transfer. It seems that highly motivated leaders can bring appreciation of quality management concept even when the local conditions are desperate as long as there is measurable
evidence generated and disseminated. It is apparent that some of these charismatic health care workers created an appreciation of quality by establishing quality intelligence and awareness that remains attractive in challenging environments where participation is a novel and voluntary experience. This study provides evidence that overall error reduction can be achieved with the QASI-QMS. It is important to mention that most of the laboratories that are part of the QASI-QMS are not part of any certification programs. Yet, their voluntary efforts are extraordinary and the resulting accomplishments are impressive. In many instances the fundamentals for quality management are well established and many of these laboratories are prepared for the eventual national accreditation and certification to follow at a later date.
Literature Cited:
1. World Health Organization, Joint United Nation Programme on HIV/AIDS, AIDS Epidemic Update: December 2005. Available at:
http://libdoc.who.int/unaids/2005/929173439X_eng.pdf
2. Centers of Disease Control and Prevention, MMWR Morbidity and Mortality Weekly Report, 1992, pp1-19.
3. Mandy F, Janossy G, Bergeron M, Pilon R, Faucher S. Affordable CD4 T-Cell Enumeration for Resource-Limited Regions: A Status Report for 2008. CYTOMETRY PART B (Clinical cytometry) 74B, 2008 (suppl. 1):S27-S39.
4. From funding to action: strengthening healthcare systems in Sub-Saharan Africa. White paper for consultation. Geneva: World Economic Forum, Global Health Initiative, May 2006: 15-21.
5. Petti CA, Polage CR, Quinn TC, Roland AR, Sande MA. Laboratory medicine in Africa: a barrier to effective health care. Clin Infect Dis 2006;42:377-382.
6. Mandy F. Contribution of Flow Cytometry in the Fight Against HIV: in Cellular Diagnostics Basic Methods with Flow Cytometry. Karger Verlug, Freiburg, Germany, 2009 :511-515.
7. Bergeron M, Faucher S, Minkus T, Lacroix F, Ding T, Phaneuf S, Mandy F, Somorjai R, Summers R, and the Participating flow cytometry laboratories of the Canadian Clinical Trials Network for HIV/AIDS Therapies: The impact of unified procedures as implemented in the Canadian Quality Assurance Program for T-lymphocyte subset enumeration. Cytometry 1998;33 (2):146-155
8. Bergeron M, Shafaie A, Ding T, Phaneuf S, Soucy N, Mandy F, Bradley J, Fahey J. Evaluation of stabilized blood cell products as candidate preparations for quality assessment programs for CD4 T-cell counting. Clinical Cytometry 2002; 50(2):86-91
9. Mandy F, Bergeron M, Houle G, Bradley J, Fahey J. The impact of the international program for quality assessment and
standardization for immunological measures relevant to HIV/AIDS: QASI. Clinical Cytometry 2002; 50(2):111-116
Table 1
2009 STATUS REPORT: EQUIPMENT USED BY QASI PARTICIPANTS
Type of Flow Cytometers % of Laboratories
Epics-XL 3.4 FACSCalibur 18.2 FACSCan 1.0 FACSCount 59.1 GUAVA 5.4 CYFLOW 11.8
Table 2
QASI-QMS ASSISTED NATIONAL EXTERNAL QUALITY ASSESSMENT PROGRAMS FOR CD4 T-CELL ENUMERATION
NATIONAL EQAP WITH QASI-QMS HELP KNOWLEDGE TRANSFER BULK SHIPPING STARTED LABORATORIES INCLUDED IN NATIONAL EQAP LEVEL OF AUTONOMY WORKSHOP TRAINEES Brazil yes 5 1997 100 A Cambodia no - 2005 6 B
CAREC (21 nations) yes 3 2001 20 C
China yes 3 2005 16 C
Dem. Rep. of Congo no - 2006 7 B
Ethiopia yes(1) 3 2008 89 C
India no(2) - 2005 86 B
Indonesia no - 2008 24 B
Ivory Coast yes 6 2005 68 C
Morocco yes 2 2006 5 C Mozambique yes 2 2006 30 C Papua-New Guinea no - 2007 8 B South Africa no - 1999 120 A Tanzania yes 2 2005 103 C Ukraine yes 2 2009 17 D Vietnam no - 2007 34 B
Legend for level of autonomy
A: This national program is completely independent from the QASI-QMS B: Nation wide redistribution of QASI specimens, workshop is yet to follow C: Workshop is complete and there is redistribution of QASI specimens D: Workshop completed but has not started redistribution as of March 2009
(1)
This workshop was conducted via webcast
(2)
Table 3A
Incremental Inter-Laboratory Changes in Absolute CD4 T-cell Counts Adjusted to Synchronize Quality and Participation Periods to
Measure the Impact of Frequency of Participation
Participation Period
Mid Level CD4 QASI Specimens
Low level CD4 QASI Specimens Mt SDt Delta Mt Mt SDt Delta Mt % % 1 111 210 Baseline 43 83 Baseline 2 89 155 -20 44 87 +2 3 74 99 -33 38 69 -12 4 69 84 -38 32 59 -26 5 73 95 -34 43 87 +2 6 65 75 -41 12 9 -72 7 77 99 -31 24 36 -44 8 81 102 -23 28 16 -35 9 79 72 -29 12 10 -72 10 86 72 -23 11 33 22 -70 12 31 21 -72 13 47 37 -58 14 56 14 -50
Table 3B
Incremental Inter-Laboratory Changes in CD4 T-cell % Counts Adjusted to Synchronize Quality and Participation Periods to
Measure the impact of Frequency of Participation
Participation Period
Mid Level CD4 QASI Specimens
Low level CD4 QASI Specimens Mt SDt Delta Mt Mt SDt Delta Mt % % 1 8.7 10.3 Baseline 10.0 11.8 Baseline 2 6.9 7.9 -20 8.4 11.7 -16 3 7.7 9.8 -11 10.6 15.2 +6 4 7.4 11.9 -15 5.6 6.6 -44 5 4.1 5.8 -53 3.8 3.8 -62 6 5.0 8.4 -43 2.1 1.9 -79 7 4.0 8.1 -54 2.8 3.2 -72 8 2.4 3.3 -64 2.3 1.2 -77 9 2.0 1.5 -66 2.0 1.1 -80 10 3.0 3.2 -66 11 3.3 5.7 -62 12 1.8 1.5 -79 13 2.0 2.0 -77 14 1.2 0.7 -86 15 1.3 1.4 -85
Table 1
As of 2009, 90% of the participants report absolute CD4 T-cell counts with single platform technologies. Nearly 80% of clinical sites are using affordable CD4 T-cell counting technology.
Table 2
The QASI-QMS is dedicated to assist countries to develop the capacity for autonomous management of national external quality assessment
programs for CD4 T-cell enumeration. There are sixteen national or regional operations that are at various levels of autonomy. Brazil and South Africa are operating completely independent from the QASI-QMS, while the other 14 nations and regions still have various levels of
attachment to the QASI-QMS. CAREC is an umbrella organization that represents 21 small island nations in the Caribbean region.
Table 3A
The incremental inter-laboratory changes in absolute CD4 T-cell counts are captured from the statistical analysis for consecutive testing periods. They are adjusted to synchronize the quality periods with participation periods. This approach provides an effective way to measure the impact of frequency of participation including a baseline performance designated
as participation period 1. Highlighted periods correspond to a consecutive three-cycle period or currently one year.
Table 3B
The incremental inter-laboratory changes in CD4 T-cell percentage counts are captured from the statistical analysis for consecutive testing periods. They are adjusted to synchronize the quality periods with participation periods. This approach provides an effective way to measure the impact of frequency of participation including a baseline performance designated as participation period 1. Highlighted periods correspond to a consecutive three-cycle period or currently one year.
31
F ig. 1 0 50 100 150 200 250 300 350 400 450 500 06/97 08/97 10/98 04/99 03/00 09/01 04/02 09/03 05/04 05/05 11/05 04/06 10/06 02/07 07/07 11/07 03/08 07/08 10/08 02/09 No. of participantsQ
A
SI
P
A
R
T
IC
IP
A
T
IO
N
Q A S I S urv e y (MM /Y Y )
32
F ig. 2P
A
R
T
IC
IP
A
TIO
N
R
A
TE
Q A S I S urv e y (MM /Y Y ) 0 10 20 30 40 50 60 70 80 90 100 06/97 08/97 10/98 04/99 03/00 09/01 04/02 09/03 05/04 05/05 11/05 04/06 10/06 02/07 07/07 11/07 03/08 07/08 10/08 02/09
Fig. 3 A Correlation: r = -.7174 Participation Period 95% confidence 20 30 40 50 60 70 80 90 100 110 120 M t p =0.004 0 1 3 5 7 2 4 6 8 9 11 13 10 12 14 15 16
Fig. 3B
Correlation: r = -.7921 0 1 2 3 4 5 6 7 8 9 10 Participation Period 10 15 20 25 30 35 40 45 50 M t 95% confidenceFig. 3C
Correlation: r = -.9039 Participation Period 0 1 2 3 4 5 6 7 8 9 10 Mt 95% confidence 0 1 3 5 7 2 4 6 8 9 11 13 10 12 14 15 16Fig. 3D
Correlation: r = -.9037 0 1 2 3 4 5 6 7 8 9 10 Participation Period 0 2 4 6 8 10 12 M t 95% confidenceFig. 1
This bar fig. illustrates the number of participants in QASI-QMS surveys from 1997 to 2009.
Fig. 2
This bar fig. depicts the percentage of participants who first confirmed their desire and then actually participated in a given survey. This external quality assessment program is based on voluntary cooperation, the overall rate of participation averages to be 81%.
Fig. 3
Each of the four figures combines a scatter plot with linear regression and histogram depicting Mt against participation period. (Fig.3A) Absolute Mid level CD4 count (Fig. 3B) Absolute Low level CD4 count (Fig. 3C) % Mid
level CD4 (Fig. 3D) % Low level CD4. The correlation coefficients “r”
values along with the “p” values are indicated in the plots. The negative correlation coefficients values indicate that the regression lines slope
downward. The “p” values are a statistical measure of how the slope of
the regression line differs from the horizontal line. The small p values
<0.05 indicate a significant decrease for Mt over participation times. These
histograms illustrate the Mt values as it is statistically adjusted to
aggregate mean CD4 value from that survey period is used to determine the inter-laboratory variation. The statistical treatment is necessary to compensate for the fact that in any one survey period there are laboratories without any previous experience (no previous “quality
periods”) in immunophenotype reporting side-by-side with others who may have numerous “quality periods” experience.