HAL Id: hal-02915414
https://hal.inria.fr/hal-02915414
Submitted on 14 Aug 2020
HAL is a multi-disciplinary open access
archive for the deposit and dissemination of
sci-entific research documents, whether they are
pub-lished or not. The documents may come from
teaching and research institutions in France or
abroad, or from public or private research centers.
L’archive ouverte pluridisciplinaire HAL, est
destinée au dépôt et à la diffusion de documents
scientifiques de niveau recherche, publiés ou non,
émanant des établissements d’enseignement et de
recherche français ou étrangers, des laboratoires
publics ou privés.
A Knowledge Graph Enhanced Learner Model to
Predict Outcomes to Questions in the Medical Field
Antonia Ettorre, Oscar Rocha, Catherine Faron Zucker, Franck Michel,
Fabien Gandon
To cite this version:
Antonia Ettorre, Oscar Rocha, Catherine Faron Zucker, Franck Michel, Fabien Gandon. A Knowledge
Graph Enhanced Learner Model to Predict Outcomes to Questions in the Medical Field. EKAW 2020
- 22nd International Conference on Knowledge Engineering and Knowledge Management, Sep 2020,
Bolzano, Italy. �hal-02915414�
to Predict Outcomes to Questions in the
Medical Field
Antonia Ettorre1, Oscar Rodr´ıguez Rocha1,2[0000−0003−2764−1134], Catherine
Faron1[0000−0001−5959−5561], Franck Michel1[0000−0001−9064−0463], and Fabien
Gandon1[0000−0003−0543−1232]
1 University Cˆote d’Azur, CNRS, Inria, I3S, France 2
Teach on Mars, France
Abstract. The training curriculum for medical doctors requires the in-tensive and rapid assimilation of a lot of knowledge. To help medical students optimize their learning path, the SIDES 3.0 national French project aims to extend an existing platform with intelligent learning services. This platform contains a large number of annotated learning resources, from training and evaluation questions to students’ learning traces, available as an RDF knowledge graph. In order for the platform to provide personalized learning services, the knowledge and skills progres-sively acquired by students on each subject should be taken into account when choosing the training and evaluation questions to be presented to them, in the form of customized quizzes. To achieve such recommenda-tion, a first step lies in the ability to predict the outcome of students when answering questions (success or failure). With this objective in mind, in this paper we propose a model of the students’ learning on the SIDES platform, able to make such predictions. The model extends a state-of-the-art approach to fit the specificity of medical data, and to take into account additional knowledge extracted from the OntoSIDES knowledge graph in the form of graph embeddings. Through an evaluation based on learning traces for pediatrics and cardiovascular specialties, we show that considering the vector representations of answers, questions and students nodes substantially improves the prediction results compared to baseline models.
Keywords: Semantic Web · Graph Embedding · Prediction · Learner Model · Medical Field.
1
Introduction
Since 2013, teachers of French medical schools have been using a common na-tional platform to create and give local evaluation tests on different devices. The Web-based platform, named SIDES (Intelligent Health Education System3),
al-lows to share these tests among medical schools to form a national database
3
for training, and supports the preparation of medical students for the ECNi (National Computerized Ranking Tests).
The French national project SIDES 3.0 started at the end of 2017 and aims to develop a new version of the platform meant to offer user-centered intelligent services such as individual monitoring, enriched dashboards, personalized rec-ommendations, augmented corrections for self-assessment, and a standardized digital environment for knowledge sharing. To achieve these goals, the approach taken leverages semantic Web models and technologies to enrich and integrate these resources in RDF with OWL ontologies. As part of the SIDES 3.0 project, existing data from the platform, such as annotated questions and students’ learn-ing traces, were converted into structured data expressed in RDF uslearn-ing the On-toSIDES OWL ontology [13], and stored in the OnOn-toSIDES knowledge graph.
Recommending questions to the students (i.e. the learners) in an intelligent way is a key element to achieve personalized and efficient individual learning. This requires the ability to take into account their profile, learning objectives and current level of knowledge in order to guide them in progressively improving their knowledge about a medical specialty. An important criterion for this tailored recommendation is the prediction of the outcomes of students to questions, since such predictions should allow to more effectively detect and adjust students’ gaps.
Throughout the years, several research works have addressed this prediction relying on diverse machine learning techniques. Our goal is to propose a hybrid approach that combines Machine Learning and Knowledge Representation to take advantage of the most advanced learning architectures while exploiting the information provided by the knowledge graph. In this context, this paper addresses the following research questions:
– How to model students’ learning on the SIDES platform to predict their outcomes to medical questions?
– Which set of features should be extracted from the OntoSIDES knowledge graph and considered for learning the student model?
– Can taking into account the knowledge graph structure of OntoSIDES im-prove the performance of the prediction of students answers to questions? To answer these questions, in this paper we present (1) our model to pre-dict the outcome of students’ answers to questions, and (2) an evaluation of our model focused on the pediatrics and cardiovascular specialties. Our model was created on the basis of two state-of-the-art works on this domain: Knowledge Tracing Machines [20] and Deep Knowledge Tracing Machines (DeepFM) [7]. We adapted the learning models proposed in these works to the OntoSIDES knowledge graph, and extended them with calculated features and embeddings of graph nodes to exploit the knowledge captured in the OntoSIDES graph. Through experimentation and evaluation, we validated a new model that makes the most accurate predictions by considering these features in the DeepFM ma-chine learning algorithm.
The remainder of this paper is organized as follows: In section 2, we review existing related works. We describe the OntoSIDES knowledge graph in section
3. The features extracted or computed from the OntoSIDES knowledge graph to model students’ learning are detailed in section 4. In section 5, we present the experiments performed in order to define our model, and we analyse the results of these experiments in section 5.2. Finally, conclusions and future work are presented in section 6.
2
Related Work
Several models have been proposed in the literature to measure and predict students’ outcomes to questions. The Classical Test Theory (CTT) [12] is a foundational work developed in the context of psychological tests. It builds on the assumption that the measurement of a test cannot be completely error-free. Thus, student’s observed score on a test is the sum of a true score (a score obtained if there were no measurement errors) and an error score. Several shortcomings of the CTT were underlined in [8], yet the major limitation with respect to our goal is that CTT is test-oriented and therefore is not suitable for modeling answers to individual items of a test.
The Item Response Theory (IRT) [8] was proposed to overcome the short-comings of the CTT. IRT models the relationship between persons and test items in order to predict the response of any student to any item even if similar students have never answered similar items before. The probability of correctly responding to an item is a monotonically increasing function of the measured la-tent trait (ability) of the student and some parameters of the question item (e.g. difficulty). For dichotomous question items, there are 4 IRT models, from one (1PL) to four parameters (4PL) models. The 1PL model (also called the Rasch model as it was originally suggested by Rasch [16]) is the simplest IRT model. It describes the test items in terms of only one parameter: the item difficulty. The probability of responding correctly to an item given its difficulty and the ability level of the student is given by a logistic function. The 2PL model generalizes the 1PL model by adding the discrimination parameter. The 3PL model (which is not a logistic model unlike the previous two) generalizes the 2PL model by adding the (pseudo)guessing parameter which expresses the property that even very low ability persons have a positive probability of answering an item cor-rectly, simply by randomly guessing the correct answer. Finally, the 4PL model adds a fourth parameter that models the ”inattention” of high ability students failing to answer an easy item correctly.
Unlike IRT models, which are suitable for analyzing students’ responses to items that measure a single latent trait, mIRT [17] models allow to analyze richer question items that measure multiple latent traits simultaneously.
Additive Factors Model (AFM) [3] is a predictive learning model based on the Logistic Regression algorithm, that takes into account student skill parameters, skill parameters and learning rates. In [14], the authors propose the Performance Factors Analysis (PFA) model. This model is also based on the Logistic Regres-sion, however, unlike AFM, it takes into account the prior students’ failures and successes on each skill to make predictions.
Bayesian Knowledge Tracing (BKT) [4] is one of the most popular methods for modeling students’ knowledge. It models the student’s prior incorrect and correct responses to items of a particular skill in a Hidden Markov Model to estimate the probability that a student has mastered or not that skill. Its major limitation is that it cannot model the fact that question items may involve multiple skills.
Taking advantage of the advances of Deep Learning [10], in 2015, the Deep Knowledge Tracing (DKT) [15] model was proposed to overcome the limitations of BKT. This model is based on the use of Recurrent Neural Networks (RNNs) to model student’s learning and predict the outcomes to questions based upon stu-dents’ prior activity. More specifically, two different types of RNNs are applied: a vanilla RNN model with sigmoid units and a Long Short Term Memory (LSTM) mode. However, in 2016, authors of [22] have shown how IRT-based methods matched or even outperformed DKT. In particular, a hierarchical extension of IRT that captured item grouping structure performed the best. Additionally, a temporal extension of IRT improved performance over standard IRT while the RNN-based method did not.
More recently, Vie and Kashima proposed the Knowledge Tracing Machines (KTM) [21] approach based on factorization machines (FM) [18] to model and estimate students’ learning. KTM encompasses several existing models in the educational literature as special cases, such as AFM, PFA, and mIRT. In ad-dition, this approach provides a test bed to try new combinations of features in order to improve existing models. Finally, in [20], an approach similar to the previous one is presented, but based on Deep Factorization Machines (DeepFM) [7] as a classification algorithm. DeepFM combines the power of FM for rec-ommendation and Deep Learning for feature learning. The article compares the results obtained with DeepFM with the ones obtained using logistic regression and Vanilla FM, showing that it outperforms the other algorithms. This is why, for the research work presented in this paper, we have taken this framework as the basis for testing new features and combinations of features to improve predictions.
When compared to the above-mentioned research works, the novelty of our model is that it exploits the knowledge captured in the OntoSIDES knowledge graph by means of text and graph embeddings of nodes.
3
OntoSIDES
OntoSIDES [13] is a knowledge graph that comprises a domain ontology repre-sented in OWL and a set of factual statements about the entities on the SIDES platform, linking them to the ontology classes and properties. Being an RDF graph, it is possible to query OntoSIDES with the standard query language SPARQL. The OntoSIDES knowledge graph was automatically generated from the relational database of the SIDES platform, and by enriching these data with the developed ontology.
The current version of the OntoSIDES OWL ontology contains 52 classes and 50 properties, mainly describing universities, faculties, users (students, pro-fessors, and administrative staff), tests, questions and answers. Here are the top classes of interest for our work:
Action (sides:action): the root class of actions that students can perform when they interact with the pedagogical resources of the SIDES platform. For example, it is possible to characterize the action of selecting the proposal of an answer to a question with subclasssides:action to answer.
Content (sides:content): the root class of the hierarchy of resource types avail-able in the SIDES platform. The class of questions (sides:question), the class of proposed answers to a question (sides:proposal of answer) and the class of answers (sides:answer) of a student to a question, are subclasses of
sides:content.
Person (sides:person): class of persons involved in medical studies. Its
sub-classes correspond to the specific roles of SIDES users: for example, the classsides:studentis a subclass of sides:person.
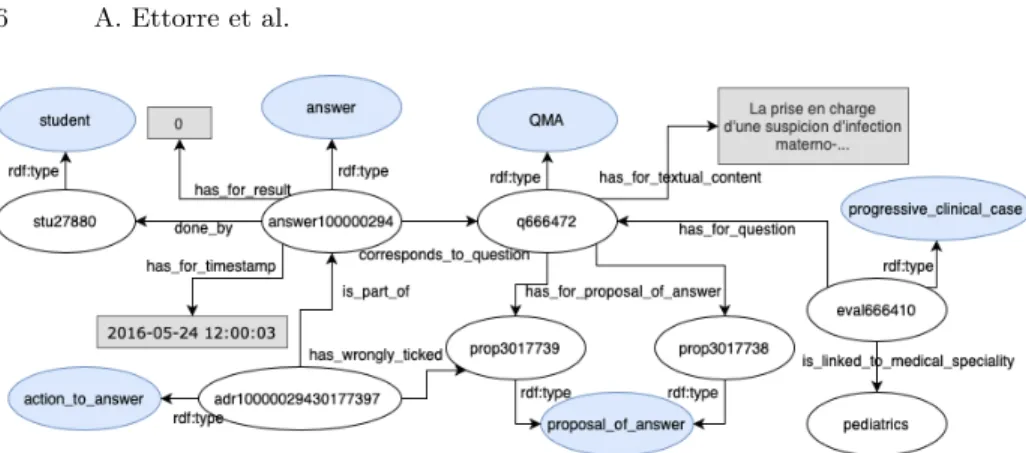
Figure 1 depicts the RDF graph representing an answer given by a student to a question with multiple possible answers. For each attempt of a student to a question, an instance of the class sides:answeris created. This answer is di-rectly linked to the student through propertysides:done byand to the question throughsides:correspond to question. An answer is linked to multiple instances of sides:action to answer, each one representing the action of selecting a
sin-gle sides:proposal of answer for the question. For example, question q666472
in Figure 1 is a multiple choice question (QMA) associated to two possible an-swers,prop3017738andprop3017739, and studentstu27880, while answering, has selected (sides:has wrongly ticked) the wrong option sides:prop3017739. The instances of sides:action to answer are used to compute the number of mi-sticked and non-ticked answers and then the level of correctness of the given answer, value of propertysides:has for result. Other useful nodes further de-scribe questions:sides:has for textual contentgives the text of a question, and
sides:is linked to the medical specialityrelates a question to the medical spe-cialties it belongs to. It is also worth pointing out that questions are normally organized in evaluationsthat group sets of questions related to similar topics or concerning the same clinical case.
The OntoSIDES graph currently includes the description of 569,762,878 answers to 1,797,180 questions related to 31 medical specialties and given by 173,533 students. In total the knowledge graph contains more than 9.2 billion triples.
4
Features Selected or Computed from OntoSIDES to
Learn a Student Model
Based on the OntoSIDES knowledge graph, our aim is to predict the outcome of a student to a question, that is, the value related to an instance of sides:answer
Fig. 1. RDF graph describing an answer of a student to a question. Blue bubbles are owl:Classes, white bubbles are instances and grey rectangles are literal values.
by property sides:has for result, which is equal to 1 if the student answered the question correctly, and 0 otherwise. Therefore this amounts to a binary classification.
In this section, we describe the candidate features that we selected or com-puted from the OntoSIDES knowledge graph to build a student model. We hypothesize that these features may improve the quality of the binary classifica-tion carried out by the algorithm to predict a student’s outcome to a quesclassifica-tion. In section 5.2, we draw some conclusions with respect to this hypothesis based on the results of our experiments.
4.1 Basic Features
A first set of basic (or raw) features concerns the entities that can be extracted by simply querying the OntoSIDES knowledge graph, without further processing. These features are as follows:
student: the identifier of a student who answers a question, specifically, the URI of an instance of classsides:studentrelated to an instance ofsides:answer
by propertysides:done by.
answer: the identifier of an answer given by a student, that is, the URI of an instance of the classsides:answer.
question: the identifier of a question answered by a student, that is, the URI of an instance of the classsides:question.
timestamp: the date and time when a student answered a question, that is, the value related to an instance ofsides:answerby propertysides:has for timestamp.
4.2 Calculated Features Conveying a Temporal Dimension
A set of additional features is computed from the above described raw features. They are meant to provide insight into students’ level of knowledge over time,
difficulty level of questions and number of prior attempts that a student carried out to answer a question. Together, they convey a temporal dimension to the model that is richer than the raw timestamp. These features are as follows: wins: given a question and a student, it represents the number of times that
this student has previously answered that question correctly.
fails: given a question and a student, it represents the number of times that this student has previously answered that question incorrectly.
attempts: wins + fails.
question difficulty: for a given question, it is an estimation of its difficulty and assumes values between 0 and 1, 1 being the highest difficulty. It is computed by dividing the number of incorrect answers by the number of answers given to that question.
static student ability: a static estimate of the student’s overall ability, valued between 0 and 1, 1 being the highest ability. It is computed as the student’s total number of correct answers divided by the student’s total number of answers.
progressive student ability: this feature follows the evolution of the stu-dent’s ability over time. It draws her learning curve. For each attempt, it is computed as the ratio between the number of correct answers and the number of all the answers given by the student up to that moment. At the beginning of the training, the student’s ratio of correct answers is likely to be low to medium. Then, in time, this ratio increases, reflecting the growth of her level of knowledge and expertise.
4.3 Text Embeddings of Questions
We hypothesize that questions’ text may provide valuable information to predict the answer of a student to a question. To test this hypothesis, we queried the OntoSIDES knowledge graph to extract the text of the questions, i.e. the value of the property sides:has for textual content, and we computed their vector representation by using the state-of-the-art word embedding algorithm fastText [2]. We used the flair framework [1] implementation which provides embeddings pre-trained with the French Wikipedia. Applying this approach to the text of each question yields vectors of 300 dimensions. Later on, we refer to this set of vectors as questions temb.
4.4 Knowledge Graph Embeddings of Questions, Answers, and Users
Lastly, we hypothesize that the OntoSIDES graph topology may convey valu-able knowledge to predict the answer of a student to a question. To test this hypothesis, we used the state-of-the-art node2vec algorithm [6] to construct vec-tor representations of the knowledge graph nodes. node2vec learns continuous feature representations for the nodes in a graph by mapping each node to a low-dimensional space of features that maximizes the likelihood of preserving
network neighborhoods of nodes. To do this, we used the SNAP project imple-mentation [11]4 of node2vec to extract vector representations of dimension 100
for each of the nodes in our training dataset (described in Section 5). In the following, we refer to these vectors as answers gemb, questions gemb and students gemb respectively.
5
Empirical Determination of a Learner Model
This section describes a comparative evaluation of several student models, that we carried out to determine which of them produces the best prediction of the students’ answers to questions. Each model relies on a specific set of features selected among those described in section 4.
5.1 Experimental Settings
Training Data. We trained the different models on a sub-graph of the SIDES knowledge graph containing the answers given by the sixth-year medical students during the 2018-2019 academic year. The sixth year corresponds to the last year of the second cycle of medical studies. Thus, predicting the outcomes of these students is a particularly relevant task because their activities are the most reliable indicator of their performance during the National Computerized Ranking Tests (ECNi).
The extracted sub-graph contains 96,511,040 answers to 831,057 different questions, given by 8,776 students. Given the large size of this sub-graph, to be able to train the models within reasonable time we decided to limit our experiments to the answers to questions related to pediatrics and cardiovascular, the two specialties with the largest number of answers. For each specialty, we randomly extracted 100,000 answers, obtaining the following sub-graphs:
– pediatrics: 100,000 answers to 22,551 questions, given by 8,535 students; – cardiovascular: 100,000 answers to 22,505 questions, given by 8,655 students.
Candidate Models. Relying on the benchmarking approach presented in [20], we defined 15 different models by combining the features described in section 4, in order to comparatively evaluate them and determine which one allows the classification algorithms to obtain the best prediction scores.
Each model is identified by a label whose letters each denotes a feature: s: students identifiers; q: questions identifiers; a: number of attempts; w: num-ber of wins; f : numnum-ber of fails; d: question difficulty; b: static student ability; b’: progressive student ability; T: questions temb; Q: questions gemb; S: stu-dents gemb; R: answers gemb. With this notation, the candidate models are as follows.
The first three models correspond to state-of-the-art models and will serve as a baseline for richer models:
4
sq is equivalent to the 1PL IRT model when used with the Logistic Regres-sion algorithm. Used with the FM algorithm configured with a “number of factors used for pairwise interactions” greater than 0 (d>20 ), this model is equivalent to the mIRT model [20].
sqa is inspired by the AFM model as it takes into account the number of pre-vious attempts but not the skills which is not among our features.
sqawf is inspired by the AFM and PFA models as it takes into account the num-ber of previous attempts and the distinction between correct and incorrect attempts.
Additionally, we consider the following models that test other possible fea-tures combinations, notably involving text and graph embeddings: sqawfd,
sqawfb, sqawfb’, sqawfdbb’, sqawfdbb’T, sqawfdbb’R, sqawfdbb’Q, sqawfdbb’S, sqawfdbb’RQ, sqawfdbb’TRQ, sqawfdbb’RQS and sqawfdbb’TRQS.
Classification Algorithm. As a result of our survey of related works (Section 2), we chose to rely on the DeepFM classification algorithm for our experiments. We used the DeepCTR5 Python implementation. The results reported in this
paper were obtained with 256 layers of 256 units each, parameter initialize std of embedding vector was set to 0.001, and an L2 regularizer strength applied to embedding vector was set to 1e-06.
Hardware Setup. We used a Dell T640 GPU node equipped with 4 GTX 1080 Ti GPU cards, 2 Xeon Silver 4110 CPUs, 96 GB of RAM and 4 RAID-0 SSDs of 600 GB.
Temporality-Aware Cross-Validation. The performance of each model was evaluated by means of the student-based 5-fold cross-validation technique, in order to take into account the temporal dimension of the knowledge in the graph. Specifically, the list of students included in our dataset is split into five folds; four of them are directly used as training data while the remaining one is split again in two parts following the chronological order of answers: the first half is included into the training data while the last half is used as test set. The rationale behind this splitting method is as follows: for each fold, we train the model using the complete learning path of four fifths of the students, thus learning the entire trend of the students’ knowledge acquisition, and learning information about all the questions. Then, using as training data the partial learning traces of the remaining students ensures that the training involves all the students. But by testing on their latest answers, we approach the real use case, in which we want to forecast future answers based on the training history of the student.
5
Evaluation Metrics. We evaluate the average of the results obtained on each fold in terms of Accuracy (ACC) which measures the percentage of correct pre-dictions out of the total number of prepre-dictions, Area Under the ROC Curve (AUC) which measures the probability of correctness of each answer, F1-score and execution time.
5.2 Results and Discussion
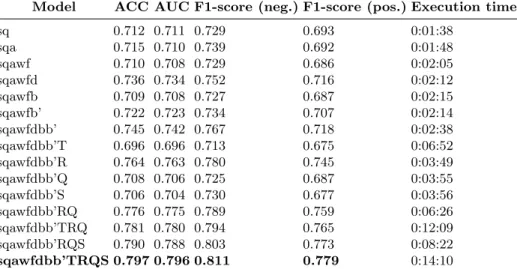
Table 1 shows the results of the evaluation of each model on the pediatrics sub-graph, using the DeepFM algorithm. Columns “F1-score (pos.)” and “F1-score (neg.)” report the F1-score for the prediction of positive answers and negative answers respectively. The best results were obtained with the sqawfdbb’TRQS model (students, questions, attempts, wins, fails, question difficulty, student abil-ities (static and progressive), questions temb, answers gemb, questions gemb, students gemb), that is all of the features presented in section 4 (AUC=0.797, ACC=0.796).
Model ACC AUC F1-score (neg.) F1-score (pos.) Execution time
sq 0.712 0.711 0.729 0.693 0:01:38 sqa 0.715 0.710 0.739 0.692 0:01:48 sqawf 0.710 0.708 0.729 0.686 0:02:05 sqawfd 0.736 0.734 0.752 0.716 0:02:12 sqawfb 0.709 0.708 0.727 0.687 0:02:15 sqawfb’ 0.722 0.723 0.734 0.707 0:02:14 sqawfdbb’ 0.745 0.742 0.767 0.718 0:02:38 sqawfdbb’T 0.696 0.696 0.713 0.675 0:06:52 sqawfdbb’R 0.764 0.763 0.780 0.745 0:03:49 sqawfdbb’Q 0.708 0.706 0.725 0.687 0:03:55 sqawfdbb’S 0.706 0.704 0.730 0.677 0:03:56 sqawfdbb’RQ 0.776 0.775 0.789 0.759 0:06:26 sqawfdbb’TRQ 0.781 0.780 0.794 0.765 0:12:09 sqawfdbb’RQS 0.790 0.788 0.803 0.773 0:08:22 sqawfdbb’TRQS 0.797 0.796 0.811 0.779 0:14:10
Table 1. Results for the pediatrics sub-graph. Models with the highest AUC are in bold.
Beyond this overall result, comparing the scores obtained with each of the models can help us point out the contribution (positive, neutral or negative) of some of the features to the predictions:
question difficulty, student abilities: When comparing the results obtained with models sqawf and sqawfdbb’, we notice that adding the features ques-tion difficulty, static student ability and progressive student ability, increases both the ACC and AUC by approximately 3%. In particular, by comparing
the models sqawfd, sqawfb and sqawfb’ we see that the largest improvement (2.6%) in terms of AUC and ACC is due to introduction of the feature question difficulty, whereas static student ability has almost no effect on the quality of the prediction.
questions temb: By comparing models sqawfdbb’ and sqawfdbb’T, we notice that the results are significantly worse when including feature questions temb: ACC and AUC both decrease by about 5%. This result is somehow counter-intuitive and may be related to the specificity and variety of medical vocab-ulary. To investigate further, additional experiments shall test the impact on word embeddings of techniques such as negative sampling, sub-sampling of common words or pre-processing to rewrite common medical expressions into single tokens.
Let us also underline that including this feature substantially increases the execution time of the classification algorithm.
questions gemb: When comparing the results obtained with models sqawfdbb’ and sqawfdbb’Q, we observe that this feature has a negative impact on the prediction results in terms of ACC, AUC and F1-score. Again, this negative impact can seem counter-intuitive, in particular when considering that the embeddings of the answers have a significant positive impact (as described afterwards).
students gemb: Similarly, feature students gemb seems to worsen the quality of the prediction. The values of ACC, AUC and F1-score are very close to those obtained when using questions gemb, presenting a decrease of 4% w.r.t. the same model without graph embeddings (sqawfdbb’ ).
answers gemb: Comparing the results obtained with models sqawfdbb’ and sqawfdbb’R shows that this feature yields an improvement of 2% in terms of AUC and ACC. Also, a higher F1-score of 0.780 and 0.745 was obtained for the negative and positive responses respectively. Execution time remained low at 3 minutes approximately.
Although the contribution of the single features may seem negligible when they are considered separately, and, in some cases, even negative, the best per-formance in terms of ACC, AUC and F1-score is obtained when all the features are included in the model. Indeed, the best model sqawfdbb’TRQS presents an ACC and AUC around 80%, with a substantial increment (about 9%) when compared with the basic model (sq). It is also worth pointing out that even partial combinations of these newly added features bring significant improve-ments with respect to the models in which the single features are used alone. For example, even though students gemb and questions gemb do not improve the quality of the prediction when used separately, they yield a 3.5% increase of ACC and AUC when used in conjunction with answers gemb, as can be seen by comparing sqawfdbb’R and sqawfdbb’RQS. This could be explained by the fact that our model captures high-degree interactions between some features, interactions that, in some cases, turn out to be much more meaningful than the single features themselves.
Comparing the results of sqawfdbb’RQS and sqawfdbb’TRQS suggests that the improvement which questions temb is accountable for is ancillary, while it
entails a significant execution time increase (14 minutes for sqawfdbb’TRQS vs. 8 minutes for sqawfdbb’RQS ). At a first sight, this may appear as a hindrance considering that we are only using a small fraction of the original data at our disposal. Nevertheless, we observe that, even with this small dataset, the quality of the prediction is fairly good. This suggests that, in the production environment of the SIDES platform, there shall be no need for training the algorithm on a much larger dataset in order to achieve good performance in the prediction task. We shall investigate further to determine a reasonable trade-off between the size of the dataset subset, the learning time and the quality of the prediction.
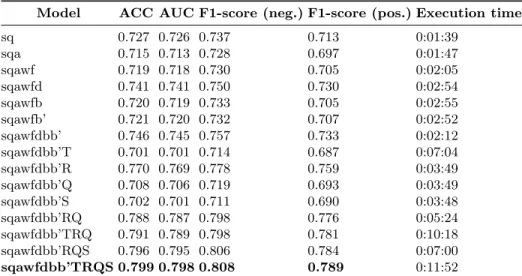
In order to validate our model and assess its flexibility with respect to the considered medical specialty, we trained and tested the DeepFM learning al-gorithm on the sub-graph related to the cardiovascular answers, extracted as described in Section 5.1.
Model ACC AUC F1-score (neg.) F1-score (pos.) Execution time
sq 0.727 0.726 0.737 0.713 0:01:39 sqa 0.715 0.713 0.728 0.697 0:01:47 sqawf 0.719 0.718 0.730 0.705 0:02:05 sqawfd 0.741 0.741 0.750 0.730 0:02:54 sqawfb 0.720 0.719 0.733 0.705 0:02:55 sqawfb’ 0.721 0.720 0.732 0.707 0:02:52 sqawfdbb’ 0.746 0.745 0.757 0.733 0:02:12 sqawfdbb’T 0.701 0.701 0.714 0.687 0:07:04 sqawfdbb’R 0.770 0.769 0.778 0.759 0:03:49 sqawfdbb’Q 0.708 0.706 0.719 0.693 0:03:49 sqawfdbb’S 0.702 0.701 0.711 0.690 0:03:48 sqawfdbb’RQ 0.788 0.787 0.798 0.776 0:05:24 sqawfdbb’TRQ 0.791 0.789 0.798 0.781 0:10:18 sqawfdbb’RQS 0.796 0.795 0.806 0.784 0:07:00 sqawfdbb’TRQS 0.799 0.798 0.808 0.789 0:11:52
Table 2. Results for the cardiovascular sub-graph. Models with the highest AUC are in bold.
As it can be seen in Table 2, the results for this new specialty are consistent and confirm what we observed earlier for the pediatrics sub-graph. As for the previous experiments, the best model appears to be sqawfdbb’TRQS, including all the possible features, i.e. basic and computed features and both text and graph embeddings. It produces the highest values of ACC (0.799), AUC (0.798) and F1-score (0.808 and 0.789 for positive and negative classes respectively). The new results confirm the modest impact of the questions temb feature, as can be seen by comparing the models sqawfdbb’TRQS and sqawfdbb’RQS. They also confirm the importance of the interactions between answers, questions and students graph embeddings. Indeed, in line with the previous case, we observe that, when used alone, features questions gemb and students gemb have a
nega-tive impact on the accuracy and AUC of the model, while when used together with answers gemb, the quality of the prediction is improved.
To sum up, our experiments show that the best student model combines a set of basic features obtained by directly querying the OntoSIDES knowledge graph – questions, attempts, wins, fails –, a set of additional features computed based on the basic ones – question difficulty, student ability (static and progressive) –, and the vector representations of the answers, questions and students nodes in the OntoSIDES knowledge graph, as well as the vector representation of questions’ text despite a modest impact.
6
Conclusions and Future Work
In this article, we have presented, evaluated and compared several models to predict the outcome of medical students’ answers to questions in pediatrics and cardiovascular specialties, on the SIDES platform, with the final goal of answer-ing the three research questions presented in section 1. We have identified as the best model for our task the one based on Deep Knowledge Tracing Machines and relying on a rich set of features including state-of-the-art features such as wins, fails, questions’ difficulties and students’ abilities; textual information processed through NLP techniques (questions’ text embeddings) and the structural knowl-edge provided by the OntoSIDES knowlknowl-edge graph. In particular, we have shown that considering the vector representations of answers, questions and students nodes had a positive impact on the prediction results: when these three features are used in conjunction, the accuracy and AUC measures of the predictions made by the DeepFM algorithm improved significantly.
As future work, we intend to consider several leads of improvement. First, we plan to evaluate our approach with other state-of-the-art graph representation algorithms, such as Complex [19], ConvE [5] and LiteralE [9]. Second, we wish to further exploit the knowledge contained into the graph by taking into account not only the assertional knowledge but also the ontology. Furthermore, we wish to investigate the reason why some features, such as the graph embeddings of question nodes, have a limited impact when used alone, while the impact is more important when they are used jointly with embeddings of other nodes. We also plan to extend our evaluation to questions and answers from other medical specialties present in the OntoSIDES graph.
In the mid-term, we plan to identify other existing knowledge graphs con-taining medical training data to apply, evaluate and improve our approach. With respect to the SIDES 3.0 project, our final goal, beyond predicting answers, is to use the resulting trained model to design an algorithm that, by considering additional criteria, will be able to recommend to medical students a customized learning path that automatically adapts to their learning objectives and their current progress.
Acknowledgement. This work is supported by the ANR DUNE project SIDES 3.0 (ANR-16-DUNE-0002-02).
References
1. Akbik, A., Blythe, D., Vollgraf, R.: Contextual String Embeddings for Sequence Labeling. In: Proceedings of the 27th International Conference on Computational Linguistics (COLING 2018). pp. 1638–1649 (2018)
2. Bojanowski, P., Grave, E., Joulin, A., Mikolov, T.: Enriching Word Vectors with Subword Information. Transactions of the Association for Computational Linguis-tics 5, 135–146 (Dec 2017)
3. Cen, H., Koedinger, K., Junker, B.: Learning Factors Analysis – A General Method for Cognitive Model Evaluation and Improvement. In: Intelligent Tutoring Systems. pp. 164–175. Springer, Berlin, Heidelberg (2006)
4. Corbett, A.T., Anderson, J.R.: Knowledge tracing: Modeling the acquisition of procedural knowledge. User Modeling and User-Adapted Interaction 4(4), 253– 278 (Dec 1994). https://doi.org/10.1007/BF01099821
5. Dettmers, T., Minervini, P., Stenetorp, P., Riedel, S.: Convolutional 2D Knowledge Graph Embeddings. In: Proceedings of the 32nd AAAI Conference on Artificial Intelligence (AAAI-18) (2018)
6. Grover, A., Leskovec, J.: node2vec: Scalable Feature Learning for Networks. CoRR (2016), http://arxiv.org/abs/1607.00653
7. Guo, H., Tang, R., Ye, Y., Li, Z., He, X.: DeepFM: A Factorization-Machine based Neural Network for CTR Prediction. In: Proceedings of the 26th International Joint Conference on Artificial Intelligence. pp. 1725–1731. Melbourne, Australia (Aug 2017). https://doi.org/10.24963/ijcai.2017/239
8. Hambleton, R., Swaminathan, H., Rogers, H.: Fundamentals of Item Response Theory. Measurement Methods for the Social Science, SAGE Publications (1991) 9. Kristiadi, A., Khan, M.A., Lukovnikov, D., Lehmann, J.: Incorporating literals into
knowledge graph embeddings. In: The Semantic Web – ISWC 2019. pp. 347–363. Springer International Publishing, Cham (2019)
10. LeCun, Y., Bengio, Y., Hinton, G.E.: Deep learning. Nature 521(7553), 436–444 (2015). https://doi.org/10.1038/nature14539
11. Leskovec, J., Sosiˇc, R.: SNAP: A General-Purpose Network Analysis and Graph-Mining Library. ACM Transactions on Intelligent Systems and Technology (TIST) 8(1), 1 (2016)
12. Novick, M.R.: The axioms and principal results of classical test theory. Journal of Mathematical Psychology 3(1), 1 – 18 (1966). https://doi.org/10.1016/0022-2496(66)90002-2
13. Palombi, O., Jouanot, F., Nziengam, N., Omidvar-Tehrani, B., Rousset, M.C., Sanchez, A.: OntoSIDES: Ontology-based student progress monitoring on the national evaluation system of French Medical Schools. Artificial Intelligence in Medicine 96, 59–67 (2019)
14. Pavlik, P.I., Cen, H., Koedinger, K.R.: Performance Factors Analysis –A New Al-ternative to Knowledge Tracing. In: Proceedings of the 2009 Conference on Artifi-cial Intelligence in Education: Building Learning Systems That Care: From Knowl-edge Representation to Affective Modelling. pp. 531–538. IOS Press, Amsterdam, The Netherlands (2009)
15. Piech, C., Bassen, J., Huang, J., Ganguli, S., Sahami, M., Guibas, L.J., Sohl-Dickstein, J.: Deep Knowledge Tracing. In: Cortes, C., Lawrence, N.D., Lee, D.D., Sugiyama, M., Garnett, R. (eds.) Advances in Neural Information Processing Sys-tems 28, pp. 505–513. Curran Associates, Inc. (2015)
16. Rasch, G.: Probabilistic Models for Some Intelligence and Attainment Tests. Stud-ies in mathematical psychology, Danmarks Paedagogiske Institut (1960)
17. Reckase, M.D.: The Past and Future of Multidimensional Item Re-sponse Theory. Applied Psychological Measurement 21(1), 25–36 (1997). https://doi.org/10.1177/0146621697211002
18. Rendle, S.: Factorization Machines. In: Proceedings of the 2010 IEEE International Conference on Data Mining. pp. 995–1000. ICDM ’10, IEEE Computer Society, Washington, DC, USA (2010). https://doi.org/10.1109/ICDM.2010.127
19. Trouillon, T., Dance, C.R., Welbl, J., Riedel, S., Gaussier, ´E., Bouchard, G.: Knowl-edge Graph Completion via Complex Tensor Factorization. The Journal of Machine Learning Research abs/1702.06879 (2017)
20. Vie, J.J.: Deep Factorization Machines for Knowledge Tracing. In: Proceedings of the 13th Workshop on Innovative Use of NLP for Building Educational Applica-tions. New Orleans, Louisiana (USA) (2018)
21. Vie, J.J., Kashima, H.: Knowledge Tracing Machines: Factorization Machines for Knowledge Tracing. In: Proceedings of the 33th AAAI Conference on Artificial Intelligence (AAAI-19). Honolulu, Hawai (USA) (2019)
22. Wilson, K.H., Karklin, Y., Han, B., Ekanadham, C.: Back to the Basics: Bayesian extensions of IRT outperform neural networks for proficiency estimation. In: Pro-ceedings of the 9th International Conference on Educational Data Mining (EDM 2016). Association for Computational Linguistics, Raleigh, NC, USA (2016)