HAL Id: hal-00608427
https://hal.archives-ouvertes.fr/hal-00608427
Submitted on 13 Jul 2011HAL is a multi-disciplinary open access archive for the deposit and dissemination of sci-entific research documents, whether they are pub-lished or not. The documents may come from teaching and research institutions in France or abroad, or from public or private research centers.
L’archive ouverte pluridisciplinaire HAL, est destinée au dépôt et à la diffusion de documents scientifiques de niveau recherche, publiés ou non, émanant des établissements d’enseignement et de recherche français ou étrangers, des laboratoires publics ou privés.
Electric and spectroscopic analysis of a pure nitrogen
mono-filamentary dielectric barrier discharge
(MF-DBD) at 760Torr
Neermalsing Sewraj, Nofel Merbahi, J P Gardou, P Rodriguez Akerreta, F
Marchal
To cite this version:
Neermalsing Sewraj, Nofel Merbahi, J P Gardou, P Rodriguez Akerreta, F Marchal. Electric and spectroscopic analysis of a pure nitrogen mono-filamentary dielectric barrier discharge (MF-DBD) at 760Torr. Journal of Physics D: Applied Physics, IOP Publishing, 2011, 44 (14), pp.145201. �10.1088/0022-3727/44/14/145201�. �hal-00608427�
ELECTRIC AND SPECTROSCOPIC ANALYSIS OF A PURE
NITROGEN MONO-FILAMENTARY DIELECTRIC BARRIER
DISCHARGE (MF-DBD) AT 760 TORR
N. Sewraj*, N. Merbahi, J. P. Gardou, P. Rodriguez Akerreta and F. MarchalUniversité de Toulouse, Laplace UMR CNRS 5213, UPS, 118 Route de Narbonne, 31062 Toulouse FR.
* Email: neermalsing.sewraj@laplace.univ-tlse.fr
Abstract
As far as we know, VUV emissions of nitrogen MF-DBDs have never been reported before.
Mono-filamentary dielectric barrier discharge (MF-DBD), occurring within 1-mm gap of atmospheric pressure pure nitrogen and operating with a sinusoidal electric supply at about 8 kHz, is studied in this paper. A thorough electrical analysis allows experimental determination of the ignition and extinction voltages, respectively (15750 ± 50) V and (2097 ± 7) V, the injected energy (158 ± 2) J and charge (17.22 ± 0.22) nC in a single filament. The mean axial reduced electric field is equal to (644 ± 2) Td at ignition. An empirical technique is proposed to evaluate these discharge parameters by avoiding bulky calculations. Optical emission spectroscopic measurements of the vacuum ultraviolet (VUV), ultraviolet (UV), visible and near infrared (IR) emissions are presented and discussed. Two atomic nitrogen lines attributed to the decay of the N[2s2p23s 2P] triplet towards N[2s22p32D°] level are observed at 150 and 175 nm, together with the Lyman-Birge-Hopfield system (N2[a 1Πg]→ N2[X 1Σ+g]) in the VUV range. The Second Positive system (N2[C 3Πu]→ N2[B 3Πg]) dominates the UV and visible-blue spectra. The (0-0) transition of the First Negative system (N2+[B 2 Σ+u]→ N2+[X 2Σ+g]) peaking at 391.4 nm, the First Positive system (N2[B 3Πg]→ N2[A 3Σ+u]) and theHerman infrared transitions (N2[C" 5Πu]→ N2[A' 5Σ+g]) also present. Both our VUV and near IR spectra are consistent with recently reported results in hollow cathode and cylindrical DBDs. The electrical and spectroscopic experimental results reported here are useful for ongoing and forthcoming modelling of filamentary nitrogen dielectric barrier discharges.
Key-words: Dielectric barrier discharge, Filamentary discharge, Nitrogen, Electrical analysis, Optical emission spectroscopy, Vacuum ultraviolet and ultraviolet radiations, Visible light and near Infrared emissions.
1. INTRODUCTION
Cold non-equilibrium atmospheric plasmas achieved with Dielectric Barrier Discharges (DBDs) are of great interest for production of energetic photons (hν > 10 eV), radicals or ion sources for industrial use. Some of these applications concern photo-chemical treatment of water [Azrague K et al 2005, Gonzalez et al 2004], volatile organic compound (VOC) remediation [Biomorgi J et al 2005, Koutsospyros A et al 2004], biochemical decontamination and remediation of toxic gases [Herrman H W et al 1999], realisation of non-coherent vacuum ultraviolet (VUV: 100 nm < λ < 200 nm) or ultraviolet (UV: 200 nm < λ < 400 nm) sources [Kurunczi P et al 1999, Masoud N et al 2004], material deposition [Babayan S E et al 1998], H2 generation for fuel cells and diesel
reforming [Qiu H et al 2004, Becker K H et al 2004], exhaust treatment [Dietz et al 2004] …
As far as non-coherent radiation DBD sources are concerned, VUV sources are of topical interest for a variety of industrial purposes such as plasma processing [Kogelschatz U et al 1999], surface cleaning [Korfatis G et al 2002] and modification [Wagner H-E et al 2003, Borcia G et al 2003], sterilization, decontamination and medical care. Recently some emerging scientific investigations were performed in neon [Carman R J et al 2010]. Rare gas DBDs can be used for excilamps [Zhang J-Y and Boyd I W 2000, Boichenko A M et al 2004], mercury-free lamps [Jinno et al 2005], for oxidation of silicon at 250 °C [Kogelschatz U et al 2000]. Operating in xenon or neon, they produce VUV or EUV (10 nm < λ < 100 nm) emissions with an efficiency as high as 50 to 60% [Vollkommer F and Hitzschke L 1996, Hitzschke L and Vollkommer F 2001, Mildren R P and Carman R J 2001, Carman R J and Mildren R P 2003, Carman R J et al 2004, Merbahi N et al 2007, Carman R J et al 2010]. In order to understand their behaviour, stable MF-DBDs were must be achievedat frequencies around tens of kilohertz [Adler F and Muller S 2000, Sewraj N et al 2009, Merbahi N et al 2004, Merbahi N et al 2010]. In such circumstances, for each half-period all the observed emissions can be unambiguously attributed to a single filament whose time-origin is well defined by the fast rising supply current.
During the last three decades a growing attention has been paid to atmospheric DBDs containing nitrogen because of their potentiality for a wide variety of applications [Kogelschatz U et al 1999]. Polymer surfaces are often smooth and it is rather difficult to wet them, or to paint or print on them or to deposit adherent metal coatings. Such surfaces can be activated by a DBD treatment in open air. An increasing number of investigations are devoted to the decomposition of nitrogen and sulphur oxides in flue gases, and of VOCs emanating from various large-scale industrial plants, for which dc corona discharges technique is used. However, for applications where high specific powers or low gas temperature are required, DBDs constitute a good alternative to corona discharges.
Atmospheric DBDs are usually diffuse (homogeneous) or multi-filamentary [Okazaki S et al 1993]. Homogenous nitrogen based DBDs are often devoted to surface treatment [Wagner H-E et al 2003]. Nevertheless, random filaments which may occur at ignition or, to a lesser extent, during the steady state are detrimental to the quality of the treatment. For both type of DBDs, a good knowledge of the electrical, spectroscopic and kinetic behaviour of mono-filamentary discharge is required in order to optimize specific applications. In order to study filamentary nitrogen DBDs a few authors have achieved laboratory multi-filamentary [Lukas C et al 2001] or mono-filamentary DBDs in mixtures [Kozlov K V et al 2005] containing nitrogen. In contrast to rare gas DBDs, those occurring in nitrogen yield a variety of emissions over an extended spectral range from VUV to infrared.
The intent of this paper is to perform a simultaneous experimental analysis of both the electrical and spectroscopic performance of a pure nitrogen MF-DBD. The original feature is that spectroscopic measurements are performed on spatially stable nitrogen MF-DBDs, where emissions are recorded from VUV to near infrared emissions. It also constitutes a first step in providing essential electrical and spectroscopic data which will allow validation of electro-dynamic and kinetic modelling of these MF-DBDs which can be more easily controlled and modelled than multi-filamentary ones.
2. THE EXPERIMENTAL SETUP
Fig. 1: The experimental setup for electric and emission spectroscopic analysis of a MF-DBD (including photography)
The experimental setup allowing electrical and spectroscopic investigations of pure nitrogen MF-DBDs is shown in figure 1. It consists of a DBD chamber (cell) associated to a pumping/filling system, an electric supply as well as the electrical and spectroscopic measuring devices. The MF-DBD cell is a closed cylindrical glass chamber provided with two diametrical side-on fittings, each one equipped with a high voltage vacuum feed-through isolated (15 kV)
from the chamber. Each electrode is a 4-mm diameter cylindrical aluminium rod, covered with a ddie = 0.5 mm thick insulating MAKOR on its flat front-end (relative electrical permittivity: εR =
4.0). Such small plate-to-plate double barrier configuration electrodes ensures establishment of a unique filamentary barrier discharge for every half-cycle of the driving sinusoidal voltage usup(t)
[Merbahi N et al 2004] and was previously used to investigate rare gas DBDs. The gap distance was maintained at d =1 mm, so as to achieve stable MF-DBDs in pure nitrogen at a pressure of PN2 = 760 Torr, with our electric supply at a frequency of f = 7.8 kHz. Daily refreshed, the DBD
cell was filled with 99.999% pure nitrogen (Air Liquide) and before filling up, it was pumped down to about 10-7 Torr. The impurities initially present in our gas were: O2, H2, CO, CO2,
CNHM (< 0.1 p.p.m., each) and H2O ( < 0.5 p.p.m.).
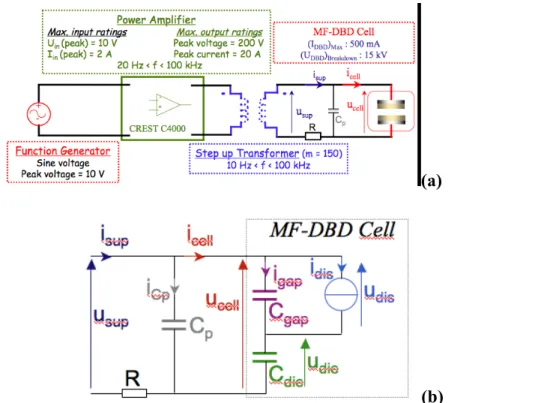
Fig. 2a shows the complete electrical driving circuit with the relevant electrical ratings. The tunable sinusoidal voltage, delivered by a function generator, was amplified by a CREST C4000 (4000 W, in the bridge mode at 1 kHz) power amplifier whose output voltage was stepped up via a ferrite transformer (voltage ratio 1:150). The supply voltage usup(t) available at its secondary
coil was measured with a high voltage probe (Tektronix P6015A, bandwidth: 75 MHz), while the supply current isup(t) was recorded via a resistance R = 50 Ω in series with the grounded
electrode. Both electrical waveforms were recorded by using a 2.5 GHz (2 channels) digital sampling 500 MHz bandwidth oscilloscope (Tektronix TDS 5054B).
(a)
(b)
Fig. 2: (a) The electric driving circuit of the MF-DBD (b) The equivalent electric circuit of the MF-DBD cell
The front-end of the reactor was equipped with a transparent MgF2 window for
spectroscopic measurements. To record the visible and near infrared emission spectra we used a 0.5 m imaging visible spectrophotometer (V_MC: Acton Spectra Pro 2556i, in the Czerny-Turner configuration). The detecting device was a 32-bits 2D Intensified Charge Coupled Device camera (ICCD: Princeton Instruments, 512x512 pixels) was placed at its exit port. Its spectral domain lies
within 360 and 920 nm. The emitted photons were guided to the entrance slit of the V_MC spectrophotometer via a 3 m-long optical fibre (OF: UV-Silicon LG-455-020-3).
For VUV measurements the optical fibre (OF) and the visible spectrophotometer (V_MC) were replaced by a 0.3 m VUV monochromator (VUV_MC, in the Czerny-Turner configuration as well) equipped with a fast solar blind photomultiplier tube (PMT). The PMT operated in the photon counting mode and its anode pulses were delayed through a delay line (DL) then processed by a constant fraction discriminator (CFD-Sig) and finally sent to a multi-channel analyzer (Stanford Research SR430). In order to classify these photons according to their emission instant, the time origin of the discharge needs to be unambiguously detected. For each micro-discharge this origin instant was defined on the leading edge of the fast current pulse via a fast amplifier and a constant fraction discriminator (CFD-Trig). No significant difference is observed for the electric and spectroscopic behaviours of the MF-DBD between the positive half-cycle and the negative one. So, the VUV emission spectrum was recorded by summing all the photons of the luminescence decays accumulated over a great number of discharges of only the positive half-cycle of the supply voltage, for each central exit wavelength of the monochromator, between 120 and 200 nm. For all VUV records, we verified that the probability for more than one photon to be recorded in a single channel was always less than 1 ‰.
All the emission spectra were performed on the first interference order of the grating. The exit spectral width Δλexit and the wavelength step dλstep were equal. Our VUV, UV, visible and near
IR optical emission spectra are given without any correction for the wavelength-dependent of the relevant detection device. For VUV measurements (130-200 nm: 2400 grooves/mm grating), the MgF2 exit window was the high-pass filter whereas for UV emissions (200-400 nm: 2400
grooves/mm grating), air was a natural high-pass filter. For the 400-600 nm (2400 grooves/mm) and 600-900 nm (1200 grooves/mm grating) spectral ranges, either the Corning 0-53 (cutting wavelength: 340 nm) or the MTO J517a (cutting wavelength: 517 nm) high-pass filter was
respectively used. The exit spectral widths were respectively 0.5 nm, 0.016 nm, 0.020 nm and 0.073 nm for these spectra.
3. ELECTRICAL DIAGNOSIS OF A MF-DBD
Fig. 2b shows the equivalent electrical circuit, which fairly describes the dynamic behaviour of an axially symmetric DBD [Liu S and Neiger M 2001]. The filamentary discharge is represented by a non-linear dissipative current source idis(t). The capacitor Cdie is the total capacity
of both dielectric layers whereas Cgap accounts for the inter-electrode region devoid of any
discharge.
!
Ccell =
Cgap" Cdie Cgap+ Cdie
represents the total cell’s capacity. The capacitor Cp represents the total
stray capacitors of the driving circuit due to the electrical leads and probes. In this model, we assume that Cdie remains linear and that Cgap keeps the same value whether a discharge occurs or
not. These assumptions will be commented in section 4.1. Cgap and Cdie are calculated from
geometrical considerations: ! Cgap = "0S d = 0.25 pF and ! Cdie= "0"RS
2 ddie = 1.00 pF. The stray
capacitor Cp was determined from usup(t) and isup(t) when no discharge occurs:
!
CP = 0.44 pF
.
Time origin is considered at the instant when the discharge voltageudis(t) is maximum. This instant
is obtained from our calculations. In our experimental conditions, the voltage drop uR(t) across the
resistance R (50 Ω) was about (10.0 ± 0.1) V and was negligible compared to the amplitude of the supply voltage usup(t). The voltage ucell(t) applied to the DBD cell was:
!
ucell(t) " usup(t) = UMaxsin(2#ft + 0.150) (1)
When the voltage across the gap udis(t) is high enough to induce a primary electronic
avalanche, a single micro-discharge occurs for each half-cycle. The measured supply current isup(t)
is then a fast-rising pulsed current superimposed on a slow displacement current [Merbahi N et al 2004]. The current icell(t) flowing through the DBD cell can be evaluated:
!
icell(t) = isup(t) - iCp(t) = isup(t) - Cp
dusup(t)
dt " isup(t) - Cp
ducell(t)
dt (2)
In our experimental conditions, the current flowing through the stray capacitor iCp(t) is so
weak that icell(t), calculated from equation (1), could hardly be distinguished from isup(t): the
amplitude of iCp(t) was less than 0.7 mA. The current icell(t) can also be considered as a fast and
short current pulse icell_Pulse(t) (this component exists only during the discharge phase)
superimposed on a slow weak displacement one: icell_Displ(t)(itself due to the cell's capacity Ccell):
!
icell(t) = icell_Pulse(t) + icell_Displ(t) (3)
According to the electrical scheme given in Fig. 2b, the voltage drop udie(t) across both dielectric
layers can be calculated from icell(t). The voltage drop udis(t) across the gap is then easily deduced.
In order to evaluate the electrical power injected in the micro-discharge, the discharge current idis(t)
should also be determined:
! idis(t) = 1 + Cgap Cdie " # $ % & ' icell(t) - Cgap ducell(t) dt (4)
And substituting equation (3) in equation (4), idis(t) is found to be proportional to the pulsed
component icell_Pulse(t) of icell(t):
! idis(t) = 1 + Cgap Cdie " # $ % & ' icell_Pulse(t) (5)
icell_Pulse(t) can be determined by subtracting the displacement component icell_Displ(t) from icell(t).
!
icell_Displ(t) = Ccell
ducell(t)
dt (6)
The energy E1 and the charge Q1 injected into a single filament are respectively:
! E1= idis(t) " udis(t) dt 0 1 2 f
#
(7) ! Q1= idis(t) dt 0 1 2 f"
(8)4. RESULTS AND DISCUSSION
4.1. Electrical behaviour of the nitrogen MF-DBD
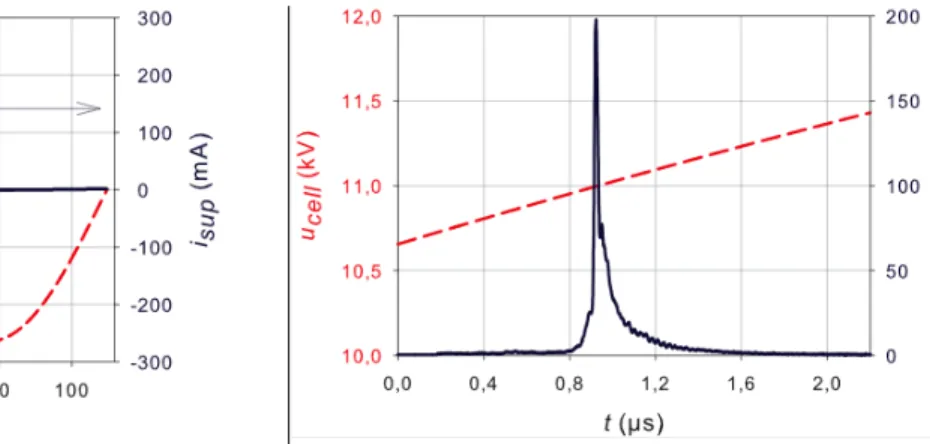
In order to analyze the electrical behaviour of the MF-DBD, representative waveforms of usup and of isup were recorded and processed with the macroscopic model previously described so as
to determine the discharge voltage udis and current idis. The supply voltage usup and current isup are
given in fig. 3a for one signal period T = 1/f. As explained, the sinusoidal cell voltage ucell was
almost equal to usup, and icell could hardly be distinguished from isup at f = 7.8 kHz.
The recorded quantities (amplitudes, frequencies, rise- and fall- times) of our electric signals, denoted by x, correspond to mean values of the N = 101 samples. The expanded uncertainty Δx of each quantity was calculated, according to the general rules established by ISO in Guide to the Expression of Uncertainty in Measurement [ISO/IEC Guide 98: 1995], by multiplying the standard deviation σX of each quantity x, by a coverage factor of two (Δx = 2 σx) which defines
a level of confidence of approximately 95%. The standard deviation was obtained by the appropriate functionality of the digital oscilloscope.
Fig. 3a: The cell voltage and supply current at f = 7.8 kHz (one period)
Fig. 3b: The cell voltage and supply current (with an expanded scale: tB < t < tE).
For the supply voltage: UMax = (13220 ± 43) V and f = (7.79 ± 0.02) kHz. The amplitude of
the cell current is Icell_Max = (200.0 ± 2.5) mA, and its measured rise-time and fall-time are
relative uncertainties are respectively: ! "U U = 0.32% and ! "I
I = 1.23% . We assume that our voltages and currents are all known with the above relative uncertainties.
In Fig. 3b the supply voltage and current are depicted with an expanded time scale corresponding to the discharge phase, from the ignition time (tB) to the extinction time (tE). In Fig.
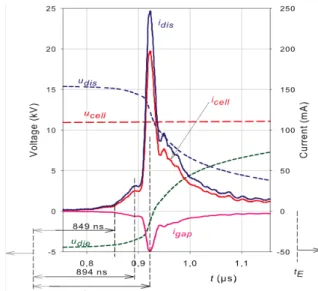
4a, we represent the discharge voltage udis and current idis as well as the ucell and the voltage drop
across both dielectrics udie, during the positive half cycle. The various currents and voltages of the
circuit are displayed in Fig. 4b, with an expanded time-scale so that the different discharge phases can be followed. For the positive half-cycle, we can thus distinguish the following phases:
Fig. 4a: ucell, udis, udie and icell at f = 7.8 kHz (over a half period)
Fig. 4b: ucell, udis, udie, icell, idis and igap at f = 7.8 kHz (with an expanded scale < discharge duration)
4.1.1 Establishment of the mono-filamentary discharge
(i) t0 = -19246 ns < t < tB = 0 ns: Pure capacitive divider circuit. Initially (t = t0 = - 19246 ns)
the voltage drop across both dielectrics udie(t0) is negative, due to the net charge accumulated on
the dielectric surfaces during the preceding micro-discharge (negative half cycle). The initial voltage across the discharge itself is:
!
udis(t = t0) = U0=
qdie(t = t0)
Cdie
= (7.500 ± 0.024) kV. udis then
electrical field across the gap is high enough to ignite the gas, at t = tB. During this phase icell_Pulse
and hence idis are both equal to 0 A.
! udis = Cdie Cgap+Cdie " # $ $ % & ' ' ucell+U0 = 0.8 ucell+U0 (9)
(ii) t = 0 ns: Gas ignition. The gas ignites (idis starts) when the space charge is high enough to
accelerate "seed electrons" present in the gas. At this instant tB the gap voltage attains its
maximum value, the ignition voltage VB = udis(tB) = (15.752 ± 0.051) kV, which corresponds to a
mean axial reduced field (E/N) of (644 ± 2) Td (where 1 Td = 10-17 V cm2). The cell and dielectric voltages are respectively: ucell(tB) = (10.725 ± 0.035) kV and udie(tB) = (-5.027 ± 0.016) kV.
(iii) 0 ns < t < 849 ns: Townsend stabilization phase or background charge phase. After ignition, idis increases only slightly while udis decreases very slightly around 15.7 kV. This time lag, which
is about 0.8 µs here, is usually observed in nitrogen filamentary DBDs. According to Yurgelenas and Wagner [YurgelenasY V and Wagner H-E 2006] who performed a computational model of a barrier discharge in air (d = 1.2 mm) at atmospheric pressure N2/O2 binary mixtures, residual
charges play an important role in the micro-discharge (MD) formation. According to their calculations, in this first phase, which they labelled as a Townsend phase by stabilization, the "early" electrons are multiplied through ionization processes and then accumulated on the anode dielectric, thus leaving a net ionic density in the gap. It follows that ions dominate in the gap. The discharge current (and axial electron density) increases slowly until the charges accumulated on the dielectrics reduce the axial electric field. During this stabilization phase where background charges are accumulated [Capeillère J 2009], the axial field remains nearly constant along the gap's axis. It lasts several µs in air at atmospheric pressure, and the electron number density remains quite low.
In other gases like argon and xenon this phase is generally skipped [Merbahi N et al 2004] [Merbahi et al 2007]. So it seems that, in nitrogen based DBDs ignition processes followed by the avalanche propagation should be somewhat different from the classical Townsend breakdown usually encountered at such high p.d values (76 Torr.cm) in noble gases.
(iv) 849 ns < t < 894 ns: Electronic avalanche propagation or space-charge-dominated phase. It then follows another phase characterized by an exponential growth of the charged particles (electrons and ions) in every position of the gap. The current idis then increases much faster. The
electrons attain the anode at about t = 894 ns, which corresponds to the first current peak around 30 mA. In the meanwhile udis decreases slowly. A semi-log plot of idis (not given here) shows that
during the electronic avalanche idis rises quasi-exponentially with a time constant of τavalanche ≈
100 ns, quasi-independent of pressure from 100 Torr to 760 Torr.
(v) 894 ns < t < tM = 923 ns: Propagation of the cathode directed ionization wave (IW) or
filamentary phase. Following the preceding space-charge-dominated phase, a fast cathode directed ionization wave (streamer) propagates towards the cathode due to secondary electrons emitted by the cathode dielectric. During this phase (duration = 29 ns), idis increases very rapidly.
When the ionization wave reaches the cathode, the discharge current rise slows down because of the additional charge deposited on the cathode layer. The usual characteristic "flagging" of the discharge current [Merbahi N et al 2004] is not observed in our conditions probably because the streamer propagates too fast, the space charge being quite high at this pressure.
The charge deposited on both dielectrics t > tM, lowers the axial electric field. However, the
radial electric field becomes strong enough to initiate a surface discharge in the vicinity of the cathode dielectric. The formation of a thin luminous cathode layer starts. Up to t = tM, this
(vi) tM < t < tE =2000 ns: Cathode layer formation. When t = tM, idis attains its maximum value,
the charge deposited on both dielectrics predominates over the effect of the increase of the conducting cross-section available at the cathode. The cathode layer grows up while the discharge current idis rapidly falls down. We verified that the current oscillations present near the
end of this discharge extinction did not correspond to reflections of the pulsed current along the electrical leads.
(vii) t = tE: Discharge quenching. At t = tE when plasma conductivity is greatly reduced mainly
due to accumulation of electrons and ions on the opposite surface of the dielectrics, the discharge stops: idis = 0 mA. The gap voltage then attains its minimum value VE = (2097 ± 7) V (extinction
voltage). The corresponding mean axial reduced field is (86.0 ± 0.3) Td. At this particular instant, the cell and dielectric voltages are respectively: ucell(tE) = (11.365 ± 0.037) kV and udie(tE) =
(9.268 ± 0.030) kV.
(viii) t > tE: Post-discharge. The luminescence decay of the main VUV emission at 150 nm
shows that this emission lasts more than 1 µs after ignition (section 4.2.2), while the current is completely quenched. Between t = tE and t = t0 + T/2, no discharge exists again (idis = 0 mA) and
udis is consistent with:
! udis= Cdie Cgap+Cdie " # $ $ % & ' ' ucell( U0.
Then, the discharge of the negative half-cycle occurs, similarly to the previously described successive phenomena.
4.1.2 Characteristics of the mono-filamentary discharge
During the positive filamentary discharge, the cell voltage varies from 10.72 to 11.36 kV (Fig. 3b), showing that, between tB and tE, the supply voltage drop is about 5.8%, around 11.04
kV. Moreover, the current igap flowing through Cgap is negative (udis decreases monotonically
of Cgap and Cdie, the discharge’s maximum current ((246.8 ± 3.0) mA) is 25% higher than the
amplitude of icell: (198.2 ± 2.4) mA.
The different characteristic times of the discharge current idis are calculated for the
electrical sample given here. The full wave half maximum (FWHM) of idis and the duration
during which idis remains above 10% of its maximum value are respectively t_half_cal = (21.6 ±
2.1) ns and t_full_cal = (169.2 ± 6.2) ns. The rise- and fall- times of idis are respectively (35.2 ±
3.4) ns and (125.5 ± 4.6) ns.
The electric energy E1 injected in a single discharge and its uncertainty
! "E1= E1 "UMax UMax # $ % & ' ( 2 + "IMax IMax # $ % & ' ( 2
are also calculated:
!
E1 = (157.9 ± 2.0) µJ. Compared to argon
[Merbahi N et al 2004], krypton [Merbahi N et al 2010] and xenon [Merbahi N et al 2007], for which typical values of E1 do not exceed 5 µJ, such a high value is not astonishing for nitrogen,
in regard to both a high ignition voltage VB and discharge current amplitude, despite the short
pulse duration. The electric charge Q1 injected in one discharge (its uncertainty
! "Q1= Q1 "IMax IMax ), is: ! Q1 = (17.72 ± 0.22) nC.
Much emphasis needs to be laid upon the fact that the displacement current of icell perfectly
fits the cell current during the whole capacitive voltage divider phase, meaning that Cp is
correctly determined. Besides, during the discharge phase, both Cdie and Cgap seem to remain
constant. As far as Cdie is concerned, this is not astonishing because the charges are deposited on
the anode and cathode surfaces. However, even if the MD occupies a certain gap volume due to the filament, the funnel shape anode charges and the disc of the cathode layer, the gap capacitance Cgap remains unaffected in the short duration of the discharge. Macroscopically, the
Fig. 4b shows that after discharge quenching, udis never exceeds udie during the positive
half-cycle. This excludes the occurrence of a second MD before the negative half-cycle. If wrong values of Cdie and Cgap are used, the calculated waveform udis can exceed VB in the post-discharge
phase and most of the discharge parameters (mainly VB and VE) will then be incorrectly
determined. Indeed, the waveforms of udis and idis are very sensitive to Cp, Cgap and Cdie. So our
results were crosschecked by calculating the injected charge by two different manners.
! Q1= idis(t) dt tB tE
"
= icell(t) dt tB tE"
# igap(t) dt tB tE"
= Cdie{udie(tE) - udie(tB)}+ Cgap(VB- VE)= 14.31+ 3.42( )nC = 17.72 nCand
!
Q1= C
(
gap+ Cdie)
(VB- VE)+ Cgap{ucell(tE) - ucell(tB)}= 17.08 + 0.64( )nC = 17.72 nCThe last detailed estimation of Q1 shows that the charge injected in a MD is merely (96%)
the charge variation for the capacitor equivalent to two parallel capacitors Cgap and Cdie. The
injected energy is:
! E1" 1 2
(
Cgap+ Cdie)
VB 2 - VE 2(
)
= 153µJ. So, provided that tB and tE can be estimated byvisualising ! udis(t) = ucell(t) -icell(t' ) dt' t0 t
"
+ qdie(t0) Cdie, Q1 and E1 can be simply evaluated in the following
manner, without the determination of idis:
! VB = udis(tB) ! VE = udis(tE) ! E1" 1 2
(
Cgap+ Cdie)
VB 2 - VE 2(
)
!4.2. Spectroscopic results and discussion 4.2.1 UV spectrum
(a) (b)
Fig. 5: Emission spectrum (Δλexit = 0.016 nm): (a) 200 – 400 nm (b) 200 – 300 nm
Fig. 5 depicts the UV emission spectrum of the atmospheric pressure N2 MF-DBD recorded
within 200 and 400 nm. The most intense emissions observed between 300 and 400 nm can be attributed to the N2 Second Positive System (SPS: N2[C 3Πu]→ N2[B 3Πg]) emission bands, with
a dominant emission (0,0) band head at 337.1 nm. Between 200 and 300 nm (Fig. 5b), a few weak double head characteristic emissions are observed and are attributed to the NOγ bands, even if laboratory 99.999% pure nitrogen is used. We believe that oxygen is present in the discharge, due to unavoidable impurity traces and sputtering of our dielectric material.
4.2.2 Visible spectrum
The visible spectrum recorded between 400 and 600 nm (Fig. 6) is mainly dominated by the SPS emissions. The weak emission at 391.4 (Fig. 6b), whose rotational blue wing looks different to SPS ones, is attributed to the (0-0) transition of the N2 First Negative System (FNS: N2+[B 2
Σ+u] → N2+[X 2Σ+g]). The upper level of this emission is very high (19 eV), can be reached by
either likely step ionisation via a relay metastable molecule or by less likely direct electronic collisions, in the very short cathode directed streamer phase (814 ns < t' <923 ns).Subsequently, the FNS is expected to be very weak, and its existence is not astonishing since our discharge is
filamentary. If any weak FNS (0-1) transition emitting at 427.8 nm is present it can't be distinguished from the characteristic SPS (1-5) band at 426.97 nm, bearing a characteristic SPS rotational blue wing. The SPS (2,5) band (band-head at 394.3 nm) is also present in our spectrum. Another very weak molecular emission peaking at 557.7 nm is also present. It may correspond to the O(1S)N2 excimer emitting according to : O(1S)N2 + O(1D) + N2 + hν558. This emission
was also observed by Kozlov K V et al [Kozlov et al 2005] in a diffused N2/O2 atmospheric
pressure DBD. In atmospheric air MF-DBD, they did not observe this emission, but also recorded a very weak FNS (0-0) transition. More recently, Meiners A et al [Meiners A et al 2009] reported both (0-0) and (0-1) FNS transitions in a multi-filamentary N2 BDB.
(a)
(b)
(c)
Fig. 6: Emission spectra (Δλexit=0.02 nm): (a) 400–600 nm (b) FNS 0-0 transition at 391.4 nm) (c) ON2 excimer
4.2.3 Near IR emission spectrum
Fig. 7 shows the emission spectrum of the MF-DBD between 600 and 900 nm. The Herman IR System (HIRS: N2[C" 5Πu]→N2[A' 5Σg+]) dominates the spectrum with emissions at 703.3
(3-1) nm, 709.4 nm (2-0), 747.2 nm (2-(3-1), 755.8 nm (1-0), 810.1 nm (0-0), 839.7 nm (1-3) and 854.9 nm (1-2). The values given between brackets are the vibrational levels of the molecular transitions. At 760 Torr, N2[C" 5Πu] molecules can easily be populated via 2-body collisions
between the metastable N2[A 3Σu+]) and their vibrational levels depend on the electron energy
distribution. The emissions recorded between 650 and 670 nm are attributed to the N2 First
Positive System (FPS: N2[B 3Πg]→N2[A 3Σu+]), namely at 662.4 nm (6-3), 678.8 nm (4-1), 770.5
nm (5-2) and 775.4 nm (2-0).
Fig. 7: Emission spectrum in the 600 to 900 nm range (Δλexit = dλstep = 0.073 nm)
All the UV and visible emissions shown in fig. 5 were reported by many authors ([Meiners A et al 2009], [Kozlov et al 2005]) for nitrogen or air filamentary plasmas. Meiners et al [Meiners A et al 2009] observed both the HIRS and FPS in the multi-filamentary N2 dielectric barrier
discharge with flowing nitrogen. Cermak et al [Cermak et al 2007] reported similar FPS and HIRS emissions in a plane-to-plane DBD. Simek et al 2001 studied a pulsed positive primary atmospheric pressure nitrogen streamer in a wire-cylinder configuration corona discharge. Above 700 nm, their observations are quite similar to ours.
4.2.4 VUV emission spectrum
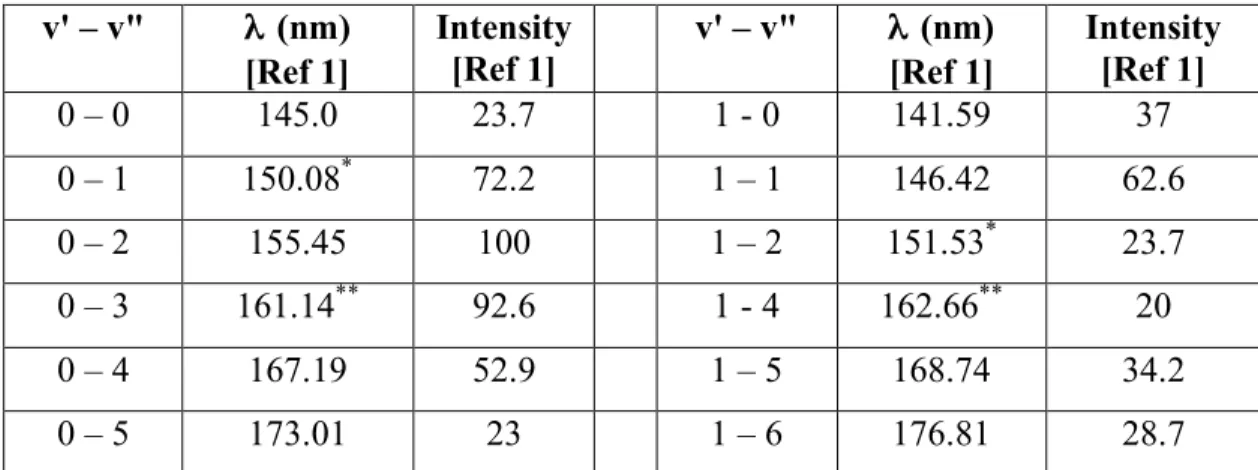
For the VUV emissions whose wavelengths are situated between 130 and 180 nm (fig. 8), we observed a main narrow emission (Full Wave Half Maximum of about 1 nm) at 150.0 nm together with some other weak emissions between130 and 174 nm. Between 180 and 200 nm, did not record any emission because of the upper cut-off wavelength of our extremely solar blind
photomultiplier tube at 180 nm. No significant emission was present between 120 and 130 nm. These weak emissions are attributed to the Lyman-Birge-Hopfield System (LBHS) which arises from transitions issuing from the N2[a1Πg] states towards the N2[X1Σ+g] ones. The transitions and
wavelengths of the observed emissions are given in table A.1 (appendix), where the reported wavelengths and relative intensities correspond to values given in reference [Lofthus and Krupenie 1977]. A close look at these relative intensities suggests that the 0-2, 0-4, 1-0, 1-1, 1-4, 1-5 and 1-6 transitions of the LBH system are likely. If it occurs, the 0-3 transition is unexpectedly weak while the 0-5 one is not present in our spectrum. As specified in table A.1 and as expected due to the relative positions of the potential curves of the involved molecular nitrogen states [Lofthus and Krupenie 1977], the 0-2 transition should be the most intense one. The intense narrow emission peaking at 150 nm is therefore too strong to be attributed to the 0-1 LBHS transition. It is attributed to a nitrogen atomic line issuing from the N[2s2p23s 2P] triplet towards the N[2s22p32D°] state.
Fig. 8: Emission spectrum in the VUV range: 130 to 200 nm (Δλexit = dλstep = 0.5 nm)
The N[2s2p23s 2P] excited atom can also undergo a radiative decay (175 nm) towards the N[2s22p32P°]. The N[2s2p23s 2P] level has a very short lifetime of 2 ns. This means that if atomic
nitrogen is produced, it can emit two emissions at 150 nm and 175 nm, even at 760 Torr. The temporal luminescence decays of these atomic emissions are depicted with linear scales in fig. 9a, where the integrated values of the photon counts over the total emission width of each radiation are corrected for the quantum efficiency of the photomultiplier tube: 11% at 150 nm and 1.6% at 175 nm. The time lag of longer than 1 µs suggests that these emissions occur after the streamer propagation phase. They may follow dissociative recombination processes, such as for example reaction R12 of table 1. We can consider that N2+(X 2Σg+) ground state ions lead to the
N(2s22p23s 2P) excited atomic state, which may emit both the 150 or 175 nm line. According to
Rahman R et al [Rahman R et al 2004], N2(A3Σu+) created by electron impact excitation is mainly
responsible for populating N(2P) via collisions with N(4S) atoms followed by electron impact of the N(2P
0) atomic by-product. Note that the dissociation of ground state N2 dimers requires 9.8
eV [Luo J et al 1999]which can be provided by the MF-DBD.
(a) (b)
Fig. 9: Luminescence decays of the 150 and 175 nm emissions (5 ns resolution) with (a) linear (b) semi-log scales.
The temporal luminescence decays of the nitrogen atomic lines are plotted in a semi-log scale in fig. 9b. Both emissions have similar time constants but the sharp maxima clearly suggest that the evolution laws of the photon counts are non-exponential This indeed provides evidence in favour of electronic dissociative recombination processes.
To our knowledge, VUV emissions of nitrogen MF-DBDs have never been reported before. Masoud N et al [Masoud N et al 2005] observed these emissions in a 300 Torr nitrogen radio-frequency (13.56 MHz) cylindrical dielectric barrier discharge and also attributed them to nitrogen atomic lines. In their spectrum where emissions from impurities were present, the peak intensity of the 175 nm line is about half the 150 nm one.
Rahman R et al [Rahman R et al 2004] also attribute these emissions recorded in a radio-frequency (rf) driven Ar/N2 hollow slot micro-plasma, operating in open air, to nitrogen atomic
lines. In their experiments the recorded emissions could arise either from the active rf discharge or from the downstream afterglow region. Ambient air species such as O2, H2O could also
intervene. Consequently they also observed some other nitrogen atomic lines (120 nm, 124.3 nm), hydrogen (121.60) and oxygen (130.5 nm) ones, as well as the OH and NH bands at respectively 308 nm and 315.8 nm.
Occurrence of the observed VUV, UV, visible and near IR emissions of our pure nitrogen MF-DBD at 760 Torr may be partly explained by the non-exhaustive reactions listed in table 1. Direct electronic excitation and ionisation are likely to occur during the electronic avalanche propagation and streamer phases where electrons are quite energetic. Metastable N2(A3Σu+: 6.17
eV, τrad = 13 s) molecules can then be populated through reaction R1, while N2+(X 2Σg+: 15.5 eV)
molecular ions can be created indirectly by reaction R10 (+9.5 eV) or to a lesser extent directly by reaction R8. Note that according to Cesses [Cesses Y 2004], in the steady operation metastable N2(A 3Σu+) molecules are accumulated in the neighbourhood of both electrodes. Direct electronic
impact can also lead to the population of higher excited molecular states N2(B3 Πg: 7.35 eV, τrad
= 13 ms), N2(a1 Πg: 8.55 eV, τrad = 110 µs), N2(C3 Πu: 11.3 eV, τrad = 38 ns) by respectively
reactions R2, R3 and R4. These molecules can also be easily populated via electronic excitation processes stepping from the long-life metastable molecules N2(A 3Σu+) through reactions R5 (+1
eV), R6 (+2 eV) and R7 (+5 eV). During these phases, the highly excited N2(C3 Πu) molecule
predominantly emits the SPS leading to N2(B3 Πg) which in turn emits the FPS. Furthermore,
step-wise ionisation towards the N2+(X2 Σg) can also take place from N2(A 3Σu+: 9.5 eV (R10)).
Further excitation leads to N2+(B2 Σu+) which are responsible for the FNS. Direct electronic excitation from the ground state N2 molecule :
e- + N2(X 1Σg+) N2(A3Σu+) + e- (6 – 7 eV) (R1) e- + N2(X 1Σg+) N2(B3Πg) + e- (7.5 – 8 eV) (R2) e- + N2(X 1Σg+) N2(a1Πg) + e- (8.5 – 9 eV) (R3) e- + N2(X 1Σg+) N2(C3Πu) + e- (11 – 12 eV) (R4) Step-wise electronic excitation from the metastable molecule :
e- + N2(A3Σu+) N2(B3Πg) + e- (1 – 2 eV) (R5) e- + N2(A3Σu+) N2(a1Πg) + e- (2 – 3 eV) (R6) e- + N2(A3Σu+) N2(C3Πu) + e- (5 – 6 eV) (R7) Direct electronic ionisation from the ground state N2 molecule :
e- + N2(X 1Σg+) N2+(X2Σg+) + 2e- (15.5 eV) (R8) e- + N2(X 1Σg+) N2+(B2 Σu+) + 2e- (19 eV (R9) Step-wise electronic ionisation from the metastable N2 molecule :
e- + N2(A3Σu+) N2+(X2Σg+) + 2e- (9.5 eV) (R10) e- + N2(A3Σu+) N2+(B2 Σu+) + 2e- (13 eV) (R11) Dissociative electronic recombination of the ground state N2 molecular ion :
e- + N2+(X 2Σg+) N(2s22p23s 2P) + N(4S0) (R12) Radiative decay of nitrogen molecules and atoms:
N2(C 3Πu, υ) Ν2(Β3Πg, υ’) + hνSPS (R13) N2+(B 2Σu+, υ) Ν2+(Χ 2Σg+, υ’) + hνFNS (R14) N2(B3 Πg, υ) Ν2(A3Σu+, υ') + hνFPS (R15) N2(C" 5Πu, υ) Ν2(A'5Σg+, υ') + hνHIRS (R16) N2(a 1Πg, υ) N2(X 1Σg+, υ') + hνLBHS (R17) N(2s22p23s 2P) N(2s22p32D°) + hν 150 (R18) N(2s22p23s 2P) N(2s22p32P°) + hν175 (R19) Pooling reaction of Ν2(A3Σ+u) metastables:
Ν2(A3Σ+u) + Ν2(A3Σ+u) N2(C" 5Πu) + N2(X 1Σ+g) (R20)
A full kinetic study of the post-excitation phase requires analysis of the pressure dependence of temporal decays of some visible emissions and is beyond the scope of this paper.
Conclusion
We report the electrical investigation of a high-pressure pure nitrogen MFDBD, together with its spectroscopic characteristics from the VUV to infrared emissions. As far as we know, VUV emissions of nitrogen MF-DBDs have never been reported before.
The observed emission spectrum can be attributed to a single filamentary discharge and is dominated by the second positive system in the UV and blue spectral ranges. The Herman infrared and first positive systems are emitted between 650 and 850 nm. Inevitable weak UV emissions of the NO-γ system are observed as well and "traces" of O(1S)N2 excimer emission at
557 nm. A weak emission of the (0-0) transition of the first negative system peaking at 391.4 nm is present and this is consistent with the visual observation of filamentary behaviour of our discharge. The corresponding ionic molecules are probably excited during the streamer propagation phase. Even at such a high pressure two significant nitrogen atomic lines are observed at 150 and 175 nm, lagging about 1 µs after discharge ignition, suggesting that the relevant exited nitrogen atoms likely result from recombination of ionic nitrogen molecules. Our emission spectra bear some discrepancies with the few results available for VUV and IR emissions. We believe that this is due to many combined reasons: the operating pressure, our operating discharge mode and possible impurities. The electrical analysis, performed with a macroscopic model, allows determination of the ignition and extinction voltages as well as the injected energy and electric charge. An empirical technique, based on the use of available digital oscilloscope, is proposed to rapidly evaluate all these quantities, without performing bulky calculations. The experimental results presented here provide valuable electrical and
spectroscopic in-situ data to validate electro-dynamic and kinetic modelling of filamentary discharges.
Acknowledgements
This work was partly supported by the French National Research Agency (ANR) via the ANR-IPER project, Project manager: C. Laux. The authors would like to thank Dr. M. Yousfi, Dr. G. Ledru, Dr. O. Eichwald and Dr. A. Ricard for their useful help in this study.
Appendix v' – v" λ (nm) [Ref 1] Intensity [Ref 1] v' – v" λ (nm) [Ref 1] Intensity [Ref 1] 0 – 0 145.0 23.7 1 - 0 141.59 37 0 – 1 150.08* 72.2 1 – 1 146.42 62.6 0 – 2 155.45 100 1 – 2 151.53* 23.7 0 – 3 161.14** 92.6 1 - 4 162.66** 20 0 – 4 167.19 52.9 1 – 5 168.74 34.2 0 – 5 173.01 23 1 – 6 176.81 28.7
Table A-1 : Emissions of the LBHS in the range of 130 – 180 nm (Ref 1: Lofthus and Krupenie 1977, Pg 204) (*): Cannot be distinguished from the more intense 150 nm emission of atomic nitrogen
(**): Overlapping emissions due to our exit spectral width equal to 0.5 nm References
[Adler F and Muller S 2000] Adler F and Muller S 2000 Formation and decay mechanisms of excimer molecules in dielectric barrier discharges J. Phys. D: Appl. Phys. 33 pp. 1705–15
[Azrague K et al 2005] Azrague K, Bonnefille E, Pradines V, Pimienta V, Oliveros E, Maurette M Tand Benoit-Marquié F 2005 Hydrogen peroxide evolution during V-UV photolysis of water during the degradation of organic compounds Photochemical & Photobiological Sciences 4 pp. 406-8
[Babayan S E et al 1998] Babayan S E, Jeong J Y, Tu V J, Park J, Selwyn G S and Hicks R F 1998 Deposition of silicon dioxide films with an atmospheric pressure plasma jet Plasma Sources Sci. Technol. 7 pp. 286-8
[Becker K H et al 2004] Becker K H, Kogelschatz U, Schoenbach K H and Barker R J (ed) 2004 Non-Equilibrium Air Plasmas at Atmospheric Pressure (Bristol: Institute of Physics Publishing) chapter 9. [Biomorgi J et al 2005]Biomorgi J,Haddou M, Oliveros E, Maurette M T and Benoit-Marquié F 2005 Coupling of Adsorption on Zeolite and V-UV Irradiation for the Treatment of VOC Containing Air Streams Journal of advanced Oxidation Technologies 13(1) pp. 107-15
[Boichenko A M et al 2004] Boichenko A M, Lomaev M I, Tarasenko V F, and Yakovlenko S I 2004 The Effect of the Excitation Power on the Emission Efficiency of Barrier- and Glow-Discharge Driven Exciplex and Excimer Lamps Laser Physics 14-7 pp. 1–14.
[Borcia G et al 2003] Borcia G et al 2003 Dielectric barrier discharge for surface treatment: application to selected polymers in film and fibre form Plasma Sources Sci. and Technol. 12 pp. 335-44
[Capeillère J 2009] Capeillère J 2009 Modélisations numériques bidimensionnelles du transport des particules et photons dans des gaz ionisés. Application au xénon sous excitation laser et à la propagation d’une décharge monofilamentaire à barrières di´électriques dans l’azote Thèse de doctorat de l’Université de Toulouse —Toulouse III, Paul Sabatier
[Carman R J and Mildren R P 2003] Carman R J and Mildren R P 2003 Computer modelling of a short-pulse excited dielectric barrier discharge xenon excimer lamp (λ ∼ 172 nm) J. Phys. D: Appl. Phys. 36 pp. 19–33
[Carman R J et al 2004] Carman R J, Mildren R P, Ward B K and Kane D M 2004 High-pressure (>1 bar) dielectric barrier discharge lamps generating short pulses of high power vacuum ultraviolet radiation J. Phys. D: Appl. Phys. 37 pp. 2399–407
[Carman R J et al 2010] Carman R J, Kane D M and Ward B K 2010 Enhanced performance of an EUV light source (λ = 84 nm) using short-pulse excitation of a windowless dielectric barrier discharge in neon J. Phys. D: Appl. Phys. 43 pp. 025205–16
[Cermak P et al 2007] Cermak P, Varga J, Macko P, Martisovits V and Veis P 2007 Study of nitrogen dielectric barrier discharge at Near and over atmospheric Pressure by Optical Emission Spectroscopy WDS'07 Proceedings of contributed papers, Part II pp. 101-5
[Cesses Y 2004] Cesses Y 2004 Modélisation bidimensionnelle d’une décharge à barriéres diélectriques: mise en évidence de l’importance des phénomènes aux électrodes Thèse de doctorat de l’Université Paul Sabatier, Toulouse III
[Dietz et al 2004] Dietz D, Ghezel-Ayagh H, Hunt J, Belkind A, Becker K and Nickens A 2004 31st IEEE ICOPS (Baltimore, MD, 2004) pp. 412
[Gonzalez et al 2004] Gonzalez M G, Oliveros E, Woerner M and Braun A M 2004 Vacuum-ultraviolet photolysis of aqueous reaction systems Journal of Photochemistry and Photobiology, C: Photochemistry Reviews 5(3) pp. 225-46
[Herrman H W et al 1999] Herrman H W, Henins I, Park J and Selwyn G S 1999 Phys. Plasmas 6 pp. 2284-9
[Hitzschke L and Vollkommer F 2001] Hitzschke L and Vollkommer F 2001 Product families based on dielectric barrier discharges 9th Int. Symp. on the Science and Technology of Light Sources (Ithica, USA, August 2001) pp. 411–21
[ISO/IEC Guide 98:1995] ISO/IEC Guide 98:1995 Guide to the Expression of Uncertainty in Measurement (GUM) (Geneva, Switzerland: ISO)
[Jinno M et al 2005] Jinno M, Motomura H, Loo K H and Aono M 2005 Emission characteristics of xenon and xenon–rare gas dielectric barrier discharge fluorescent lamps J. Light. Vis. Environ. 29 pp. 91-8 [Kogelschatz U et al 1999] Kogelschatz U, Eliasson B and Egli W 1999 From ozone generators to flat television screens: history and future potential of dielectric-barrier discharges Pure Appl. Chem. 71 N°10, pp. 1819-1828
[Kogelschatz U et al 2000] Kogelschatz U, Esrom H, Zhang J Y and Boyd I W 2000 High-intensity sources of incoherent uv and vuv excimer radiation for low-temperature materials processing E-MRS-IUMRS-ICEM 2000 (of II.1 vol D) (Strasbourg, France) pp 1–8 (Invited paper)
[Korfatis G et al 2002] Korfiatis G, Moskwinski L, Abramzon N, Christodoulatos C, Kunhardt E, Crowe R, Wieserman L and Becker K 2002 8th Symp. on Atomic, Cluster, and Surface Physics (SASP, Going, Austria, 2002) Proc. 8th SASP ed P Scheier and T D M¨ark (Innsbruck: University of Innsbruck Press) pp. 309–12
[Koutsospyros A et al 2004] Koutsospyros A, Yin S-M, Christodoulatos C and Becker K 2004 Int. J. Mass. Spectrom. 233 pp. 30515
[Kozlov K V et al 2005] Kozlov K V, Bradenburg R, Wagner H-E, Morozov A M and Michel P 2005 Investigation of the filamentary and diffuse mode of barrier discharges in N2/02 mixtures at atmospheric pressure by cross-correlation spectroscopy J. Phys. D. 38 pp. 512-29.
[Kurunczi P et al 1999] Kurunczi P, Shah H and Becker H 1999 J. Phys. B.: At. Mol. Opt. Phys. 32 L651-8. [Liu S and Neiger M 2001] Liu S and Neiger M 2001 Excitation of dielectric barrier discharges by unipolar submicrosecond square pulses J. Phys. D: Appl. Phys. 34 pp. 1632–38
[Lofthus A and Krupenie P H 1977] Lotfhus A and Krupenie P H 1977 The spectrum of molecular nitrogen Journal of Physical and Chemical Reference Data Published by the American Chemical Society and the American Institute of Physics for NBS 6 David R Lide Jr. Editor
[Lukas C et al 2001] Lukas C, Spaan M, Schulz-von der Gathen, Thomson M, Wegst R, Döbele H F and Neiger M 2001 Dielectric barrier discharges with steep voltage rise: mapping of atomic nitrogen in a single filaments measured by laser-induced fluorescence spectroscopy Plasma Sources Sci. and Technol. 10 pp. 445-450
[Luo J et al 1999] Luo J, Steven L S, Hayashi Y and Matsumoto H 1999 Emission spectroscopic studies of plasmas-induced NO decomposition and water splitting J. Phys.Chem. A 103 pp. 6151–61
[Masoud N et al 2004] Masoud N, Marthus K E and Becker K 2004 Int. J. Mass Spectrom. 233 pp. 395-403.
[Masoud N et al 2005] Masoud N, Martus K and Becker K 2005 VUV emission from a cylindrical dielectric barrier discharge in Ar and in Ar/N2 and Ar/air mixtures J. Phys. D. 38 pp. 1674-1683
[Meiners A et al 2009] Meiners A, Leck M and Abel B 2009 Multiple parameter optimization and spectroscopic characterization of a dielectric barrier discharge in N2 Plasma Sources Sci. Technol. 18 045015 (10pp)
[Merbahi N et al 2004] Merbahi N, Sewraj N, Marchal F, Salamero Y and Millet P 2004 Luminescence of argon in a spatially stabilized mono-filamentary dielectric barrier micro-discharge: spectroscopic and kinetic analysis J. Phys. D: Appl. Phys. 37 1664–78
[Merbahi N et al 2007] Merbahi N, Ledru G, Sewraj N and Marchal F 2007 Electrical behavior and vacuum ultraviolet radiation efficiency of monofilamentary xenon dielectric barrier discharges J. Appl. Phys. 101 pp. 123309
[Mildren R P and Carman R J 2001] Mildren R P and Carman R J 2001 Enhanced performance of a dielectric barrier discharge lamp using short-pulsed excitation J. Phys. D: Appl. Phys. 34 L1–6
[Okazaki S et al 1993] Okazaki S, Kogoma M, Uehara M and Kimura Y 1993 Appearance of stable glow discharge in air, argon, oxygen and nitrogen at atmospheric pressure using a 50 Hz source J. Phys. D. 26 pp. 889-92.
[Qiu H et al 2004] Qiu H, Martus K, Lee W L Becker K H 2004 Hydrogen Generation in a Microhollow
Cathode Discharge in High-Pressure Ammonia-Argon MixturesInt. J. Mass Spectrom 233 1pp. 9-24
[Rahman A et al] Rahman A, Yalin A P, Stan O, Hoshimiya K, Yu Z, Littlefield E and Colins G J 2004 Absolute UV and VUV emission in the driven hollow slot microplasmas operating in open air Plasma Sources Sci. Technol. 13 pp. 537-547
[Simek M et al 2001] Simek M, Babicky V, Clupek M and Sunka P 2001 Observation of the N2 Herman infrared system in a pulsed streamer induced emission at atmospheric pressure, J Phys D, 34 pp. 3185-90 [Vollkommer F and Hitzschke L 1996] Vollkommer F and Hitzschke L 1996 Pulsed dielectric barrier discharges - a breakthrough in UV radiation generation IEEE 23rd ICOPS (Boston, USA, August 1996) pp. 270
[Wagner H-E et al 2003] Wagner H-E, Bradenburg R, Kozlov K V, Sonnenfeld A, Michel P and Behnke J F 2003 The barrier discharge: basic properties and applications to surface treatment Vacuum 71 417-36 [Yurgelenas Y V and Wagner H-E 2006] Yurgelenas Y V and Wagner H-E 2006 A computational model of a barrier discharge in air at atmospheric pressure: the role of residual surface charges in microdischarge formation J. Phys. D 39, pp. 4031-53
[Zhang J-Y and Boyd I W 2000] Zhang J-Y and Boyd I W 2000 Lifetime investigation of excimer UV sources Applied Surface Science 168 pp. 296-99


![Fig. 7 shows the emission spectrum of the MF-DBD between 600 and 900 nm. The Herman IR System (HIRS: N 2 [C" 5 Π u ] → N 2 [A' 5 Σ g + ]) dominates the spectrum with emissions at 703.3 (3-1) nm, 709.4 nm (2-0), 747.2 nm (2-(3-1), 755.8 nm](https://thumb-eu.123doks.com/thumbv2/123doknet/14404301.510510/18.918.118.810.453.801/shows-emission-spectrum-herman-hirs-dominates-spectrum-emissions.webp)