Salim Lahmiri* and Mounir Boukadoum
Automated detection of circinate exudates in
retina digital images using empirical mode
decomposition and the entropy and uniformity
of the intrinsic mode functions
Abstract: This work presents a new automated system to detect circinate exudates in retina digital images. It oper-ates as follows: the true color image is converted to gray levels, and contrast-limited adaptive histogram equaliza-tion (CLAHE) is applied to it before undergoing empirical mode decomposition (EMD) as intrinsic mode functions (IMFs). The entropies and uniformities of the first two IMFs are then computed to form a feature vector that is fed to a support vector machine (SVM) for classification. The experimental results using a set of 45 images (23 normal images and 22 images with circinate exudates taken from the STARE database) and tenfold cross-validation indicate that the proposed approach outperforms previous works found in the literature, with perfect classification. In addi-tion, the image processing time was < 4 min, making the presented circinate exudate detection system fit for use in a clinical environment.
Keywords: automated detection; circinate exudates; clas-sification; empirical mode decomposition; feature extrac-tion; retina.
*Corresponding author: Salim Lahmiri, Department of Computer Science, University of Quebec at Montreal, 201 President-Kennedy, Local PK-4150, Montréal (Québec) H2X 3Y7, Canada,
E-mail: [email protected]
Mounir Boukadoum: Department of Computer Science, University of Quebec at Montreal, 201 President-Kennedy, Local PK-4150, Montréal (Québec) H2X 3Y7, Canada
Introduction
Diabetic retinopathy (DR) is the leading cause of prevent-able blindness in Western countries [7], and circinate exudates are an important sign in early DR. When they occur in the foveal area, the resulting damage results in blindness, and elsewhere, they can create severe vision problems. Hence, the detection of exudates is of primary
importance in early DR diagnosis and treatment. These lipid deposits due to vascular leakage appear in bright yellow in retina digital images, and many automated detection efforts have been devoted to them in the litera-ture, using approaches based on spatial distribution fea-tures [1, 2, 9, 21, 22, 28, 36], morphology analysis [4, 14, 31, 34, 35], or segmentation [5–7, 10, 29, 30] as described below.
Osareh et al. [22] presented an automated system based on color normalization and local contrast enhance-ment, followed by fuzzy C-means clustering for image seg-mentation, and neural network (NN) classification. The neural network achieved 93.4% accuracy, 93% sensitiv-ity, and 94.1% specificity on a dataset of 142 color images. Zhang and Chutatape [36] used local contrast enhance-ment, fuzzy C-means, and SVM to detect and classify bright lesions. The obtained sensitivity and specificity were 88% and 84%, respectively, on a dataset of 30 exudate images. Massey and Hunter [21] employed an algorithm based on the spatial clustering of objects and individual appear-ance to estimate the probability of individual objects being circinate exudate. The purpose of the study was to classify exudates as bright or dark retinal lesions. Their algorithm, called SAGE, achieved an AUC of 0.83 on a training set of 105 exudate images and a testing set of 12. It also led to a lower cross-entropy error (CEE) than NN and SVM for bright and dark lesions alike. Sanchez et al. [28] proposed a general approach based on context-based features, which takes into account the presence of ana-tomical landmarks and spatial relationship between can-didates (exudates) of the same class. Feature selection was carried out by sequential forward floating selection (SFFS) to establish the 30 most discriminative features. Using a dataset of 69 normal and 75 abnormal images, the linear discriminant classifier achieved a free receiver operat-ing characteristic (FROC) curve of 0.945. Agurto et al. [1] presented an algorithm to automatically classify images with pathologic features commonly found in diabetic retinopathy (DR) and age-related macular degeneration (AMD). Their algorithm used the amplitude-modulation
frequency-modulation (AM-FM) to define the features for characterizing normal and pathologic structures based on their pixel intensity, size, and geometry at different spatial and spectral scales. Then, a sequential backward elimi-nation process was employed to measure the contribu-tion of each feature in the improvement of classificacontribu-tion accuracy. Those that did not improve the classification performance were eliminated from the initial feature set. The sequential backward elimination process was applied independently to each of the pathologic features of inter-est to obtain the image representation at each frequency band. Finally, the partial least-squares regression was used to find the relevant features that classify images as normal or abnormal according to ground truth. Using 2247 retinal digital photographs obtained of the eyes of 822 patients, the system achieved an average AUC of 0.89 for detection of DR and of 0.92 for detection of sight-threatening DR (STDR). In a similar work, Agurto et al. [2] employed the AM-FM technique to detect DR in retinal images. They used 120 regions of 40 × 40 pixels contain-ing four types of lesions commonly associated with DR including microaneurysms, exudates, neovascularization on the retina, hemorrhages, normal retinal background, and normal vessels patterns. The texture feature vector contained the cumulative distribution functions of the instantaneous amplitude, the instantaneous frequency magnitude, and the relative instantaneous frequency angle from multiple scales. They concluded that there is a statistical differentiation of normal retinal structures and pathological lesions based on AM-FM features and that their methodology can be used in automatic DR screen-ing. Grisan and Ruggeri [9] presented a system to detect and identify hemorrhagic (dark) lesions in retinal images in two steps. First, a local thresholding is applied to iden-tify dark pixels in the image. Second, a density function is computed to identify cluster of pixels that are considered pixels belonging to candidate lesions. Their approach was tested on six images presenting dark lesions extracted from a database of 60 annotated images. The obtained detection rate was 94% the lesions present in an image. According to the authors, the hit-or-miss situation can compromise the clinical evaluation when an image pre-sents only one lesion.
Flemming et al. [4] used multiscale morphologi-cal algorithms to obtain candidate exudates that were detected with 95.0% sensitivity and specificity using training and testing sets with, respectively, 139 normal images and 300 with exudates. Walter et al. [34] used high gray-level variation and morphological reconstruction techniques to find exudates and their contours. More over, the optic disc was detected with morphology filtering
techniques and the watershed transformation. Based on a small image dataset (15 normal and 15 with exudates), the proposed algorithm achieved a mean prediction accu-racy of 92.4%, with 92.8% mean sensitivity. Sopharak et al. [31] used a set of morphological operators including threshold image using Otsu algorithm and morphological reconstruction by dilation for exudate detection. Based on a data set of 40 retinal images with 20 exudates and 20 normal, the obtained sensitivity and specificity were, respectively, 80% and 99.5%. Jaafar et al. [14] proposed an automated method based on an adaptive threshold and image partitioning. The image was split into a number of homogeneous sub-images, and a coarse segmentation based on the calculation of a local variation for all image pixels was used to outline the boundaries of all exudates. Finally, a morphological operation based on application of a logical intersection operator on the coarse segmen-tation and adaptive threshold results was used for final exudate detection. Using 76 normal and 114 abnormal images, the proposed approach achieved 99.5% accuracy with 91.2% sensitivity and 99.3% specificity. In another study, Welfer et al. [35] presented a methodology based on mathematical morphology to detect exudates in color eye fundus images. Their approach was based on two stages: 1) detection of candidate regions; 2) final exudate detec-tion. The watershed transform was used to identify the optic disk boundary. Then, thresholding was applied to detect the candidate exudates. Finally, they used the fore-ground pixels of the candidate region to define a binary image where only the exudates are in the foreground. The system achieved an average sensitivity of 70.48% and an average specificity of 98.84% using a dataset of 89 images. According to the authors, the main drawback of their approach is that it has low specificity with and misclas-sification rate for images that do not contain exudates. In addition, there are many parameters to be tuned.
Giancardo et al. [7] used features based on color, wavelet decomposition, and automatic lesion segmenta-tion to detect the presence of exudates in 169 randomly selected images from three different databases. Condi-tional entropy was applied to the initial features set to select the most informative ones, and subsequent clas-sification was performed by support vector machines (SVM). Using receiver operating curve (ROC) analysis for performance evaluation, the achieved area under curve (AUC) was between 0.88 and 0.93 depending on the data-base used in the study. Garcia et al. [5, 6] combined global and adaptive histogram thresholding methods to segment regions with hard exudates. Then, a set of 18 visual and statistical exudate features was selected; it included color, shape features, region size, and compactness. The
subsequent validation with a radial basis function NN classifier achieved 92.54% accuracy, with 100% sensitiv-ity and 81.48% specificsensitiv-ity on a dataset of 27 normal and 90 abnormal images. Harangi et al. [10] used grayscale mor-phology to identify possible regions containing exudates. Then, an active contour-based method used to minimize the Chan-Vese energy was applied to extract the borders of the exudates. Fifty shape features were extracted for exudate discrimination, from which the most efficient 18 ones were selected based on the t-statistic. Using 89 color fundus images, a naïve Bayes classifier achieved 75% sensitivity. Soares et al. [30] used a method for exudate segmentation that was based on localization using scale-space extrinsic curvature and selection of the true ones using the local maxima blob response with dynamic threshold. Using a database of 46 abnormal and 43 normal images, the proposed system achieved a sensitivity of 97.07% and specificity of 99.90%. Sinthanayothin et al. [29] proposed an automated system for screening of dia-betic retinopathy. The purpose was to detect retinal lesions defined as hard exudates, hemorrhages and microaneu-rysms. The recursive region growing segmentation (RRGS) algorithm was used for exudate detection. This algorithm identifies similar pixels within a region to determine the location of a boundary. Then, the Moat operator was applied to sharpen the edges of the red lesions against the red-orange background in the segmented image. The algorithm for exudate recognition was applied to 30 retinal images of which 21 contained exudates and nine were normal. In comparison with regions identified by the ophthalmologist, the obtained sensitivity and specificity were 88.5% and 99.7%, respectively.
Recently, the empirical mode decomposition (EMD) [13], an adaptive decomposition technique introduced for signal processing, was successfully applied for retina digital image processing and feature extraction for diag-nosis purpose [18–20]. The EMD is a multiresolution technique introduced by Huang et al. [13] to perform the joint space-spatial frequency decomposition of a signal empirically by successive removal of elemental signals, the intrinsic mode functions or IMF, which represent the oscillatory modes of the original signal going from high- to low-frequency ranges. The obtained IMFs can then serve to represent the signal. The main advantage of using the EMD technique is that the input signal is analyzed without need to convolve it with a basis function as done for Fourier and wavelet transforms. In addition, the method is data-driven and, thus, self-adaptive. These features make EMD suitable for nonlinear and nonstationary data analysis.
As already mentioned, EMD had triggered a certain interest to use it for the automatic diagnosis of retina
digital images. For instance, the authors in [18] employed the discrete wavelet transform (DWT) and EMD to analyze retina images in the frequency domain through statistical features (namely, the mean, standard deviation, smooth-ness, third moment, uniformity, and entropy) that were extracted from the high-frequency components in the ana-lyzed images. The purpose was to distinguish normal from any of various abnormal images. Three different ocular pathologies were considered: circinates, drusens, and microaneurysms (MA). Support vector machines (SVM) with polynomial and radial basis function kernel were used to classify the obtained feature vectors. The experi-mental results using the leave-one-out method (LOOM) for cross-validation showed the efficiency of the EMD-based features over the DWT-based ones. In addition, they indi-cated that a polynomial kernel performed better than the radial basis function kernel in the SVM classifier. In their subsequent work [19], the authors extended their previ-ous work to classify normal versus artery, blots, circinates, drusens, and MA separately. The EMD-based statistical features helped detect circinate images with 95.11% ± 0.04 accuracy. More recently, the authors in [20] ranked sepa-rately the extracted features from IMFs according to the
t-statistic, the entropy statistic, the Battacharrayia
sta-tistic, ROC analysis, and principal component analysis (PCA). The selected features were then fed to support vector machines (SVM) to perform the normal-against-all classification task. Their results were that feature selec-tion based on the Battacharrayia statistic gives the highest classification accuracy when using SVM with polynomial kernel: 96.54% ± 0.03.
In general, all the surveyed works exhibited excellent classification performance, regardless of the approach and features used. However, they fail to achieve perfect recognition accuracy, and they follow rather complex procedures. For instance, morphology-based approaches require detecting the optic disc, watershed transforma-tion, and subsequent morphological reconstruction. As a result, there are many parameters to tune and a large number of features to extract. This type of approach also carries a significant algorithmic complexity. Spatial trans-formation-based approaches require the estimation of probabilities of occurrence, which is difficult to achieve, and start with a large set of features that must be reduced by an appropriate dimensionality reduction technique. Finally, segmentation techniques are usually computa-tionally intensive and require a smoothing and denoising image-preprocessing step in order to optimize the bound-aries separating the regions.
In this work, we present a novel EMD-based approach that is simpler than the ones described in [18–20] and
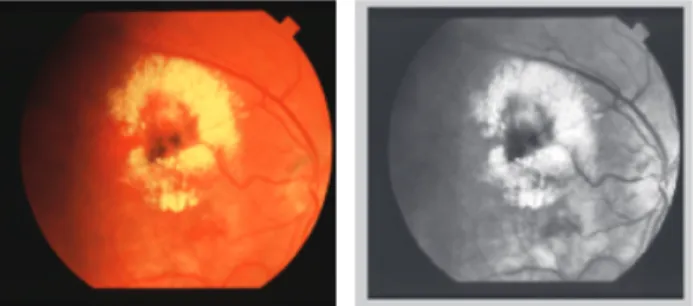
that addresses the specific case of normal versus circinate image detection as done in [4–7, 14, 22, 31, 36]. Our approach consists of a four-step process that starts by converting the digital retina image to grayscale format and applying the contrast-limited adaptive histogram equalization (CLAHE) technique [24] to the result in order enhance contrast while mitigating noise over amplification during the process [3]. Converting the image to grayscale format avoids extracting features from each of the red, green, and blue channels, thus reducing the computation burden. The contrast-lim-ited adaptive histogram equalization technique takes into account local image information to modify pixel bright-ness, with the result of an improved contrast between image components (Figure 2 provides an example). Overall, the first step is relatively simple and low in time consumption.
In the second step, the EMD is applied to the equalized-scale image for decomposition. Only the first two IMFs are determined as they contain most of the high-frequency com-ponents of the decomposed image, and these may efficiently characterize circinate exudates, which have well-defined edges. Higher-order IMFs with lower frequency content, such as the third IMF, are not helpful in this regard [31].
In the third step, the uniformity and entropy of each IMF are computed to form a feature vector; these variables were chosen for their reported effectiveness to charac-terize biological tissue [15, 16]. In our case, as circinates cause the proliferation of fibrous tissue and vitreous hem-orrhagen [11], the structure of the cell components in the biological tissue is deteriorated, with the homogeneity of the biological texture affected. Because of this, the normal retina texture changes substantially and has a much less uniform pixel distribution. The uniformity and entropy statistics are appropriate to capture such variation.
In the final step, the feature vector is fed to support vector machines (SVM) [33] with quadratic kernel to perform classification. With respect to other classifiers, the SVM has the ability to avoid local minima in addition to being accurate [33]. The quadratic kernel is a global kernel that allows distant data points from each other to have also influence on the kernel values [32]. Moreover, it has proven its effectiveness in retina digital image clas-sification [16, 18–20, 24].
The paper is organized as follows. The methodology is presented in the next section. This is followed by simula-tion results and then we conclude in the final secsimula-tion.
Materials and methods
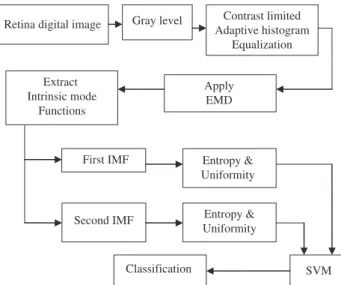
The proposed automated system for circinate exudate detection in retina digital images is presented in Figure 1.
Retina digital image Adaptive histogramContrast limited Equalization Apply EMD Extract Intrinsic mode Functions SVM First IMF Gray level Classification
Second IMF Entropy & Uniformity Entropy & Uniformity
Figure 1 Block diagram of the proposed circinate exudates detec-tion system.
As mentioned above, the design of the classification system consists of four steps:
1. The original retina digital image is converted to grayscale format before filtering with contrast-limited adaptive histogram equalization technique.
2. The first and second IMFs are extracted by EMD. 3. The entropy and uniformity statistics are computed
from each extracted IMF to form a feature vector of four elements.
4. The feature vector serves as input for the SVM to classify normal image versus circinate exudates image.
Contrast-limited adaptive
histogram equalization
Basic histogram equalization is a technique that spreads out the distribution of pixel intensities within an image, with enhanced contrast as a result. The stretching is typi-cally accomplished by replacing each normalized pixel intensity value by its cumulative distribution in the original histogram, with the result of progressively increasing the difference between adjacent pixel intensities and of a wider distribution range between the brightest and darkest values. For an image I of size n × n and a histogram h() defined by:
2
( ) ni , [0, 1]
h i i n
= ∈ (1)
where i is a normalized pixel intensity, ni the number of pixel with intensity i, and n2 the total number of pixels in
Figure 2 True color digital retina image with circinate exudates before (left) and after applying CLAHE to its grayscale version (right).
the image, the histogram equalization algorithm creates a new image where each initial intensity i becomes i′ such that: 0 ( ) i k i h k = = ′
∑
(2)The above algorithm is efficient when the pixel distri-bution is homogeneous throughout the image; else, adap-tive histogram equalization (AHE) offers a more efficient mapping that considers contextual pixel regions instead of the whole image, thus allowing sets of pixels with low contrast, but different ranges of intensity distributions, to become simultaneously enhanced for visibility [25, 37]. However, this comes at a high computational cost as a region histogram must be computed for each pixel in the image. One approach to lower the computational burden is to partition the image into a grid of contextual regions and use the mappings for the pixels located at the cell centers to interpolate those for the remaining pixels [23]. This amounts to ranking each pixel by its bright-ness in comparison to the other pixels in its contextual region and assigning a new brightness to it in proportion to its rank [23, 26]. Unfortunately, AHE worsens also the effect of noise when small contextual regions are used. Contrast-limited AHE minimizes the problem by limiting the dynamic range of the contrast enhancement process by clipping the height of the local histogram and using a maximum contrast enhancement factor [23] in the AHE algorithm.
The size of the partition grid (and subsequently the number of pixels in a contextual region) has an impact on the contrast enhancement outcome: small sizes (e.g., 8 × 8) lead to enhanced contrast as opposed to large ones. We used the same grid size as that of Ramlugun et al. [26], 8 × 8, and the clip limit parameter was set to 0.01 in the CLAHE algorithm. Figure 2 provides an example of digital retina image with circinate exudates and the result of applying CLAHE to its grayscale representation.
Empirical mode decomposition
The EMD [13] decomposes a signal into a sum of intrinsic mode functions or IMFs, each one satisfying two proper-ties: (1) It has the same numbers of zero crossings and extrema, and (2) it is symmetric with respect to its local mean. The IMFs span a scale going from fine to coarse and are determined by an iterative procedure, the sifting algorithm. For a one-dimensional signal s(t), the sifting process is performed as follows [13]:
1. Determination of all the local maxima Mi, i = 1, 2, …,
and minima mk, k = 1, 2, …, in s(t).;
2. Computation by interpolation – for instance, a cubic spline – of the upper and lower envelopes of the signal: M(t) = fM(Mi, t) and m(t) = fm(mi, t);
3. Computation of the detail signal d(t) = s(t)-μ(t), where μ(t) = (M(t)+m(t))/2 is the average of the upper and lower envelopes;
4. If d(t) meets the properties of an IMF regarding symmetry and the number of extrema:
a. set the ith IMF as IMF(t) = d(t)
b. replace s(t) with the residual r(t) = s(t)-IMF(t);
else, set s(t) = d(t);
5. Iterate through steps 1–5 until residual r(t) satisfies a given stopping criterion.
In practice, the stopping criterion for the sifting process consists of bounding the standard deviation (SD) calcu-lated from two successive sifting results [13]:
2 -1 0 2 -1 0 | ( )- ( )| ( ) ( ) T k k t T k t d t d t SD k d t ε = = =
∑
<∑
(3)where t is the time index, T is the length of s(t), k the index of the kth detail signal, and e is a given threshold. Alter-natively, the sifting process stops when the residue func-tion becomes monotonic or has one extrema so that no more IMF can be extracted. In the end, s(t) is expressed as follows: 1 ( ) N j( ) N( ) j s t IMF t +r t = =
∑
(4)where N is the number of IMFs, which are nearly ortho-gonal to each other and have nearly zero means, and rn(t) is the final residue, which indicates the low frequency trend of s(t).
The two-dimensional EMD follows the same process as the one-dimensional, and the two-dimensional IMFs
are defined in a similar manner. In our study, we used a one-dimensional decomposition for computational effi-ciency. For an image of n × n pixels, the corresponding one-dimensional signal image is a vector with n2
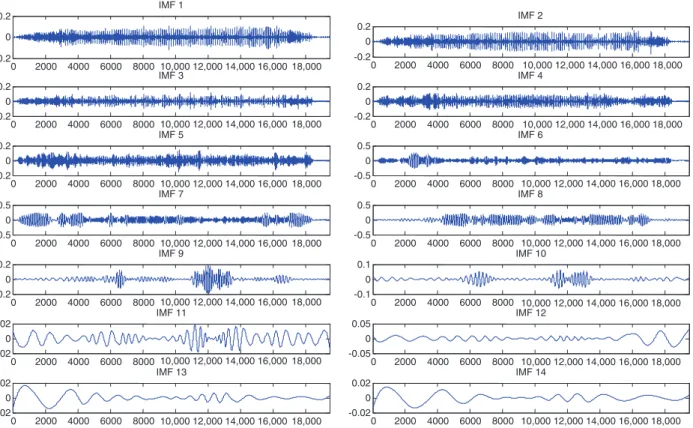
compo-nents resulting from concatenating the rows of the image starting from the top left corner. Then, the EMD algo-rithm is applied to this vector, and the processed image is reconstructed from it. To perform the EMD, we used the algorithm proposed by Rato et al. [27], which minimizes computation errors with four modifications of the origi-nal EMD algorithm. Figure 3 shows an example of normal retina color image, the result of applying CLAHE to its grayscale version, and the final one-dimensional signal
(1D) of the latter. Finally, Figure 4 shows the first 14 IMFs extracted from the same 1D signal.
Feature extraction and
classification
Feature extraction
Two statistical textural features, entropy and uniformity, are extracted from the first and second intrinsic mode
0 0.2 0.4 0.6 0.8 1 1.2 1.4 1.6 1.8 2 x 10⁴ 0 0.1 0.2 0.3 0.4 0.5 0.6 0.7 0.8
Figure 3 Normal retina color image (left), after applying CLAHE (middle), and CLAHE 1D signal representation (right).
0 2000 4000 6000 8000 10,000 12,000 14,000 16,000 18,000 10,000 12,000 14,000 16,000 18,000 10,000 12,000 14,000 16,000 18,000 10,000 12,000 14,000 16,000 18,000 10,000 12,000 14,000 16,000 18,000 10,000 12,000 14,000 16,000 18,000 10,000 12,000 14,000 16,000 18,000 -0.2 0 0.2 IMF 1 0 2000 4000 6000 8000 10,000 12,000 14,000 16,000 18,000 -0.2 0 0.2 IMF 2 0 2000 4000 6000 8000 -0.2 0 0.2 IMF 3 0 2000 4000 6000 8000 10,000 12,000 14,000 16,000 18,000 -0.2 0 0.2 IMF 4 0 2000 4000 6000 8000 -0.2 0 0.2 IMF 5 0 2000 4000 6000 8000 -0.5 0 0.5 IMF 6 0 2000 4000 6000 8000 -0.5 0 0.5 IMF 7 0 2000 4000 6000 8000 -0.5 0 0.5 IMF 8 0 2000 4000 6000 8000 -0.2 0 0.2 IMF 9 0 2000 4000 6000 8000 -0.1 0 0.1 IMF 10 0 2000 4000 6000 8000 -0.02 0 0.02 IMF 11 0 2000 4000 6000 8000 -0.05 0 0.05 IMF 12 0 2000 4000 6000 8000 -0.02 0 0.02 IMF 13 0 2000 4000 6000 8000 10,000 12,000 14,000 16,000 18,000 10,000 12,000 14,000 16,000 18,000 10,000 12,000 14,000 16,000 18,000 10,000 12,000 14,000 16,000 18,000 10,000 12,000 14,000 16,000 18,000 -0.02 0 0.02 IMF 14
functions. Higher intrinsic mode functions, which contain lower frequency content, were ignored since we made the hypothesis that only the high-frequency elemental signals capture sudden and distinctive changes in the biologi-cal tissue. Initially, we started with a set of features that included the mean, standard deviation, kurtosis, third moment, uniformity, and entropy, but we obtained poorer classification results than when using the last two vari-ables alone. This might be due to an antagonistic interac-tion between predictive variables where general statistics such as the removed features are detrimental to the pre-dictive power of more focused “structural” statistics such as entropy and uniformity.
Entropy and uniformity have already been shown to be effective at distinguishing different types of biological tissues [17]. The former measures random variability and, thus, can help detect variations and discontinuities in the signal such as sudden changes in the retina biological tissue caused by lipid deposits. The latter is an indicator of the regularity of a signal distribution. Therefore, it is suitable to measure the degree of overall homogeneity in retina biological tissue. Together, entropy and uniformity may capture the abrupt and frequent image contrast vari-ations that are observed in the presence of circinate exu-dates. They are defined by [8]:
-1 2 0 -L ( )log ( )i i i Entropy p z p z = =
∑
(5) -1 2 0 ( ) L i i Uniformity p z = =∑
(6)where z is a random variable for intensity, p is the prob-ability density of the ith pixel in the histogram, and L is the total number of intensity levels.
Feature vector classification
In order to solve a binary classification problem in which the output y∈{+1,-1}, the SVM [33] implements a hyper-plane w.Φ(x)+b = 0 to separate the data from the classes +1 and -1 with a maximal margin. Here, x denotes the input feature vector, w is a weight vector, b is a bias term, and Φ is a function that maps the feature data to a higher dimen-sion space where it is linearly separable. The decidimen-sion frontier between the two classes is determined with the Lagrange multiplier optimization technique. It is given by:
( ) ( ) ( )
i
i i i
x
f x =
∑
yα Φ x ⋅Φ x b+ (7)where each αi is a Lagrange coefficient to be determined from the data. In practice, only the scalar product of Φ by itself is needed n equation 6. Hence, it is not necessary to know Φ if a kernel function provides the result. Then, the optimal decision separating function is:
1 ( , ) n i i i i y sign y K x x bα = = +
∑
(8)where K(xi, x) is a kernel that replaces the product
Φ(xi)‧Φ(x). In this study, a polynomial kernel was adopted as its order is only parameter to set. We tried orders from 2 to 4 and found that they provide similar results. Therefore, we chose the second-order kernel for compu-tational efficiency. The second-order kernel is defined as follows:
2
( , ) ((i i ) 1)
K x x = x x⋅ + (9)
Experimental results and
performance evaluation
We evaluated the performance of the proposed circinate exudate detection system with a set of 23 normal images and 22 images with circinate exudates taken from STARE [12], a publicly available dataset. All images are of size 150 × 130 pixels. The choice of just a subset of STARE was motivated by the fact that this database contains unequal numbers of image types, which may lead to category overfitting and a biased statistical significance of the classifier’s results; using equal partitions of normal and abnormal images avoids these problems. The choice of a balanced dataset is also made in [28, 30, 31, 34], in contra-diction to other works such as [5, 6], where 27 normal and 90 abnormal images were considered, and [14], where 76 normal and 114 abnormal images were used. Such unbal-anced datasets question the relative robustness of the obtained results.
Figures 5 and 6 exhibit example mesh images of the first and second intrinsic mode functions related to normal and circinate exudates images, respectively. The two abnormal IMFs clearly show more high-frequency content than the normal ones, hence, corroborating the hypothesis that the components (intrinsic mode func-tions) from which the entropy and uniformity statistics are computed are different among normal and abnormal images.
Using tenfold cross-validation, the results were that the proposed circinate exudate detection system achieves
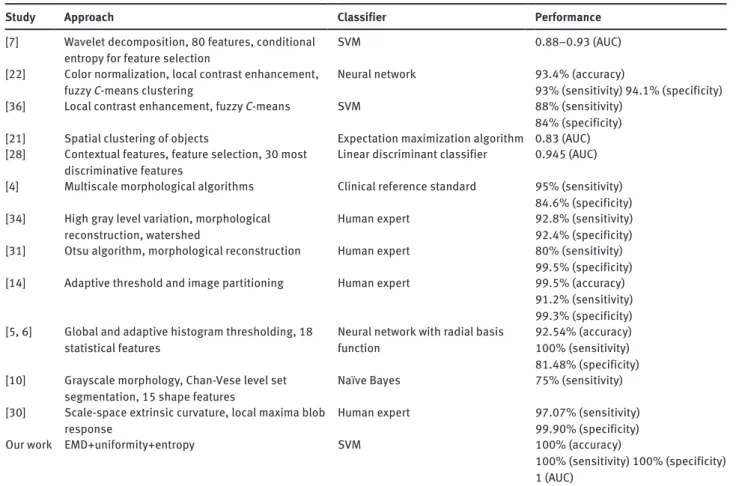
Table 1 Comparison with previous studies.
Study Approach Classifier Performance
[7] Wavelet decomposition, 80 features, conditional
entropy for feature selection SVM 0.88–0.93 (AUC)
[22] Color normalization, local contrast enhancement,
fuzzy C-means clustering Neural network 93.4% (accuracy)93% (sensitivity) 94.1% (specificity) [36] Local contrast enhancement, fuzzy C-means SVM 88% (sensitivity)
84% (specificity) [21] Spatial clustering of objects Expectation maximization algorithm 0.83 (AUC) [28] Contextual features, feature selection, 30 most
discriminative features Linear discriminant classifier 0.945 (AUC) [4] Multiscale morphological algorithms Clinical reference standard 95% (sensitivity)
84.6% (specificity) [34] High gray level variation, morphological
reconstruction, watershed Human expert 92.8% (sensitivity)92.4% (specificity) [31] Otsu algorithm, morphological reconstruction Human expert 80% (sensitivity)
99.5% (specificity) [14] Adaptive threshold and image partitioning Human expert 99.5% (accuracy)
91.2% (sensitivity) 99.3% (specificity) [5, 6] Global and adaptive histogram thresholding, 18
statistical features Neural network with radial basis function 92.54% (accuracy)100% (sensitivity) 81.48% (specificity) [10] Grayscale morphology, Chan-Vese level set
segmentation, 15 shape features Naïve Bayes 75% (sensitivity) [30] Scale-space extrinsic curvature, local maxima blob
response Human expert 97.07% (sensitivity)99.90% (specificity)
Our work EMD+uniformity+entropy SVM 100% (accuracy)
100% (sensitivity) 100% (specificity) 1 (AUC)
Figure 6 Circinate exudates: first IMF (left) and second IMF (right). perfect classification accuracy. It is also seen from Table 1 that it outperforms previous comparable studies, which considered only the problem of classification of normal retina images against exudate ones as we did1 [4, 5, 10,
21, 22, 31, 34, 36]. Furthermore, the system presented here uses only two features to distinguish between healthy retina digital images and unhealthy ones, in contrast to [7] with 80 features, [5] and [6] with 18, [28] with 13, and [10] with 15. It appears then that our retina diagnosis system is simpler to implement.
On the negative side, the obtained performance came at the cost of substantially longer processing time in com-parison to other works, due mainly to the envelope inter-polation stage in the EMD algorithm. The simulation of EMD with Matlab© R2009a running on a 1.5-GHz Core2 Duo processor, took up to 33 min for normal images and up to 80 min for abnormal images. However, this processing time went down to 193 s on a 3.30-GHz Core™ i5-2500 CPU. Thus, with fast CPU such as the ones used in recent multi-core processing stations, the presented approach for clas-sification of normal against retina with circinate exudates may be suitable for near real-time machine diagnosis. 1 In [5–7, 10, 30], the main purpose was the segmentation of abnor-mal images affected with exudates, and the morphology-based stud-ies [4, 14, 31, 34] were evaluated by human experts or by using clini-cal standards.
Conclusion
This paper described an automated processing system for the detection of circinate exudates in retina digital images. The empirical mode decomposition is applied to an image to obtain the first two intrinsic mode functions, and their entropy and uniformity statistics are computed to form a four-component feature vector that feeds a support vector machine with quadratic kernel. Using ten-fold cross-vali-dation, the system classified correctly all the samples in the STARE database that we used, thereby, outperform-ing the previous systems described in the literature. The simplicity and relatively fast image processing of the proposed automated circinate exudate detection system make it promising for clinical applications.
The empirical mode decomposition processing time depends on the type of retina image. In particular, an image with circinate exudates takes substantially more processing than a normal retina image. One may think of reducing the processing time by improving the algorithm of the empirical mode decomposition, particularly the envelope construction step, or by using faster processors than the ones used in this work. Future work should also consider a larger base of retina images to check the consist-ency of the presented circinate exudates detection system. Received April 19, 2013; accepted February 11, 2014; online first March 11, 2014
References
[1] Agurto C, Barriga ES, Murray V, et al. Automatic detection of diabetic retinopathy and age-related macular degeneration in digital fundus images. Invest Ophthalmol Vis Sci 2011; 52: 5862–5871.
[2] Agurto C, Murray V, Barriga E, et al. Multiscale AM-FM methods for diabetic retinopathy lesion detection. IEEE Trans Med Imaging 2010; 29: 502–512.
[3] Anzalone A, Bizzari F, Parodi M, Storace M. A modular supervised algorithm for vessel segmentation in red-free retinal images. Comput Biol Med 2008; 38: 913–922. [4] Fleming DA, Philip S, Goatman AK, Williams JG, Olson AJ,
Sharp FP. Automated detection of exudates for diabetic retinopathy screening. Phys Med Biol 2007; 52: 7385–7396. [5] Garcia M, Hornero R, Sanchez CI, Lopez MI, Diez A. Feature
extraction and selection for the automatic detection of hard exudates in retinal images. IEEE Eng Med Biol Conf 2007: 4969–4972.
[6] García M, Sánchez CI, López MI, Abásolo D, Hornero R. Neural network based detection of hard exudates in retinal images. Comput Methods Programs Biomed 2009; 93: 9–19.
[7] Giancardo L, Meriaudeau F, Karnowski TP, et al. Exudate-based diabetic macular edema detection in fundus images using publicly available datasets. Med Image Anal 2012; 16: 216–226. [8] Gonzalez RC, Woods RE, Eddins SL. Digital image processing
using MATLAB. Upper Saddle River, NJ: Prentice Hall 2004. [9] Grisan E, Ruggeri A. A hierarchical Bayesian classification for
non-vascular lesions detection in fundus images. EMBEC′05 – IFMBE Proc. Series, Vol. 11, IFMBE, 2005; 6735–6738.
[10] Harangi B, Lazar I, Hajdu A. Automatic exudate detection using active contour model and regionwise classification. IEEE Eng Med Biol Conf 2012; 5951–5954.
[11] http://medical-dictionary.thefreedictionary.com/ circinate+retinopathy.
[12] http://www.ces.clmson.edu/~ahoover/stare/. [13] Huang NE, Shen Z, Long SR, et al. The empirical mode
decomposition and the Hilbert spectrum for non-linear and non-stationary time series analysis. Proc R Soc, London 1998; A 454; 903–995.
[14] Jaafar HF, Nandi AK, Al-Nuaimy W. Detection of exudates in retinal images using a pure splitting technique. IEEE Eng Med Biol Conf 2010; 6745–6748.
[15] Lahmiri S, Boukadoum M. Hybrid discrete wavelet transform and Gabor filter banks processing for mammogram features extraction. IEEE NEWCAS 2011; 53–56.
[16] Lahmiri S, Boukadoum M. Hybrid discrete wavelet transform and Gabor filter banks processing for features extraction from biomedical images. J Biomed Eng 2013; 2013: Article ID 104684, 13 pages. Available at: http://dx.doi.org/10.1155/2013/104684. [17] Lahmiri S, Boukadoum M. Hybrid discrete wavelet transform
and Gabor filter banks processing for features extraction from biomedical images. J Med Eng 2013; Article ID 104684: 1–13. [18] Lahmiri S, Gargour C, Gabrea M. An empirical mode
decomposition approach for automatic diagnosis of retina digital images. IEEE Canadian Conference on Electrical and Computer Engineering 2012; 1–4.
[19] Lahmiri S, Gargour C, Gabrea M. An EMD-SVM screening system for retina digital images: The effect of kernels and parameters. IEEE Information Sciences Signal Processing and their Applications 2012; 912–917.
[20] Lahmiri S, Gargour C, Gabrea M. Statistical features selection and pathologies detection in retina digital images. IEEE Industrial Electronics Conference 2012; 1585–1590.
[21] Massey EM, Hunter A. Augmenting the classification of retinal lesions using spatial distribution. IEEE Int Conf Eng Med Biol Soc 2011; 3967–3970.
[22] Osareh A, Mirmehdi M, Thomas B, Markham R. Automated identification of diabetic retinal exudates in digital colour images. Br J Ophthalmol 2003; 87: 1220–1223.
[23] Pizer SM, Amburn EP, Austin JD, et al. Adaptive histogram equalization and its variations. Comput Vis Graph Image Process 1987; 39: 355–368.
[24] Pizer SM, Amburn EP, Austin JD, et al. Adaptive histogram equalization and its variations. J Comput Vis Graph Image Process 1987; 39: 355–368.
[25] Pizer SM, Zimmerman JB, Staab E. Adaptive grey level assignment in CT scan display. J Comput Assist Tomogr 1984; 8:
300–305.
[26] Ramlugun GS, Nagarajan VK, Chakraborty C. Small retinal vessels extraction towards proliferative diabetic retinopathy screening. Exp Syst Appl 2012; 39: 1141–1146.
[27] Rato RT, Ortigueira MD, Batista AG. On the HHT: its problems and some solutions. Mech Syst Signal Process 2008; 22: 374–1394.
[28] Sánchez CI, Niemeijer M, Suttorp Schulten MSA, Abràmoff M, van Ginneken B. Improving hard exudate detection in retinal images through a combination of local and contextual information. IEEE International Symposium Biomedical Imaging: From Nano to Macro 2010; 5–8.
[29] Sinthanayothin C, Boyce JF, Williamson TH, et al. Automated detection of diabetic retinopathy on digital fundus images. Diabet Med 2002; 19: 105–112.
[30] Soares I, Castelo-Branco M, Pinheiro AMG. Curvature detection and segmentation of retinal exudates. IEEE International Symposium on Biomedical Imaging 2012; 1719–1722. [31] Sopharak A, Uyyanonvara B, Barman S, Williamson TH.
Automatic detection of diabetic retinopathy exudates from non-dilated retinal images using mathematical morphology methods. Comput Med Imaging Graph 2008; 32: 720–727. [32] Sun J, Wen D, Li G. An efficient guide stars classification
algorithm via support vector machines. IEEE International Conference on Intelligent Computation Technology and Automation 2009; 148–152.
[33] Vapnik VN. The nature of statistical learning theory. Berlin, Germany: Springer-Verlag, 1995.
[34] Walter T, Klein J-C, Massin P, Erginay A. A contribution of image processing to the diagnosis of diabetic retinopathy-detection of exudates in color fundus images of the human retina. IEEE Trans Med Imaging 2002; 21: 1236–1243.
[35] Welfer D, Scharcanski J, Marinho DR. A coarse-to-fine strategy for automatically detecting exudates in color eye fundus images. Comput Med Imaging Graph 2010; 34: 228–235. [36] Zhang X, Chutatape O. Detection and classification of bright
lesions in colour fundus images. IEEE Int Conf Image Proc 2004; 139–142.
[37] Zimmerman JB, Pizer SM, Staab EV, Perry JR, McCartney W, Brenton BC. An evaluation of the effectiveness of adaptive histogram equalization for contrast enhancement. IEEE Trans Med Imaging 1988; 7: 304–312.