Publisher’s version / Version de l'éditeur:
Cold Regions Science and Technology, 6, 1, pp. 61-72, 1982
READ THESE TERMS AND CONDITIONS CAREFULLY BEFORE USING THIS WEBSITE. https://nrc-publications.canada.ca/eng/copyright
Vous avez des questions? Nous pouvons vous aider. Pour communiquer directement avec un auteur, consultez la première page de la revue dans laquelle son article a été publié afin de trouver ses coordonnées. Si vous n’arrivez pas à les repérer, communiquez avec nous à [email protected].
Questions? Contact the NRC Publications Archive team at
[email protected]. If you wish to email the authors directly, please see the first page of the publication for their contact information.
NRC Publications Archive
Archives des publications du CNRC
This publication could be one of several versions: author’s original, accepted manuscript or the publisher’s version. / La version de cette publication peut être l’une des suivantes : la version prépublication de l’auteur, la version acceptée du manuscrit ou la version de l’éditeur.
Access and use of this website and the material on it are subject to the Terms and Conditions set forth at
Model tests of ice forces on fixed and oscillating cones
Frederking, R. M. W.; Schwarz, J.
https://publications-cnrc.canada.ca/fra/droits
L’accès à ce site Web et l’utilisation de son contenu sont assujettis aux conditions présentées dans le site LISEZ CES CONDITIONS ATTENTIVEMENT AVANT D’UTILISER CE SITE WEB.
NRC Publications Record / Notice d'Archives des publications de CNRC:
https://nrc-publications.canada.ca/eng/view/object/?id=5a6313b9-c630-451a-83ef-1bc671b740e7 https://publications-cnrc.canada.ca/fra/voir/objet/?id=5a6313b9-c630-451a-83ef-1bc671b740e7I
Sar
National Research
Conseil national
Tm
N21d
II
*
Council Canada
de recherches Canada
MODEL TESTS OF ICE FORCES ON FIXED AND OSCILLATING CONES by R. Frederking and J. Schwarz
Reprinted from
Journal of Cold Regions Science and Technology Vol. 6, 1982
p. 61
-
72DBR Paper No. 1058
Division of Building Research
Price $1.50 OTTAWA
82- 11-
05
B ~ B L ~ O T H $ Q U E
i I'Rech.
Bttim. . . - I NRCC 20703SOMMAIRE
Une s g r i e d ' e s s a i s o n t 'et'e effectu'es s u r d e s c h e s p o i n t a n t v e r s l e bas dans d e l a g l a c e peu sal'ee. Une comparaison a v e c d e s r ' e s u l t a t s t i r ' e s d e l a documentation a montrd que l e c h e e s t moins s o l l i c i t d l o r s q u ' i l p o i n t e v e r s l e bas. Des c a n e s f i x e s a v e c d e s a n g l e s d e 15, 30, 45 e t 60 degrds au sommet o n t Q t 6 e s s a y e s d a n s d e l a g l a c e d e 50 mm d l C p a i s s e u r e t d e 60 kPa de r ' e s i s t a n c e 5 l a f l e x i o n
2
d e s v i t e s s e s a l l a n t d e 0,012
0 , 5 m / s . Les e f f e t s d e v a r i a t i o n s d ' C p a i s s e u r e t d e r ' e s i s t a n c eb
l a f l e x i o n o n t a u s s i 'et6 6 t u d i g s . Une v a r i a t i o n d ' g p a i s s e u r d e l a g l a c e i n f l u e davantage s u r l e s f o r c e s v e r t i c a l e s que s u r l e s f o r c e s h o r i z o n t a l e s . Une d i m i n u t i o n d e l a r ' e s i s t a n c e2 l a f l e x i o n e n t r a 2 n e
une d i m i n u t i o n d e s f o r c e s v e r t i c a l e s e t h o r i z o n t a l e s . Deux s ' e r i e s d ' e s s a i s o n t bt'e ef fectu'es a v e c un cane d e 45 degr'es plac'e d e t e l l e s o r t e q u ' i l p u i s s e o s c i l l e r . Des r S d u c t i o n s a l l a n t jusqu'aux deuxt i e r s
d e s f o r c e s h o r i z o n t a l e s o n t dt'e observges.Cold Regions Science and Technology, 6 (1982) 61 -72
Elsevier Scientific Publishing Company, Amsterdam - Printed in The Netherlands
MODEL TESTS OF ICE FORCES ON FIXED AND OSCILLATING CONES* R. Frederking
Division of Building Research, National Research Council of Canada, Ottawa, Ontario (Canada) and J. Schwarz
Hamburgische Schiffbau- Versuchsanstalt, Hamburg IF. R. G.)
(Received November 25.1981; accepted in revised form March 10, 1982)
ABSTRACT
A series of model tests has been carried out on downward breaking conical structures using low salinity model ice. Comparison with informa- tion in the literature showed that a downward break- ing cone experiences lower ice forces than an up- ward breaking cone. Fixed cones of angles of 15, 30, 45 and 6 0 deg were tested in 50-mm-thick ice o f 60 kPa flexural strength at velocities ranging from 0.01 t o 0.5 m/s. The effects of thickness and flexural strength variations were also investigated. Horizontal forces were observed to increase with increasing velocity. Ice thickness variation was observed to have a stronger influence on the vertical forces than on the horizontal forces. Vertical and horizontal forces showed a decrease with decreasing flexural strength.
Two test series were run with the 45 deg conical structure arranged so that it oscillated. Horizontal force reductions of up t o two thirds were observed.
INTRODUCTION
Because of increasing world demand for hydro- carbons and other minerals, polar offshore regions characterized by severe ice conditions are coming under increasing scrutiny as potential sources. In
than 20 m) of the Canadian Beaufort Sea, man- made islands have been successfully used for ex- ploratory drilling. Ice-breaker supported drillships have also operated for almost five months of the year in deep-water areas of the same region. Pro- duction from these and other regions with even more severe ice conditions will, however, require new technology, and considerable effort is there- fore being devoted to the development and eval- uation of new concepts for offshore structures that will operate safely and economically under severe conditions (Jazrawi and Khanna 1978, Ger- wick and Jahns 1979). One such concept is a down- ward cone, which could be fitted to a cylindrical structure and operated in either a fixed or an os- cillating mode. A downward breaking conical struc- ture could be either bottom founded or floating, but would have a more immediate application in a floating mode. This paper will report on model investigations of the effects of ice thickness, cone geometry, velocity and ice strength on forces gen- erated on fixed and oscillating cones. Theoretical predictions and other test data in the literature will be discussed.
ICE TEST FACILITY
certain areas, systems for offshore drilling are being
Model tests were carried out in the Hamburg evolved; for example, in the shallow waters (less
Ice Model Basin (HSVA). It is a three-part basin,
*Extended version of paper presented to INTERMARITEC i.e. trim tank, freezing tank, and tank-
'80, 24-25 September 1980, Hamburg, Germany. The freezing or actual ice testing tank is 30-m long,
Fig. 1. Vertical (a) and horizontal (b) thin sections of low salinity model ice (grid spacing 10 mm).
6-m wide and 1.2-m deep. A motor-driven carriage provides a speed range from 0 to 2 mls. The air temperature can be set at any value between 0 and - 2 0 " ~ and is kept constant within 1°C. Owing to the very small air motion during the freezing period, ice thickness is uniform over the entire
tank area to within f 1 mm. In order to reduce the
crystal size and obtain ice of uniform crystal struc- ture and strength a water-spray method is utilized: water of almost 0°C is sprayed at 400 kPa into the -10°C cold air above the testing tank. The drop- lets form ice crystals that settle on the water sur- face, initiating the formation of fine-grained colum-
nar ice similar in structure to natural sea ice. Figure
1 illustrates the grain structure of the ice.
It has been shown that not only Froude simil- itude but also Cauchy similitude must be satisfied (Schwarz 1978), so that it is necessary to main- tain the same ratio of elastic modulus to flexural strength in the model ice as in nature. The ratio
of elastic modulus to strengh (Elo) is 2000-5000
for natural sea ice. The modeling technique uses
low salinity ice (grown from a 6 NaCl solution)
and accomplishes strength reduction by increasing the ice temperature and with it the brine volume prior t o testing (Schwarz 1975). The brine volume
increase also reduces the elastic modulus by an amount such that E / o ratios in the range 1700-2000 can be maintained. When the ice strength is reduced too far, say less than 6 0 kPa, plastic deformation becomes significant, contributing substantially to the energy required to break the ice cover.
The breaking strength of the ice was measured before and after each test run using in situ can- tilever beams. Breaking force was determined with a spring gauge, the dimensions of the broken beam measured, and strength calculated from the fol- lowing equation:
where P is breaking force, 1 is beam length (usually 0.4 m), b is beam width (usually 0.1 m) and h is ice thickness. Because of anisotropy, geometry considerations and non-homogeneity, the equation is not an exact representation of bending strength, but it is an accepted strength index (IAHR 1981). Flexural strength was typically 6 0 kPa at a loading stress rate of about 50 kPa/s.
The coefficient of friction was measured by drawing an ice block over a representative surface of the structure and found to be about 0.1. Den- sity of the ice was about 940 kg/m3.
FIXED CONE TESTS
Test procedure
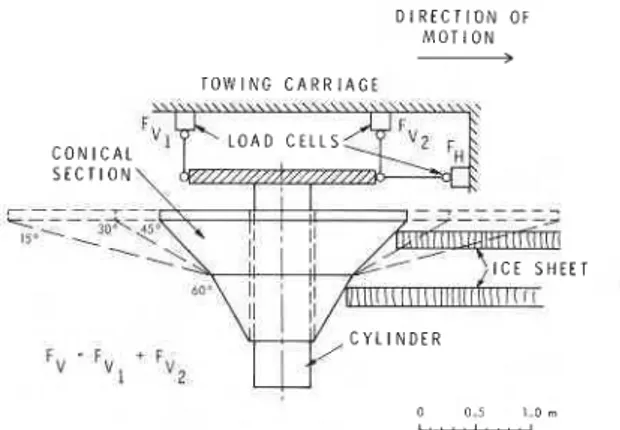
The test set-up for the futed conical structure is illustrated schematically in Fig. 2. The model was fabricated of steel plate and painted with a normal acrylic paint. Two conical sections, the lower portion 60 deg to the horizontal and the upper portion 45 deg, were fitted over a 0.5-m- diameter cylinder. To investigate the effect of var- ious cone angles, two auxiliary conical sections of 15 and 30 deg (shown with dashed lines in Fig. 2) could be bolted to the upper portion of the model structure. It was possible to raise the en- tire structure so that the ice impinged on the 60 deg section. The actual waterline diameters were 1.75, 1.5, 1.2 and 1.0 m, respectively, for cone angles of 15, 30, 45 and 6 0 deg. Also shown sche- matically are the load cells used to measure ver-
D I R E C T I O N O F M O T I O N A T O W I N G C A R R I A G E
Fig. 2. Schematic of fixed conical model structure.
tical and horizontal forces. The load measuring system had the additional feature of being able to resolve the point of action of the resultant ice force. In all tests the fixed conical structures were rigidly attached t o the towing carriage.
Three test series were run with the fixed conical structure. The main series comprised tests for cone angles of 15, 30, 35 and 6 0 deg in 50-mm-thick ice of 60-kF'a flexural strength at velocities ranging from 0.01 to 0.50 m/s. For the 45-deg cone, two special test series were carried out: one in which ice thickness was varied from 35 to 65 mm, and another in which flexural strength was varied from 50 to 85 kPa.
Test results
Continuous records of load versus time were made for all tests, from which both mean and mean peak values were determined. Test results are sum- marized in Tables l(a), I(b) and l(c). More de- tailed results can be found in Schwarz et al. (1978). For the purposes of this paper, the emphasis in the presentation of results is on mean ice forces. The curves drawn on Figs. 3-6 represent a math- ematical smoothing of all the test data and are shown to indicate trends.
Velocity effects
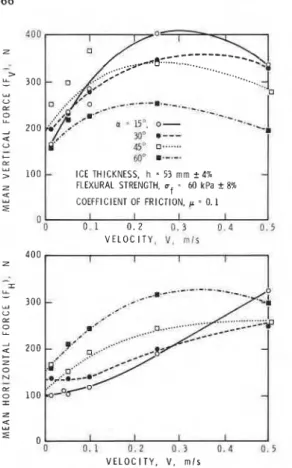
Test results of the effect of velocity on average ice forces for fixed conical structures are presented in Fig. 3. The vertical forces first increased rapidly and then decreased with increasing velocity, where- as the horizontal forces increased, although not
TABLE l(a)
Ice force as a function of velocity for various cone angles, a
Test Velocity Mean force (N) Mean peak force (N) conditions (m/s)
Vertical Horizontal Vertical Horizontal
TABLE l(b)
Ice force as a function of ice thickness, h , for a 45" conical structure Test Velocity Mean force (N) Mean peak force (N) conditions (m/s)
TABLE l(c)
Ice force as a function of flexural strength at a velocity of 0.1 m/s
Test Flexural Mean force (N) Mean peak force (N)
conditions strength
(kPa) Vertical Horizontal Vertical Horizontal
quite so rapidly, with increasing velocity. The one exception to this pattern was the horizontal force for the 60 deg cone, which showed a decrease at higher velocities. The relation between the vertical and horizontal forces is illustrated in abbreviated form in Table 2. For the 15, 30 and 45-deg cones, the vertical forces were greater than the horizontal forces, the maximum difference being at veloci- ties in the range of 0.2 to 0.3 m/s. This difference tends to decrease with increasing cone angle. For the 60-deg cone the horizontal forces were greater.
Cone angle effects
The results, which are basically the same as those shown in Fig. 3, have been plotted in a different format in Fig. 4 in order to illustrate more clearly the influence of cone angle on ice forces in the velocity range 0.01 to 0.20 m/s. The horizontal forces show a minimum between 15 and 3 0 deg, and then increase with increasing cone angle. The vertical forces, on the other hand, show a maxi- mum between 30 and 40 deg and then a general decrease with increasing cone angle. The dashed lines indicate the extrapolation of the vertical forces
TABLE 2
Ratio of average vertical to average horizontal force Velocity Cone angle
(mls)
15" 30" 45" 60"
to zero for a vertical structure, a = 9 0 deg. Sim- ilar general trends were obtained at higher veloci- ties, but they have not been included since they would overlie the curves.
The resultant of the vertical and horizontal ice forces and the direction of action are plotted in Fig. 5 as a function of velocity for various cone angles. The direction of action of the resultant
0
is an angle measured from the vertical. Both the resultant force and its angle of action increase with increasing velocity. The resultant forces are remark- ably similar for all cone angles.100 ICE THICKNESS, h = 53 m m + 4 %
z FLEXURAL STRENGTH, uf = 60 kPa
+
8%a u 2 D u 0 . 1 0 . 2 n.3 n . 4 0 . 5 V E L O C I T Y , V, m l r V E L O C I T Y . V, m l s
Fig. 3. Average vertical, Fv, and horizontal, FH, forces as a function of velocity for various cone angles, a.
CONE ANGLE, a , deg
2 z
-
200 k' >-
100s
s 0 0 15 30 45 6 0 75 9 0 CONE ANGLE, a , deg", n . 60
-
9-
I_
I I 1 - r n oI
VELOCITY. V, mls 0 0 0 . 1 0 . 2 0 . 3 0 . 4 0.5 VELOCITY, V, mlsFig. 5. Resultant ice force, Fres, and angle of its action from the vertical, p, versus velocity for various cone angles.
V = 0.10 mls, o = 0.05 m l s o = 0.01 m l s A
...
1 0 0 ICE THICKNESS, h, m m 4 0 0 I 1 I I I II
O!
la,a
0,a
0Qo
o! ICE THICKNESS, h, rnmFig. 6. Vertical force, F y , and horizontal force, FH, as a function of ice thickness for a 45 deg conical structure. Fig. 4. Influence of cone angle a on ice forces.
Ice thickness effect
The results of tests on the effect of ice thick- ness are presented in Fig. 6. These tests were done with the 45 deg cone angle structure and showed an increase in both vertical and horizontal force with increasing ice thickness. Again results have been presented only for velocities in the range 0.01 to 0.1 m/s, but similar trends were observed for higher velocities.
Flexural strength effects
To determine the influence of flexural strength on ice forces a series of tests was carried out with
30 and 4 5 deg conical structures at a velocity of
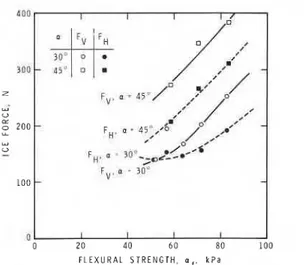
0.1 m/s in 53-mm-thick ice. The results showed an increase in ice force with increasing ice strength (Fig. 7).
OSCILLATING CONE TESTS
It is known from icebreaker technology that the icebreaking capability of small ships can be increased by a so-called "Stampfanlage." Eccen- tric rotations of masses installed in the forebody cause pitching motions of the ships that reduce icebreaking resistance considerably. Worldwide, more than one hundred shippare equipped with a "Stampf- anlage." The disadvantage of such an active ice- breaking device is the vibration and its effect on ship personnel.
In offshore structures this negative effect could be avoided if the rotating masses were to be in- stalled in conical collars that would float freely on the water surface around the piles or legs of platforms or semi-submersibles (Waas 1975). Fea- sibility studies of such an icebreaking platform, where rotating masses on conical collars would reduce the horizontal ice loads, were investigated in model tests.
Test procedure
The test set-up for the oscillating conical model structure is given schematically in Fig. 8. The mod- els of the vertical cylinder and the 45 deg cone were the same as those for the fixed cone tests. In this case, however, only the vertical cylinder
F L E X U R A L S T R E N G T H , a t , k P a
Fig. 7. Influence of flexural strength on vertical force,
Fv, and horizontal force, FH; ice thickness 5 3 mm, velocity
0.1 m/s. D I R E C T I O N O F M O T I O N
-
T O W I N G C A R R I A G E S P R . L O A D C E L L , I.
I , O S C I L L A T I N G C O N EFig. 8. Schematic, of oscillating conical model structure.
was fixed to the carriage. The cone was kept in a floating position by springs connected to it (see Fig. 8). Two counter-rotating eccentric masses generated the vertical oscillatory motion of the cone.
By varying the axis of rotation by 45 deg in the horizontal plane a horizontal component of motion was added to the vertical motion, i.e. the cone performed a circular motion. The oscillating cone was linked to the carriage by means of springs and a horizontal load-measuring device (Fig. 8). The spring allowed free motion of the cone in both hori- zontal and vertical directions.
During the icebreaking tests, in which the os- cillating cone and the vertical cylinder were driven through the level ice cover by the carriage, only the frequency of the oscillation was varied: ice thickness, ice strength and the speed of the car-
V E R T I C A L O S C l l l A T l O N
-
V E R T I C A L A N D
H O R I Z O N T A L O S C I l L A T l O N
o FLEXURAL STRENGTH, of = 60 kPa I Z 4 CONE ANGLE, a = 45" u S VELOCITY, V = 0.45 mls F R E Q U E N C Y . H z
Fig. 9. Oscillating cone results. riage were kept constant. The horizontal ice forces
on the oscillating cone plus whatever horizontal forces were generated on the vertical cylinder in the direction of the motion of the carriage were measured by a load cell.
Test results
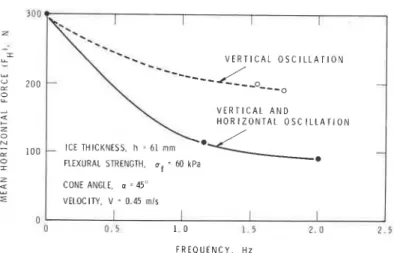
Two series of tests were performed with the oscillating cone: in the first, the cone was oscillated in the vertical direction; in the second, the cone motion was almost circular. In all tests the ice prop- erties - thickness and strength - were kept con- stant. Only the oscillating frequency was varied from 1.3 to 2 Hz. The results are presented in Fig. 9 as horizontal force (ice load) versus oscillating frequency for both test series.
The results show a decrease in ice forces as the frequency increases. Compared with the results of the fured cone tests (frequency = 0) the ice forces are reduced by about 33% in vertical oscillation (dashed line in Fig. 9). By creating circular oscil- lations the horizontal ice forces were reduced by another 33% of the forces on fixed cones, so that a total reduction of about 66% of the forces on the downward breaking cone was achieved.
DISCUSSION
Before discussing the results of this model test program, brief attention must be drawn to other relevant work. Most model testing of conical struc- tures has been carried out on upward breaking
cones at low velocities (less than 0.01 m/s; see Ed- wards and Croasdale (1977), Verity (1975) and Afanas'ev et al. (1973)). Recent work has looked at impact in addition to low velocity (Saeki et al. 1979). Sorensen (1978) carried out measurements of dynamic loads over a range of velocities on an upward breaking inclined plane. There are, how- ever, no published results on systematic tests of velocity effects on conical structures.
Description of ice structure interaction
Observations of ice interaction with the conical structure made during the model tests have led to the following qualitative description of the pro- cess. As the ice cover advances towards the struc- ture it is bent downwards until it fails. The geometry of the structure is such that the crescent-shaped ice pieces are broken off. Generally, pieces are broken off more frequently in the central region than at the sides where the effective slope is less. Because of friction, the vertical force developed in breaking the ice also generates a horizontal force on the structure. These forces are dependent on struc- ture geometry, the mechanical properties of the ice, and the rate of loading of the ice. Broken ice pieces then rotate until they are parallel to the surface of the structure. Buoyant, hydrodynamic drag and internal forces are active during this ro- tation. Structure geometry, friction, ice piece shape and structure velocity determine the horizontal and vertical loads associated with the rotation. Finally, the broken ice pieces slide around the struc- ture when friction is the main factor. This descrip-
tion of ice behaviour is very much simplified. In actual practice, the processes proceed simultaneously over the structure, and the measured mean horizon- tal and vertical forces are values integrated over time and space. Nevertheless, this qualitative de- scription provides a basis for the following discus- sion of the measured results.
Discussion of test results
The velocity effect (Fig. 3), particularly on the vertical ice force, is quite unusual and neither avail- able theories nor model tests provide explanations. Some qualitative explanations can be offered, how- ever. The ice forces are observed to increase mono- tonically with velocity up to 0.25 m/s. These forces result from the dynamic action of the broken ice pieces on the structures, so that they would be expected to increase with increasing velocity. The increase, however, is not proportional to velocity squared, so that factors other than hydrodynamic and inertial ones must be present. No open-water measurements were made, but approximate cal- culations indicated that for velocities up to 0.25 m/s water resistance is insignificant (less than 5% of total measured mean ice forces); but at a ve- locity of 0.5 m/s the water resistance could be greater than 10% of the total measured mean ice force. At a velocity of 0.5 m/s the flow around the structure is in the transitional range (Reynolds number of about 2 X lo5). For a relatively small change in conditions, flow could be either critical or sub-critical, with a corresponding four-fold change in the drag coefficient (Daugherty and Franzini 1977). The presence of ice further complicates the matter in the sense of the dynamic interaction between the ice and the water. Measured ice forces can also be related t o ice behaviour. Compressive strength and apparent elastic modulus increase with increasing strain rate. On the other hand, flex- ural strength of saline ice has been observed to be independent of loading rate over the range 1-100 kPa/s (Tatinclaux and Wu 1978). There are no simple relations between ice forces and ice properties, so that further work will be required before a satis- factory explznation can be given for the observed ice load variation with velocity.
The similarity with the resultant forces shown
in Fig. 5 is remarkable. This behaviour suggests that there is a balance between the increase in the resultant ice force due to increasing cone angle and the decrease due to diameter decrease with increasing cone angle. The resultant force seems to act in a direction normal to the cone surface. The influence of ice thickness (Fig. 6) on the vertical ice force is quite different from its effect on the horizontal force. The difference can be ex- plained in terms of the various resistance compo- nents. As mentioned earlier, the vertical ice forces are mainly related to breaking resistance, which is proportional to the rupture moment of the ice cover, i.e. flexural strength times the ice thickness squared (of h2). The vertical forces would there- fore be expected to be approximately proportional to the ice thickness squared. On the other hand, the horizontal forces are more associated with fric- tional, buoyant, drag and inertial resistances, all factors tending to vary linearly with mass and hence with ice thickness.
A linear relation between ice flexural strength
and vertical and horizontal ice forces was observed (Fig. 7) for the test condition of a single ice thick- ness and velocity for the strength range 50-80 kPa. These results would at first hand suggest that for the test condition (h = 53 mm, v = 0.1 m/s) the vertical and horizontal ice forces mainly result from brealung resistance. It should be remembered, however, that as flexural strength varies, so too does elastic modulus and thus piece size.
Data in the literature are scarce for purposes of comparison. Edwards and Croasdale (1977) (45 deg upward breaking cone of 1-m diameter, 50-mm ice thickness, high salinity model ice, flex- ural strength 25 kPa) measured mean vertical and horizontal ice forces of 370 and 360 N, respec- tively. In this test series, approximate, mean peak vertical and horizontal forces of 225 and 150 N, respectively, were measured for low velocity tests (45 deg downward breaking cone of 1.2-m diam- eter, 50-mm ice thickness, low salinity model ice, flexural strength 69 kPa). Direct comparison of the results is difficult because of differences in ice properties and cone diameter. It is clear, how- ever, that horizontal resistance is significantly lower for a downward breaking cone. Gerwick and Jahns (1979) observed, from comparative tests, that the force on an upward breaking cone is 1.5-3 times greater than that for a downward breaking cone.
70
ANALYTICAL PREDICTIONS TABLE 3
In addition to physical modelling, mathematical models have been developed for ice interaction with conical structures. Bercha and Danys (1975) idealized the ice cover as a linear elastic plate on an elastic foundation. Their analysis included the effects of in-plane loads, edge moments and fric- tion, and assumed the maximum ice force to be governed by a tensile stress failure criterion. No gravity or buoyancy effects are included. Ralston (1978) applied plastic limit analysis to the prob- lem of interaction between an ice sheet and a con- ical structure. In addition t o plastic behaviour being assumed for the ice cover, an elastic-plastic foun- dation response was assumed to describe the sub- mergence or emergence of the ice in the water. No account was taken of dynamic effects resulting from the interaction between ice and water.
A mathematical model of dynamic elastic inter- action between ice and a simple inclined plane structure has been developed by Sorensen (1978) that satisfactorily predicts peak loads measured in model tests using an artificial model ice and the low salinity model ice of this test series. This
I mathematical model, however, does not take into account the loads associated with ice ride-up on the structure. Milano (1973) formulated a model for predicting ice breaking resistance of vessels based on the energy absorbed in bending, breaking and submerging the ice, heaving of the vessel, and friction of the ice on the hull. Another analytical model (Frederking 1980) describing the variation with time of bending, frictional, buoyant, hydro- dynamic and inertial forces associated with ice acting on an inclined plane structure, underpredicted the forces measured in model tests by about one third.
Predicted ice forces
Recently, the plastic limit analysis has been extended to a downward breaking cone (Ralston 1980). The results of this analysis, using the Johansen model for bending moment capacity, have been compared with forces measured in the model tests (Table 3). Using the Tresca model would reduce predicted forces by a maximum of 15%. The plastic limit analysis does not take into account the dy-
Comparison of mean peak measured ice forces and values predicted using Ralston's (1980) plastic limit analysis Cone angle Measured force Predicted force
Horizontal Vertical Horizontal Vertical
(N) (N) (N) (N)
namic interaction between ice and the cone, so that only the measured forces at low velocities (0.01 m/s or less) were used. Those used in this comparison are a mean of the peak ice forces, since this is the actual condition the plastic limit anal- ysis represents. The flexural strength used in the calculation (60 kPa) was measured at a rate that corresponds to a test velocity of about 0.1 m/s. Based on Tatinclaux and Wu's (1978) results it is reasonable to assume that this same value of flexural strength applies at a velocity of 0.01 m/s. Referring to the results in Table 3 , it may be seen that the predicted loads are higher than the mea- sured values, as would be expected for a plastic limit analysis, which by definition must give an upper bound solution. A question arises on the application of the plastic limit analysis to cases where the ice behaviour is known to be elastic. In the HSVA Ice Model Basin, particular care is taken to produce an elastic model ice, and ice fail- ure behaviour has been observed to be quite brittle. The plastic limit analysis agreed well with the model test results of Edwards and Croasdale (1977) and Afanas'ev et al. (1973). These were performed in model ice of high salinity, which is known to exhibit plastic behaviour. Kry (1980) has observed for tests performed in an outdoor model basin (Verity 1975) that the forces predicted by the plastic limit analysis were twice as great as the mea- sured forces for those cases where the ice cover was observed to fail in a brittle fashion. For more plastic failure behaviour, the agreement was good. This points out the caution necessary in applying a particular theory to model test results as well
as in comparing the results of model tests carried out in different facilities.
The following empirical equation (Edwards and Croasdale 1977) has been proposed for the average peak horizontal ice force on a 45 deg up- ward-breaking cone:
where of is the flexural strength of ice, h is the ice thickness, p, is the density of water, and D is the waterline diameter. Note, as Ralston (1980) pointed out, it would be more logical if the second term on the right-hand side of eqn. (2) were to include the term D2h rather than Dh2. Using the same values of independent variables as were used for the calculations in Table 3 , eqn. (2) predicts a hor- izontal force of 420 N for an upward breaking cone. The second term on the right-hand side of eqn. (2) is described as a gravity term; the coef- ficient on it could therefore be reduced to one ninth to describe a downward breaking cone. In this case, the horizontal force would be 260 N compared with a mean peak force of 240 N mea- sured in this test series. The tests from which the coefficients of eqn. (2) were established were car- ried out on low strength, high salinity ice, so that again there is doubt about the validity of the com- parison.
CONCLUSIONS
Comparison with data in the literature has shown downward-breaking cones t o be superior to up- ward-breaking cones in reducing both horizontal and vertical forces. The results of the model tests presented in this paper indicate that the average horizontal ice force on the fixed cones decreases significantly as the cone angle decreases, although
1
the waterline diameter of the cone increases. For an oscillating cone, a horizontal force reduction of 213 below that of the fixed cone was found.I
I These results demonstrate that a potential exists
for conical offshore structures. By either passive or active devices such structures could be subjected to substantially reduced ice forces.
I
ACKNOWLEDGEMENTSThe authors acknowledge financial support for this research project from the German Ministry
of Science and Technology and the opportunity provided to R. Frederking by the National Research Council of Canada to participate in the project. Gratitude is expressed to colleagues at HSVA, L. Hoffmann, D. Lemke and P. Jochmann, for their contributions.
REFERENCES
Afanas'ev, V.P., Dolgopolov, Yu, V. and Shvaishtein, Z.I. (1973), Ice pressure on individual marine structures, In: Ice Physics and Ice Engineering, G.N. Yakovlev (Ed.), Leningrad, U.S.S.R., Translation by Israel Pro- gram for Scientific Translation, Jerusalem, Israel, pp. 50-68.
Bercha, F.G. and Danys, J.V. (1975), Prediction of ice forces on conical offshore structures, Mar. Sci. Commun.,
1: 365-380.
Daugherty, R.L. and Franzini, J.B. (1977), Fluid Mechanics With Engineering Applications, McGraw-Hill, New York, 564 pp.
Edwards, R.Y. and Croasdale, K.R. (1977), Model experi- ments to determine ice forces on conical structures, J. Glaciol., 19 (18): 660.
Frederking, R. (1980), Dynamic ice forces on an inclined structure, In: Physics and Mechanics of Ice, P. Tryde (Ed.), IUTAM Symp., Copenhagen, pp. 104-116. Gerwick, B.C. and Jahns, H.O. (1979), Conceptual design
of floating drilling, production and storage caisson for Arctic waters, Proc. 5th Int. Conf. POAC, Trondheim, Noway, 2: 1173-1189.
IAHR Section on Ice Problems (1981), Standardized testing methods for measuring mechanical properties of ice, Cold Regions Sci. Technol., 4: 245-253.
Jazrawi, W. and Khanna, J . (1978), Monocone - a mobile gravity platform for the Arctic offhsore, Proc. 4th Int. Conf. POAC, St. Johns, Newfoundland, 1: 170-184. Kry, P.R. (1980), Ice forces on wide structures, Can. Geo-
tech. J., 17 (1): 97-113.
Milano, V.R. (1973), Ship resistance to continuous motion in ice, SNAME Trans., 81: 274-306.
Ralston, T.D. (1978), Ice force design considerations for conical offshore structures, Proc. 4th Int. Conf. POAC, St. Johns, Newfoundland, 2: 741-752.
Ralston, T.D. (1980), Plastic limit analysis of sheet ice loads on conical structures, In: Physics and Mechanics of Ice, Per Tryde (Ed.), IUTAM Symp., Copenhagen, pp. 289-308.
Saeki, H., Ono, T. and Ozaki, A. (1979), Experimental study on ice forces on a cone-shaped and an inclined pile structure, Proc. 5th Int. Conf. POAC, Trondheim, Norway, Vol. 2, pp. 1081-1095.
Schwarz, J. (1975), On the flexural strength and elasticity of saline ice, Proc. IAHR 3rd Int. Symp. on Ice Prob- lems, Hanover, NH, pp. 373-386.
Schwarz, J. (1978), New developments of modelling in
problems, Proc. 4th. Int. Conf. POAC, St. Johns, New- foundland, 1 : 45-61.
Schwarz, J., Frederking, R., Wessels, E. and Hoffmann, L. (1978), Theoretische Untersuchung und Durchfiihrung stiitzender EistankModeUversuche zur Ermittlune der
-
EisdruckkrZte auf Rohrstutzentragwerk von Offshore Plattformen, HSVA-Bericht Nr. 15 12.Sorensen, C. (19781, Interaction between floating ice sheets and sloping structures, Institute of Hydrodynamics and Hydraulic Engineering, Technical University of Denmark, Series Paper No. 19.
Tatinclaux, J.€. and Wu, C.Y. (1978), On flexural strength of freshwater and saline ice. Proc. Conf. Appl. Tech-
niques in Cold Environments, Anchorage, May 17-19, 1978, A.S.C.E., 1: 295-306.
Verity, P.H. (1975), APOA Project 6 5 , small prototype cone tests, winter 1973174, Arctic Petroleum Oper- ators Ass., Report No. 65-1.
Waas, H. (1975), Method of deflecting ice at upright col- umns submerged in water of stationary or floating struc- tures in marine areas in which the occurrence of ice may be expected, and ice deflector assembly therefore. Federal Republic of Germany Patent No. 2537918, U.S.A. Patent No. 4063428, Canadian Patent No. 105- 0287.
This publication i s being distributed by the Division of Building R e s e a r c h of the National R e s e a r c h Council of Canada. I t should not be reproduced in whole o r in p a r t without p e r m i s s i o n of the origihal publisher. The Di- vision would be glad to b e of a s s i s t a n c e i n obtaining s u c h permission.
Publications of the Division m a y b e obtained by m a i l - ing the a p p r o p r i a t e r e m i t t a n c e (a Bank, E x p r e s s , o r P o e t Office Money O r d e r , o r a cheque, m a d e payable t o the R e c e i v e r G e n e r a l of Canada, c r e d i t NRC) t o the National R e s e a r c h Council of Canada, Ottawa. K1A OR6
.
Stamps a r e not acceptable.A l i s t of a l l publications of the Division i s available and m a y b e obtained f r o m the Publications Section, Division of Building R e s e a r c h , National R e s e a r c h Council of Canada, Ottawa. KIA OR 6.