HAL Id: hal-01950060
https://hal.umontpellier.fr/hal-01950060
Submitted on 10 Dec 2018
HAL is a multi-disciplinary open access
archive for the deposit and dissemination of
sci-entific research documents, whether they are
pub-lished or not. The documents may come from
teaching and research institutions in France or
abroad, or from public or private research centers.
L’archive ouverte pluridisciplinaire HAL, est
destinée au dépôt et à la diffusion de documents
scientifiques de niveau recherche, publiés ou non,
émanant des établissements d’enseignement et de
recherche français ou étrangers, des laboratoires
publics ou privés.
services it provides for territories: complementarity of
survey types
Syndhia Mathé, Helene Rey-Valette
To cite this version:
Syndhia Mathé, Helene Rey-Valette. Perceptions of the role played by aquaculture and the services
it provides for territories: complementarity of survey types. Open Journal of Ecology, SCIRP, 2018,
8 (04), pp.270–285. �10.4236/oje.2018.84017�. �hal-01950060�
ISSN Online: 2162-1993 ISSN Print: 2162-1985
DOI: 10.4236/oje.2018.84017 Apr. 30, 2018 270 Open Journal of Ecology
Perceptions of the Role Played by Aquaculture
and the Services It Provides for Territories:
Complementarity of Survey Types
Syndhia Mathé
1,2,3*, Hélène Rey-Valette
41UMR Innovation, TA C-85/15, 73 rue Jean-François Breton 34398 Montpellier Cedex 5, Montpellier, France 2INNOVATION, Univ Montpellier, CIRAD, INRA, Montpellier SupAgro, Montpellier, France
3IITA Cameroun, Yaoundé, Cameroun
4Centre d’Economie de l’Environnement-Montpellier (CEE-M) and LAMETA, Univ. Montpellier, CNRS, INRA, SupAgro, France
Abstract
This article discusses the perception of ecosystem services for French and Brazilian pond fish farming. Its aim is to study the extent to which the indus-try and its stakeholders are aware of the existence of such services in order to be able to prioritize them with respect to social well-being. This identification phase is seldom discussed. It requires that survey questionnaires be designed so as to improve understanding of these perceptions. The surveys undertaken combined both open questions where the interviewees expressed their percep-tions spontaneously and closed quespercep-tions where they were invited to rank a pre-established list of the relevant services. These surveys involved 133 fish farmers and 93 stakeholders. The results show that perceptions differ by ques-tion type, and confirm the significance of the quesques-tionnaire design and the importance of combining several kinds of approach.
Keywords
Ecosystem Services, Ponds, Fish Farming, Questionnaire Design, France, Brazil
1. Introduction
The publication of the Millennium Ecosystem Assessment [1] was a watershed for environmental policy. It provided a framework to analyze ecosystem changes in terms of impacts on human well-being. Degradations in the environment are now seen as the increasing ecological costs of achieving this well-being. This in-creases the legitimacy of conservation and restoration policies, as this new
ref-How to cite this paper: Mathé, S. and Rey-Valette, H. (2018) Perceptions of the Role Played by Aquaculture and the Ser-vices It Provides for Territories: Comple-mentarity of Survey Types. Open Journal of Ecology, 8, 270-285.
https://doi.org/10.4236/oje.2018.84017
Received: March 7, 2018 Accepted: April 28, 2018 Published: April 30, 2018 Copyright © 2018 by authors and Scientific Research Publishing Inc. This work is licensed under the Creative Commons Attribution-NonCommercial International License (CC BY-NC 4.0).
http://creativecommons.org/licenses/by-nc/4.0/
DOI: 10.4236/oje.2018.84017 271 Open Journal of Ecology erence framework offers a positive and ethno-centered approach to environ-mental protection. It entails a win-win relationship where services appear as common goods or as “the dividends that society receives from natural capital”
[2]. This change in the frame of reference requires a reassessment of actors’ per-ceptions of these services in order to adapt public policies and promote collec-tive learning processes towards their protection and/or their development. At an individual level, perceptions are determining factors to understand behavior evolution in the face of new standards for ecosystem preservation [3]. At a col-lective level, they condition adhesion and trust in the institutional systems re-sponsible for the implementation of these measures.
The ecosystem service approach involves several stages: the identification (as-sociated with their spatialization), the monetization, the privatization, and the marketing of services [4],partially adopted by the Ring et al. [2]. Identification is a key stage which conditions the recognition of the value given to these services and the acceptation of policies. Yet, when compared to the other aspects, it is seldom the subject of research. The aim is to identify the representations and practices of the populations or actors in a sector. According to Balmford et al. [5], this preliminary phase is important to understand the reasons underlying the interest in ecosystem preservation in human societies. Their relative impor-tance must then be analyzed in order to rank services. It is worth emphasizing that such ranking depends on the classifications used [6], and that its relevance also depends on the context.
The objective of this article is, therefore, to discuss the service identification phase and, in particular, to analyze the survey methods used to identify and rank these services according to the perceptions of those concerned in a given terri-tory. From a methodological viewpoint, this requires a study of the survey pro-tocols concerning the choice of interviewees and the types of questionnaire used. The choice and the sampling of respondents must reflect the diversity of view-points as a function of socio-economic profiles, geographic localization and the statutes and types of structure on which the stakeholders depend. This diversity conditions the identification of the issues associated with services [7] [8] [9] [10]. Rodriguez et al. (2006) show that it is only by surveying local users that some services depending on cultural practices can be identified. This paper therefore focuses on survey and questionnaire types and, more specifically, on the differences and complementarities between open questions implying spon-taneous answers, and closed questions regarding the ranking of a pre-defined list of services. This ranking can be based on multiple methods. The spontaneous answers require textual analyses in order to define categories. Spontaneous an-swers have the advantage of not being influenced by information provided during the survey. They better reflect actor representations. However, they can be influ-enced by the media or by social networks, as is the case with socially-amplified hazards [11]. The discussion of survey methods is based on the example of eco-system service identification in pond aquaculture as part of a research project
DOI: 10.4236/oje.2018.84017 272 Open Journal of Ecology (ANR-STRA-PISCEnLIT) focused on ecological intensification in pond culture in France and Brazil. The inclusion of both French and Brazilian ponds has the advantage of taking into account cultural differences. It also makes it possible to compare two forms of pond fish farming:
1) Multi-trophic systems based on recycling farming effluents and utilizing inputs of low food value, in two sub-regions of Brazil (Chapeco and Itajaï) and,
2) Extensive polyculture systems in France (Lorraine and Brenne) which also entail recreational use (fishing trips, nature observation) in sites with particular protection measures (Natura 2000 or Ramsar sites).
The first part of the paper introduces the methodology used to study percep-tions: it is based on a literature review of survey types used in the identification of ecosystem services. The second part presents the fish farmers’ and the stake-holders’ perceptions in France and in Brazil. The final part discusses the results on the basis of the analysis of the differences observed between spontaneous perceptions and those resulting from ranking.
2. Materials and Methods
2.1. Review of the Literature on the Methods
Used to Identify Services
We made a literature review based on scientific articles related to methods for the identification of ecosystem services. In many instances, the issue of service identification is not addressed. Generally, reference lists of ecosystem services are pre-established by experts. Otherwise, research focuses on the services thought to be determinant in the specific case. Hence, the literature focuses much more on the evaluation of ecosystem services than on their identification. This relative imbalance suggests that there are no methodological problems. Yet, it is generally accepted that “the relevance of evaluations depends on the performance of the conceptual frameworks which underpin them” [12]. The service selection methods are a crucial phase [13]. Here, we will examine the methods used to identify the relevant services. Table 1 shows the types of survey and processing methods used. Apart from the articles written by Fisher et al. [14] on the definition of services, and by Muradian and Kumar [13] on the use-fulness of these approaches depending on the decision-making scale, most re-search focuses on particular fields. Generally, the teams undertaking the sur-veys are already familiar with these research fields. The MEA reference framework is used with no preliminary information on the notion of ecosys-tem services so as not to bias perceptions. Very diverse methods are used to col-lect information. They include focus groups, semi-structured interviews, email surveys, expert workshops, and literature reviews. Apart from email surveys (500 to 700 mails sent), interviews were limited to relatively small samples: between 3 and 12 persons in focus groups, and between 19 and 120 in semi-structured interviews. Almost all the surveys involved service beneficiaries, who may be relevant populations or the stakeholders representing them. The information
DOI: 10.4236/oje.2018.84017 273 Open Journal of Ecology Table 1. Review of the literature on the identification of ecosystem services.
Reference Ecosystem types Survey types Analytical method Kaplowitz [17] Mangroves
(Mexico) -12 focus groups (of 4 to 7 persons) i.e. 97 residents (14% of households) -19 individual interviews Textual analysis and transcription of individual interviews (500 pages) Kaplowitz and
Hoehn [16] Mangroves (Mexico) -Individual interviews Cross tabulation Rodríguez et al.
[18] “Opuntia scrubland” (Peru) -Semi-structured interviews with open and closed questions (113 households) selected randomly among volunteers -26 semi-structured complementary interviews (cultural aspects)
Textual analysis and creation of clusters (Similarity matrix)
Lewan and
Söderqvist [3] Catchment basin (Sweden) -Farmers (19) and stakeholders (20) (focus group and questionnaire) -General public representatives (22) (focus group and questionnaire) -Farmers (119) random selection (mail questionnaire: 50% return)
Ranking from 1 (the most significant) to 11. Frequency of replies for services ranked 1 to 3 by type of respondent Quétier et al.
[19] Grassland and landscape (France)
Semi-structured interviews (45) with photographic support Textual analysis and principal component analyses combined with hierarchical classification
Mazur and
Curtis [20] Aquaculture (Australia) -Semi-structured interviews (66 stakeholders) -Mail questionnaires (1200 with 50% return ratio) Descriptive statistics Zendehdel et al.
[21] Natural park (Iran) Focus group with individual ranking (31 participants). Construction and analyses of preference matrices based on ranking order and intensity (stochastic dominance)
collected was also analyzed in various ways: qualitative analysis (manual or machine-based textual analyses), descriptive statistics (relative frequencies and cross-tabulations), qualitative ranking, and bibliographical analysis. The simpli-fications and the selections of the services depending on their importance in dif-ferent contexts meant that between 11 and 16 services were considered. Nearly all the research was inter-disciplinary [15]. This is considered crucial by Mura-dian and Kumar [13] in order to understand the role played by ecosystems and the intertwining of the notion of ecosystem service with society. This work shows that different methods and tools may often be associated by combining qualitative and quantitative dimensions. Kaplowitz and Hoehn [16] recommend the use of complementary methods. According to them, it leads to a more ex-haustive inventory of services. Several authors emphasize the fact that some in-terviewees are reluctant to rank services, and prefer to see nature as a whole. This view reinforces the need to study the interactions between services which are rarely addressed in the literature. It is also noteworthy that in most research, the researchers undertake the interviews themselves. Finally, the identification of ecosystem services is usually a preliminary stage in their evaluation.
2.2. Site Characteristics
1 2.2.1. In FranceBrenne and Lorraine are key regions in pond aquaculture, representing 10% and
1Sites were selected in areas where researchers had close contacts with the industry and ranged from
“production” systems with low input and output levels (extensive and semi-intensive ponds) to very productive “processing” systems.
DOI: 10.4236/oje.2018.84017 274 Open Journal of Ecology 7% respectively of national production (FLAC, 2005). These ponds date back to the Middle Ages, more specifically the Xth century. The main species are the
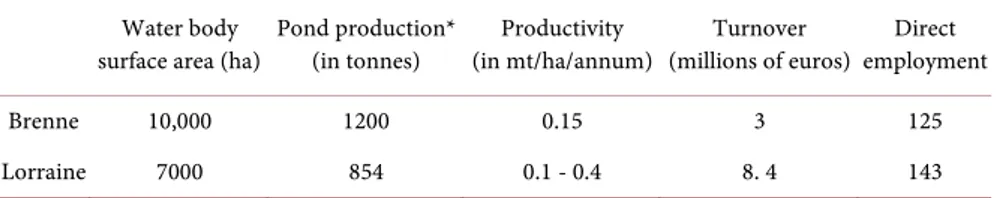
common carp, the roach, the common rudd, the tench, the pike, the perch, the pike-perch, and the noble crayfish. The production is mainly intended for en-hancement (70% in Brenne and 90% in Lorraine). In both regions, fishing and marketing are carried out by a dozen traders. Many enterprises welcome visitors (fishing trips, fish sales on site, open days, and nature observation). The activity is highly regulated by environmental standards, in particular under the Euro-pean Water Framework Directive. Many ponds belong to the Regional Nature Parks. Table 2 shows the main characteristics of the sites.
2.2.2. In Brazil
Pond fish-farming in the south of Brazil (Santa Catarina State) is a recent activi-ty that has expanded rapidly since the 1990s. Businesses are family-run and use earth ponds. The activity is associated with recycling farming effluents and the utilization of low-food-value inputs. Survey sites were selected in two areas of particular interest: the High Valley of Itajai in the East where the activity is highly structured, and that of Chapeco in the West where the organization is weaker, as it is in the rest of the region. New laws have been implemented in or-der to professionalize the sector and reduce environmental impacts. They estab-lish permanent preservation zones “APP” (Area de Preservacion Permanente) and require installations to be at least 30 m from rivers. Training was provided for fish farmers in the Itajai area through an organization (Mavipi) within which all producers adhere to the same environmentally-friendly production method. The output goes either to the Sao Paulo market or for processing. Table 3 shows the main characteristics of the sites.
2.3. Designing the Questionnaire
The questionnaire design took into account recommendations made in the Table 2. Main characteristics of pond fish-farming in France.
Water body
surface area (ha) Pond production* (in tonnes) (in mt/ha/annum) Productivity (millions of euros) Turnover employment Direct Brenne 10,000 1200 0.15 3 125 Lorraine 7000 854 0.1 - 0.4 8. 4 143
(*) concerns pond production only. In both regions, there are also trout farms. Source: FLAC [22]. Table 3. Main characteristics of pond fish-farming in Brazil.
Water body surface
area (ha) Producers production (in tonnes) Yearly (in mt/ha/annum) Productivity Mavipi 157 242 1274 12 Chapeco 349 690 1099 9.5
DOI: 10.4236/oje.2018.84017 275 Open Journal of Ecology literature (Table 1). It combined open (spontaneous perceptions)2 and closed
questions (ranking according to a pre-determined scale [25]. The open ques-tions, placed at the beginning of the questionnaire, enabled perceptions to be identified without mentioning the notion of ecosystem services. We took into account the recommendations of Kaplowitz and Hoehn [16] who suggested that in order to not influence the spontaneous nature of open questions; they should precede more technical and quantitative aspects. The interviewees were then asked to rank the 10 services they valued most from a reference list (Table 4)3.
Unlike open questions, this list suggested services that may not spontaneously spring to mind. As well as the perception of services, the multiple structural and functional features of enterprises were also to be studied. The main challenge was to establish a reference list of the services (Table 4). As generally recom-mended in the literature, this classification was adapted by the multidisciplinary group of researchers involved in the project using their knowledge and the available literature. This approach partly concerns wetlands because pond Table 4. List of ecosystem services related to pond fish-farming (France and Brazil).
France Brazil France Brazil Provisioning
Fish/crustacean production X X Energy and fuel production X Vegetable production X Ornamental resources X X Freshwater reservoir for irrigation X X Medical and veterinary resources X
Fiber production X Source of fertilizers for agriculture X Regulating
Local climate regulation X Protection against fires/storms/ floods X X Water regulation X Extraction and storage of pollutants X X
Cultural
Relationship with religion, local culture and traditions X Hunting and fishing X X Source of inspiration (artistic), sentimental value X Tourism/ecotourism X X Acquisition of know-how X Leisure X X Raising environmental awareness X X Landscape X
Supporting
Plankton production (phytoplankton and zooplankton) X Participation in natural nutrient cycles X X Sanctuaries and nesting areas for migratory birds X X Soil formation and maintenance X X Spawning grounds X Biodiversity preservation X X Wetland preservation X
2The questions asked were as follows: In three words, how would you describe your area in terms of
a pond area? In three words, how would you qualify pond fish-farming in the area? In your opinion, what do ponds bring to the region? In your opinion, what role(s) did ponds play in the past?
3Given the large number of services and to avoid memorization issues, ranking was noted directly by
the interviewee in the summary table. The classification and sequence of services is similar to that of the MEA (2005).
DOI: 10.4236/oje.2018.84017 276 Open Journal of Ecology aquaculture contributes to their conservation and prevents the disappearance of landscapes. The list was operationalized according to the specific context of each site. The existence of a service implies that there is a demand or an effective use for it [26]. This operationalization was facilitated by many years' research expe-rience at the study sites and by partnerships between local fish farmers and re-searchers, in accordance with the recommendations and findings of the litera-ture.
2.4. Sampling and Circulation of the Questionnaire
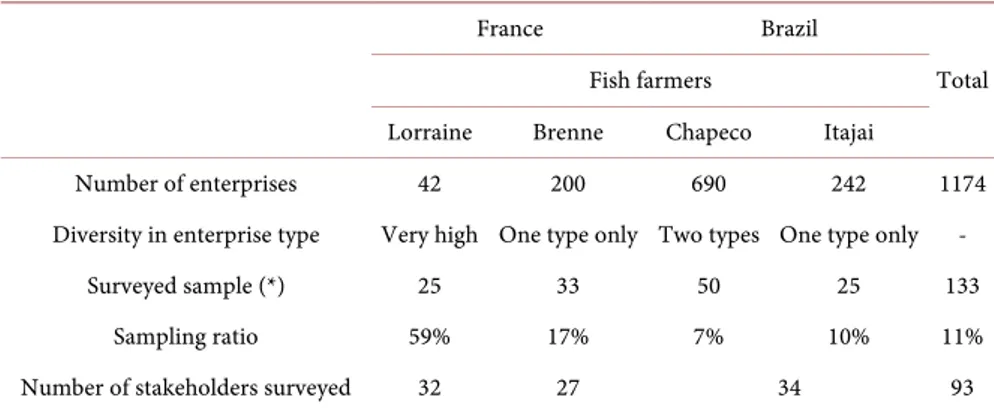
Face-to-face surveys involving fish farmers and stakeholders (institutional ac-tors, value chain representatives and land owners) were undertaken in each area (Table 5). They varied according to the context4 and lasted a couple of hours on
average. In order to take diversity into account, the fish farmer sample was drawn from a stratified sampling frame. Three variables of stratification were used: practices (extensive, semi-extensive), statute (legal, economic), and activi-ties (production associated with leisure or not). The spatial localization of enter-prises was also included as it affects the importance of water regulation services (position within the catchment basin) and cultural services (degree of isolation). The differences in the sampling ratio can be explained by the diversity in en-terprise types by site. This diversity is particularly great in Lorraine where prac-tically every enterprise shows distinct characteristics.
2.5. Statistical Analyses
Open questions generated a large number of key words to qualify the services, which were then related to the MEA categories through textual analysis (combi-nations validated by Wordmapper). It was then possible to evaluate the fre-quency of citations by category. Two scores were calculated using the data pro-vided by ranking:
Table 5. Structure of surveyed samples.
France Brazil
Total Fish farmers
Lorraine Brenne Chapeco Itajai
Number of enterprises 42 200 690 242 1174 Diversity in enterprise type Very high One type only Two types One type only -
Surveyed sample (*) 25 33 50 25 133 Sampling ratio 59% 17% 7% 10% 11% Number of stakeholders surveyed 32 27 34 93
(*) As some of the surveyed fish farmers did not wish to participate in the ranking exercise, the number analyzed was slightly lower.
4In order to ensure that survey conditions were homogeneous, the questionnaire was translated into
Brazilian and then translated back, and was discussed with the Brazilian partners associated with the project.
DOI: 10.4236/oje.2018.84017 277 Open Journal of Ecology
1) The frequency of citations with respect to the number of times a service was selected;
2) The score by service category (used to establish typologies).
Table 8 and Table 9 show the frequency or the importance of each service
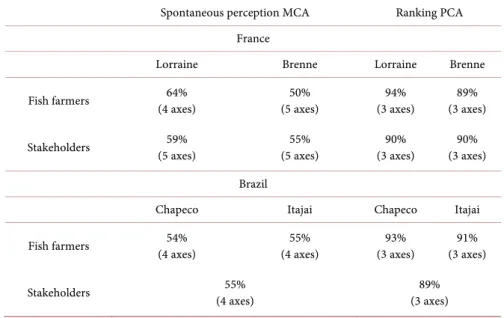
category were produced for both spontaneous perceptions and ranking. Using multivariate analyses, typologies were then developed for each site, each type of population (fish farmers and stakeholders) and each type of approach (sponta-neous perception and ranking). In all, fourteen typologies were established. They were the result of Multiple Correspondence Analyses (MCA) in the case of spontaneous perceptions and Principal Component Analysis (PCA) in the case of ranking (score classification). Each analysis was combined with an ascending hierarchical classification analysis to define the classes. The analysis was under-taken using SPAD (version 5.0). It is not possible to develop in detail all the characteristics of the analysis. Table 6 summarizes their statistical quality on the basis of the variance explained by the principal axes.
3. Results: Main Perception Types Observed
3. 1. Creation of Archetypes Showing Perception Gradation with
Respect to the Diversity of the Services Mentioned
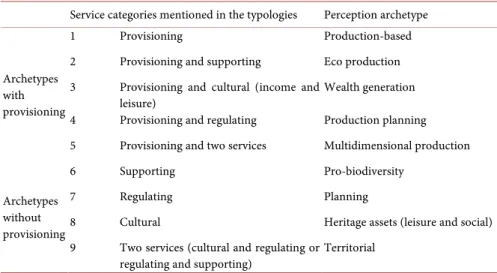
The typologies revealed a large number of classes (generally 4 classes per typol-ogy). These classes corresponded to a perception centered, in most cases, on one service category (provisioning, regulating, cultural, supporting) considered cru-cial for the individuals belonging to this class and, occasionally, on the combina-tion of two or more categories. An examinacombina-tion of all classes shows numerous recurrences. In order to simplify the analysis, the results were standardized by grouping similar classes and creating archetypes. These archetypes include all of Table 6. Statistical quality of the typologies based on the percentage of variance explained by the principal axes.
Spontaneous perception MCA Ranking PCA France
Lorraine Brenne Lorraine Brenne Fish farmers (4 axes) 64% (5 axes) 50% (3 axes) 94% (3 axes) 89%
Stakeholders (5 axes) 59% (5 axes) 55% (3 axes) 90% (3 axes) 90% Brazil
Chapeco Itajai Chapeco Itajai Fish farmers (4 axes) 54% (4 axes) 55% (3 axes) 93% (3 axes) 91%
DOI: 10.4236/oje.2018.84017 278 Open Journal of Ecology the observed classes. It is interesting to contrast productive approaches (the pro-visioning services) at one extreme with territorial approaches at the other (Table 7).
3. 2. Diversity of Perceptions in the Case of France
Table 8 summarizes the results for pond fish farming in France using the de-fined archetypes.
The findings are as follows. Services mentioned spontaneously concentrate on provisioning and wealth/income, in particular for fish farmers and to a lesser extent for stakeholders. The latter tend to mention several service categories, and to emphasize the productive role that ponds played in the past. In both studied Table 7. Perception types and their characteristics.
Service categories mentioned in the typologies Perception archetype
Archetypes with provisioning
1 Provisioning Production-based 2 Provisioning and supporting Eco production 3 Provisioning and cultural (income and
leisure) Wealth generation 4 Provisioning and regulating Production planning 5 Provisioning and two services Multidimensional production
Archetypes without provisioning
6 Supporting Pro-biodiversity 7 Regulating Planning
8 Cultural Heritage assets (leisure and social) 9 Two services (cultural and regulating or
regulating and supporting) Territorial
Table 8. Perceptions of services in France.
Perception basis
Spontaneous perception Ranking Fish farmers Stakeholders Fish farmers Stakeholders Number % Number % Number % Number % Production 13 25% 10 17% 9 17% 0 0% Eco-production 0 0% 0 0% 7 13% 0 0% Wealth generation 16 30% 0 0% 0 0% 8 14% Production planning 6 11% 0 0% 7 13% 5 8% Multidimensional production 3 6% 23 39% 0 0% 0 0% Pro-biodiversity 0 0% 5 8% 14 26% 23 39% Planning 3 6% 0 0% 5 9% 6 10% Heritage assets (leisure and
social) 8 15% 13 22% 7 13% 17 29% Territorial 4 8% 8 14% 4 8% 0%
Total (*) 53 100% 59 100% 53 100% 59 100%
DOI: 10.4236/oje.2018.84017 279 Open Journal of Ecology sites, ponds have a very significant cultural role as they are considered to be a part of the local heritage. Furthermore, in the case of Lorraine, they also play a significant recreational role (walking, fishing, and hunting). In the case of rank-ing, a wider panel of services is mentioned, essentially supporting services and in particular the preservation of biodiversity, wetlands, the role of the areas as sanctuaries and nesting grounds for migratory birds.
3. 3. Diversity of Perceptions in the Case of Brazil
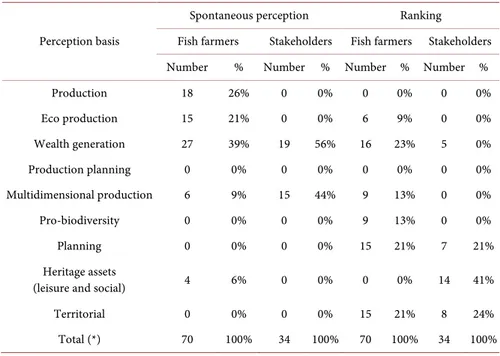
Table 9 shows the relative importance of archetypes in the case of Brazilian pond fish-farming
In Brazil, fish-farmers spontaneously placed great importance on provisioning services whereas stakeholders showed awareness of the diverse roles played by ponds (cultural and supporting) and emphasized the importance of the heritage role. As in the case of France, the use of ranking gave different results with the recognition of a wider diversity of service categories. In addition to fish produc-tion, the services most frequently mentioned were pollution control, phytop-lankton production, and the role of water regulation (role of freshwater reser-voirs and the replenishment of aquifers). It should be noted that most ponds in this part of Brazil were built by the government to combat drought, following the series of severe droughts in the 1990s.
3.4. Comparing Results between Spontaneous Perceptions and
Ranking
To facilitate comparisons, archetypes were divided into five main categories ranging from classic productive perceptions to a more territorial dimension. Table 9. Perceptions of services in Brazil.
Perception basis
Spontaneous perception Ranking
Fish farmers Stakeholders Fish farmers Stakeholders Number % Number % Number % Number % Production 18 26% 0 0% 0 0% 0 0% Eco production 15 21% 0 0% 6 9% 0 0% Wealth generation 27 39% 19 56% 16 23% 5 0% Production planning 0 0% 0 0% 0 0% 0 0% Multidimensional production 6 9% 15 44% 9 13% 0 0% Pro-biodiversity 0 0% 0 0% 9 13% 0 0% Planning 0 0% 0 0% 15 21% 7 21% Heritage assets
(leisure and social) 4 6% 0 0% 0 0% 14 41% Territorial 0 0% 0 0% 15 21% 8 24% Total (*) 70 100% 34 100% 70 100% 34 100%
DOI: 10.4236/oje.2018.84017 280 Open Journal of Ecology This range corresponds to an increasing awareness of environmental interac-tions (Table 10).
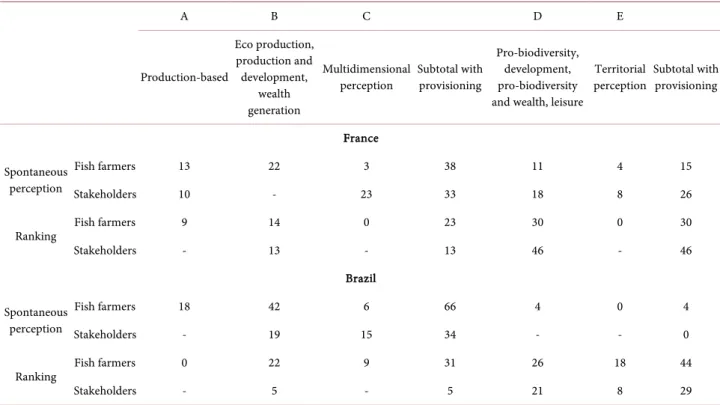
The aim is to carry out a systematic comparison of the numbers in each of these main categories with respect to spontaneous perceptions and ranking (Table 11).
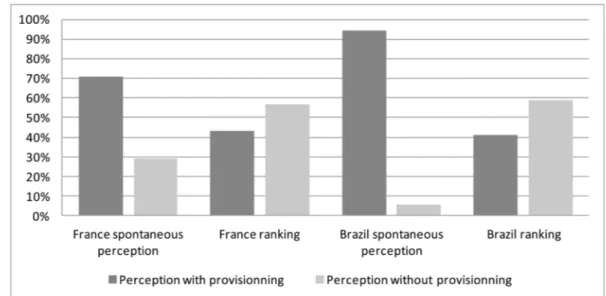
Figure 1 and Figure 2 compare sub-totals depending on whether the categories mention the provisioning service which is the traditional function of fish farming, or if instead they focus on the heritage and environmental functions. They enable the differences between spontaneous approaches and ranking to be evaluated.
This comparison shows the differences that exist between spontaneous per-ceptions and ranking. Spontaneous perper-ceptions place heavy emphasis on provi-sioning services, whilst these are far less popular with interviewees during the ranking process. Conversely, wealth, heritage, and environmental services gain paramount importance in the ranking exercise. The perceptions of fish farmers and stakeholders were found to be similar in both countries.
Table 10. Defining the main categories.
Types Perceptions Groups of categories
A Focused on production 1
B Eco production, production and development, wealth generation 2, 3 and 4
C Multidimensional 5
D Pro-biodiversity, development, pro-biodiversity and wealth, leisure 6, 7 and 8
E Territorial 9
Table 11. Numbers by main categories with respect to spontaneous perceptions and ranking.
A B C D E Production-based Eco production, production and development, wealth generation Multidimensional
perception Subtotal with provisioning
Pro-biodiversity, development, pro-biodiversity and wealth, leisure
Territorial
perception Subtotal with provisioning
France Spontaneous
perception
Fish farmers 13 22 3 38 11 4 15 Stakeholders 10 - 23 33 18 8 26
Ranking Fish farmers 9 14 0 23 30 0 30 Stakeholders - 13 - 13 46 - 46 Brazil Spontaneous perception Fish farmers 18 42 6 66 4 0 4 Stakeholders - 19 15 34 - - 0
Ranking Fish farmers 0 22 9 31 26 18 44 Stakeholders - 5 - 5 21 8 29
DOI: 10.4236/oje.2018.84017 281 Open Journal of Ecology Figure 1. Differences in the perception of services according to the type of survey method used (sponta-neous response and ranking) with respect to fish farmers.
Figure 2. Differences in the perception of services according to the type of survey method used (sponta-neous response and ranking) with respect to stakeholders.
4. Discussion
The differences observed between spontaneous perceptions and ranking (27% and 53% respectively for French and Brazilian fish farmers and 34% and 85% for the stakeholders of these two countries) show that using a pre-established list in the ranking process has a suggestive effect on respondents. They then judge some services which had not previously occurred to them to be important. In other words, ranking-based closed questions raise awareness of some services, in particular those involving a greater territorial dimension. This is understandable in that, a priori, such services are outside the realm of the traditional knowledge and practices of fish farmers and stakeholders. This result is common to both Brazil and France even though provisioning services are more important in
Bra-DOI: 10.4236/oje.2018.84017 282 Open Journal of Ecology zil in the case of spontaneous perceptions.
The demonstration of these differences confirms, as was suggested in our lite-rature review, the importance of the questionnaire design during the perception characterization phase. Following Kaplowitz and Hoehn [16], we suggest that the two types of approach be combined in order to develop an exhaustive list of services that makes sense for the actors. When survey constraints prevent this combination, the choice will depend on needs. If it is important to have the wid-est range of services recognized by actors, ranking is to be preferred. If the ob-jective is to identify the services that are integrated into the local culture and ful-ly appropriated by actors, open questions with spontaneous answers are a better choice. However, in terms of support to decision-making, combining the two types of questions enables the identification of services that are not sponta-neously perceived and will require awareness-raising and information actions. The analysis of the differences tends to show the impact of information and knowledge on perceptions. The presentation of an exhaustive list of services in itself gives new information to interviewees. Furthermore, interviews themselves may generate information. Indeed, awareness-raising as interviewers is often required to explain some services during the process. The fact that interviewees become aware of the importance of some environmental or heritage services during the ranking process confirms both the role of training and that of the knowledge of ecological perceptions on perceptions and pro-environmental be-havior. It is noteworthy that perceptions which do not include a provisioning service are more common with stakeholders who generally have a higher level of education than fish farmers [27]. This relationship with education is often men-tioned in the case of farmers with respect to pro-environmental behavior in general and more particularly in relation to ecosystem services [28]. However, better knowledge may also be generated empirically due to a greater familiarity with ponds. Several forms of knowledge can be distinguished. They depend on proximity, use, experience, or education. Apart from their education level, the origins of fish farmers and stakeholders may also explain the differences ob-served between them due to their differing degrees of familiarity with ponds and the services that they provide. Fish farmers originate from the area (76% in France and 75% in Brazil) more often than stakeholders (50% in France and 56% in Brazil). Moreover, not only do stakeholders have greater education, but also come from very different backgrounds, and have more diverse interests relating to territorial development and public policies.
This set of factors confirms the importance of perception surveys. As shown by Muradian and Kumar [13], they are a key stage in the process of value crea-tion and a crucial preliminary stage for evaluacrea-tion. These authors stress the fact that identifying insufficiently developed perceptions increases the legitimacy of policies in situations of uncertainty. They therefore emphasize the need for par-ticipatory approaches at this level. This identification stage also determines the structure of the ecosystem data and knowledge bases (Ecosystem Services
Data-DOI: 10.4236/oje.2018.84017 283 Open Journal of Ecology base, ESD) which precede the evaluation stage. As noted by Villa et al. [29] these databases are both a collaborative and an educational tool in the recognition of the services and the social acceptation of the relevant conservation measures. In forestry, Agbenyega et al. [30] show that if the perceptions of several categories of users are taken into account, tensions can be avoided when measures are im-plemented.
5. Conclusion
The observed differences by survey type confirm in line with the literature, the usefulness, if not the necessity, of combining spontaneous approaches and ranking. This research also shows that it is useful to study perceptions in order to identify the services that are acknowledged by the actors. This identification stage demonstrates the existence of gaps between the processes and the issues at stake in both 1) public policy and 2) industry and stakeholder perceptions. These differences attest to the importance of information and knowledge with respect to perceptions. Thus, knowledge of perceptions helps to define more appropriate measures and the awareness and information actions that need to be imple-mented. For example, Bouton and Frederick [31] showed that realistic measures reconciling nesting constraints and tourism could be adopted once perceptions were taken into account. Stakeholder interviews whether in the shape of surveys or focus groups, also play a vital role in raising awareness and facilitate the im-plementation of public policies concerned with the conservation and value en-hancement of these services [30]. However, it must be noted that despite the at-tention given to designing questionnaires and to the choices of respondents, this work uses a declarative approach and only partially conveys future behavior. This restriction is all the more significant in that this behavior is not only deter-mined by individual factors, but is also heavily influenced by the games that the actors play and the types of governance mechanisms responsible for policy im-plementation.
Acknowledgements
This study is part of the PISCENLIT (PISCiculture Ecologiquement InTensive: an approach by ecosystem) research project funded by the French National Re-search Agency (ANR-09-STRA-08). We gratefully acknowledge the contribu-tions of our project partners. The authors would like to express their sincere gra-titude to their Brazilian partners, Jorges Casaca and Sergio Tamassia, and to Pascal Fontaine from the University of Lorraine, who were heavily involved in the surveys, as well as to Nicolas Belhamiti who took part in the statistical analy-sis.
References
[1] Assessment, M.E. (2005) Millennium Ecosystem Assessment. Ecosystems and Human Well-Being: Biodiversity Synthesis. World Resources Institute, Washington, DC.
DOI: 10.4236/oje.2018.84017 284 Open Journal of Ecology
[2] Ring, I., et al. (2010) Challenges in Framing the Economics of Ecosystems and Biodiversity: The TEEB Initiative. Current Opinion in Environmental Sustainability, 2, 15-26. https://doi.org/10.1016/j.cosust.2010.03.005
[3] Lewan, L. and Söderqvist, T. (2002) Knowledge and Recognition of Ecosystem Services among the General Public in a Drainage Basin in Scania, Southern Sweden.
Ecological Economics, 42, 459-467. https://doi.org/10.1016/S0921-8009(02)00127-1
[4] Beaumont, N., et al. (2007) Identification, Definition and Quantification of Goods and Services Provided by Marine Biodiversity: Implications for the Ecosystem Approach. Marine Pollution Bulletin, 54, 253-265.
https://doi.org/10.1016/j.marpolbul.2006.12.003
[5] Balmford, A., et al. (2002) Economic Reasons for Conserving wild Nature. Science, 297, 950-995. https://doi.org/10.1126/science.1073947
[6] Dominati, E., Patterson, M. and Mackay, A. (2010) A Framework for Classifying and Quantifying the Natural Capital and Ecosystem Services of Soils. Ecological Economics, 69, 1858-1868. https://doi.org/10.1016/j.ecolecon.2010.05.002
[7] Zhang, X. and Lu, X. (2010) Multiple Criteria Evaluation of Ecosystem Services for the Ruoergai Plateau Marshes in Southwest China. Ecological Economics, 69, 1463-1470. https://doi.org/10.1016/j.ecolecon.2009.05.017
[8] Cocklin, C., Mautner, N. and Dibden, J. (2007) Public Policy, Private Landholders: Perspectives on Policy Mechanisms for Sustainable Land Management. Journal of Environmental Management, 85, 986-998.
https://doi.org/10.1016/j.jenvman.2006.11.009
[9] Hein, L., et al. (2006) Spatial Scales, Stakeholders and the Valuation of Ecosystem Services. Ecological Economics, 57, 209-228.
https://doi.org/10.1016/j.ecolecon.2005.04.005
[10] Vatn, A. (2010)An Institutional Analysis of Payments for Environmental Services.
Ecological Economics, 69, 1245-1252.
https://doi.org/10.1016/j.ecolecon.2009.11.018
[11] Kasperson, J.X., et al. (2003) 1-The Social Amplification of Risk: Assessing Fifteen Years of Research and Theory. The Social Amplification of Risk, 1, 13-46.
https://doi.org/10.1017/CBO9780511550461.002
[12] Salles, J.-M. (2010) Évaluer la biodiversité et les services écosystémiques: Pourquoi, comment et avec quels résultats?/Assess Biodiversity and Ecosystem Services: Why, How and for What Results? Natures Sciences Sociétés, 18, 414-423.
https://doi.org/10.1051/nss/2011005
[13] Muradian, R. and Kumar, P. (2009) Payment for Ecosystem Services and Valuation: Challenges and Research Gaps. Payment for Ecosystem Services, 1-16.
[14] Fisher, B., Turner, R.K. and Morling, P. (2009) Defining and Classifying Ecosystem Services for Decision Making. Ecological Economics, 68, 643-653.
https://doi.org/10.1016/j.ecolecon.2008.09.014
[15] Aubin, J., et al. (2017) Implementing Ecological Intensification in Fish Farming: Definition and Principles from Contrasting Experiences. Reviews in Aquaculture, 19 p. https://doi.org/10.1111/raq.12231
[16] Kaplowitz, M.D. and Hoehn, J.P. (2001) Do Focus Groups and Individual Interviews Reveal the Same Information for Natural Resource Valuation? Ecological Economics, 36, 237-247.https://doi.org/10.1016/S0921-8009(00)00226-3
[17] Kaplowitz, M.D. (2000) Identifying Ecosystem Services using Multiple Methods: Lessons from the Mangrove Wetlands of Yucatan, Mexico. Agriculture and Human
DOI: 10.4236/oje.2018.84017 285 Open Journal of Ecology Values, 17, 169-179.https://doi.org/10.1023/A:1007669404425
[18] Rodríguez, L.C., Pascual, U. and Niemeyer, H.M. (2006) Local Identification and Valuation of Ecosystem Goods and Services from Opuntia Scrublands of Ayacucho, Peru. Ecological Economics, 57, 30-44.
https://doi.org/10.1016/j.ecolecon.2005.03.022
[19] Quétier, F., et al. (2009) Social Representations of an Alpine Grassland Landscape and Socio-Political Discourses on Rural Development. Regional Environmental Change, 10, 119-130.https://doi.org/10.1007/s10113-009-0099-3
[20] Mazur, N.A. and Curtis, A.L. (2008) Understanding Community Perceptions of Aquaculture: Lessons from Australia. Aquaculture International, 16, 601-621.
https://doi.org/10.1007/s10499-008-9171-0
[21] Zendehdel, K., et al. (2008) Qualitative Valuation of Environmental Criteria through a Group Consensus Based on Stochastic Dominance. Ecological Economics, 67, 253-264.https://doi.org/10.1016/j.ecolecon.2008.05.013
[22] FLAC (2005) Analyse du poids socio-économique de la filière aquacole lorraine et évolution. Enquête socio-économique. FLAC, Boimont, 30.
[23] Pro-Mover and ADEMAVIPI (2011) Projecto promovendo piscicultura no alta Vale do Itajai. ADEMAVIPI, Alto Vale do Itajaï.
[24] EPAGRI/CEDAP (2010) Dados da piscicultura de agua doce em Santa Catarina. Epagri, Chapeco.
[25] Duc, N.M. (2008) Farmers’ Satisfaction with Aquaculture—A Logistic Model in Vietnam. Ecological Economics, 68, 525-531.
https://doi.org/10.1016/j.ecolecon.2008.05.009
[26] Boyd, J. and Banzhaf, S. (2007) What Are Ecosystem Services? The Need for Standardized Environmental Accounting Units. Ecological Economics, 63, 616-626.
https://doi.org/10.1016/j.ecolecon.2007.01.002
[27] Blayac, T., et al. (2014) Perceptions of the Services Provided by Pond Fish Farming in Lorraine (France). Ecological Economics, 108, 115-123.
https://doi.org/10.1016/j.ecolecon.2014.10.007
[28] Weiss, K., Moser, G. and Germann, C. (2006) Perception de l’environnement, conceptions du métier et pratiques culturales des agriculteurs face au développement durable. Revue Européenne de Psychologie Appliquée/European Review of Applied Psychology, 56, 73-81.https://doi.org/10.1016/j.erap.2005.04.003
[29] Villa, F., et al. (2002) Designing an Integrated Knowledge Base to Support Ecosystem Services Valuation. Ecological Economics, 41, 445-456.
https://doi.org/10.1016/S0921-8009(02)00093-9
[30] Agbenyega, O., et al. (2009) Application of an Ecosystem Function Framework to Perceptions of Community Woodlands. Land Use Policy, 26, 551-557.
https://doi.org/10.1016/j.landusepol.2008.08.011
[31] Bouton, S.N. and Frederick, P.C. (2003) Stakeholders’ Perceptions of a Wading Bird Colony as a Community Resource in the Brazilian Pantanal. Conservation Biology, 17, 297-306.https://doi.org/10.1046/j.1523-1739.2003.01148.x