Publisher’s version / Version de l'éditeur:
Vous avez des questions? Nous pouvons vous aider. Pour communiquer directement avec un auteur, consultez la
première page de la revue dans laquelle son article a été publié afin de trouver ses coordonnées. Si vous n’arrivez pas à les repérer, communiquez avec nous à [email protected].
Questions? Contact the NRC Publications Archive team at
[email protected]. If you wish to email the authors directly, please see the first page of the publication for their contact information.
https://publications-cnrc.canada.ca/fra/droits
L’accès à ce site Web et l’utilisation de son contenu sont assujettis aux conditions présentées dans le site LISEZ CES CONDITIONS ATTENTIVEMENT AVANT D’UTILISER CE SITE WEB.
Research Report (National Research Council of Canada. Institute for Research in
Construction), 2002-08-01
READ THESE TERMS AND CONDITIONS CAREFULLY BEFORE USING THIS WEBSITE. https://nrc-publications.canada.ca/eng/copyright
NRC Publications Archive Record / Notice des Archives des publications du CNRC :
https://nrc-publications.canada.ca/eng/view/object/?id=0c866095-ae30-4e56-ac0e-a5797cbe5779 https://publications-cnrc.canada.ca/fra/voir/objet/?id=0c866095-ae30-4e56-ac0e-a5797cbe5779
NRC Publications Archive
Archives des publications du CNRC
For the publisher’s version, please access the DOI link below./ Pour consulter la version de l’éditeur, utilisez le lien DOI ci-dessous.
https://doi.org/10.4224/20378500
Access and use of this website and the material on it are subject to the Terms and Conditions set forth at
Positive pressure ventilation for high-rise buildings
Positive Pressure Ventilation for High-Rise Buildings
Lougheed, G.D.; McBride, P.J.; Carpenter, D.W.
IRC-RR-102
August 2002
POSITIVE PRESSURE VENTILATION FOR HIGH-RISE BUILDING
G.D. Lougheed, P.J. McBride and D.W. Carpenter
ABSTRACT
Positive pressure ventilation (PPV) is achieved by placing fans outside a building and blowing air into the structure. When appropriate openings or vents are used in the structure, the airflow produced by the fan exhausts contaminants to the outside. Fire departments have used PPV as a means to ventilate contaminated atmospheres after initial knockdown and extinguishment of a fire. In Ontario, the use of positive pressure ventilation is still relatively new. However, its use as a tool to improve conditions is being explored by a number of fire departments, including the Ottawa Fire Department. In 1998, a joint project with Canada Mortgage and Housing Corporation, Ottawa Fire Department, Tempest Technology Corporation, the Co-operators Insurance and National Research Council Canada (NRC), was initiated to investigate the use of PPV to vent smoke from high-rise buildings. NRC's ten-storey facility was used for the investigations. In the initial phase of the project, baseline tests were conducted to determine the airflow through an open exterior stair shaft door and pressures in the stair shaft produced by the fans under non-fire conditions. A second series of baseline tests were conducted using
propane burners to simulate conditions (temperature and CO2 concentrations) produced
by a fire. These tests were used to investigate the effect of various parameters, including vent area on the effectiveness of the PPV system. Subsequently, the PPV system was used to vent smoke produced by fires involving typical residential furniture (sofas and beds). In addition, a limited number of tests were conducted with sprinklered heptane pan fires to investigate the effectiveness of the system in venting cool smoke.
TABLE OF CONTENTS
ABSTRACT ...i
TABLE OF CONTENTS...ii
LIST OF TABLES ... iii
LIST OF FIGURES ... iv INTRODUCTION ... 1 BACKGROUND... 1 PPV FANS... 5 TEST ARRANGEMENT... 5 Test Facility ... 5 Instrumentation ... 7
PPV Venting – Stair Shaft ... 7
PPV Vent – Corridor on Fire Floor... 8
FIRE AND PPV TEST SCENARIOS... 8
Propane Burner Fire Tests ... 8
Residential Furniture ... 8
Sprinklered Heptane Pan Fires... 9
Fire/PPV Test Sequences for Residential Furniture and Sprinklered Tests ... 10
RESULTS – BASELINE TESTS ... 10
Air Velocities and Air Flows ... 10
Airflow and Pressure ... 11
RESULTS - PROPANE BURNER TESTS ... 12
Propane Burner Fires ... 13
Stair Shaft Venting ... 14
Stair Shaft Venting Analysis ... 16
Corridor Venting ... 16
RESULTS – SOFA FIRE TESTS... 17
Sofa Fires – Test Sequences 1 and 2... 17
Smoke Levels in Stair Shaft – Sofa Fire Tests Sequence 1 and 2 ... 17
Summer versus Winter Tests ... 18
Stair Shaft Venting – Sofa Tests... 18
Impact of PPV on Stair Shaft Tenability – Sofa Tests ... 19
Sofa Fires – Test Sequence 3 ... 20
Corridor Venting – Sofa Tests ... 20
RESULTS – BED FIRE TESTS ... 21
Bed Fire Tests... 21
Smoke Levels in Stair Shaft – Bed Fire Tests Sequence 1 and 2 ... 21
Stair Shaft Venting – Bed Tests... 22
Impact of PPV on Stair Shaft Tenability – Bed Tests ... 23
Corridor Venting – Bed Tests ... 23
RESULTS - SPRINKLERED FIRE TESTS ... 24
Sprinklered Heptane Pan Fire Tests... 24
Smoke Levels in Stair Shaft – Sprinklered Heptane Pan Fire Tests ... 24
Stair Shaft Venting – Sprinklered Heptane Pan Fire Tests ... 25
Corridor Venting – Sprinklered Heptane Pan Fire Tests ... 25
SUMMARY ... 26
LIST OF TABLES
Table 1. Operating parameters for PPV fans (insert disclaimer). ... 30
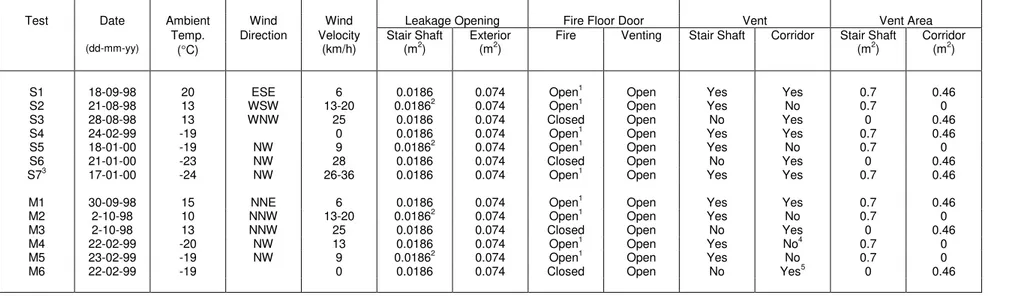
Table 2. Test parameters for PPV tests with propane burner fires... 31
Table 3. Test parameters for PPV tests with residential furniture fires. ... 32
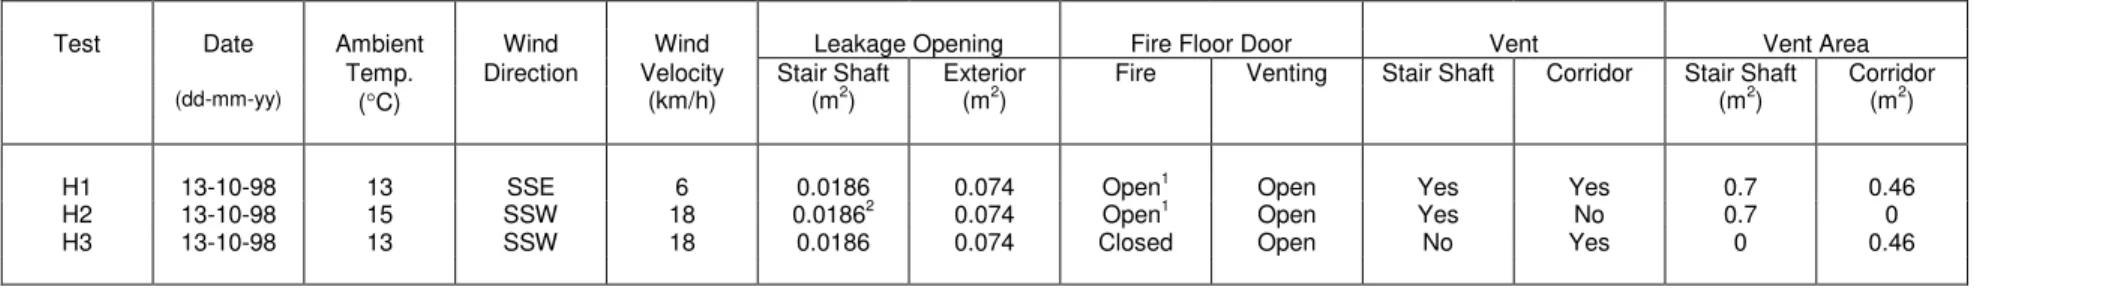
Table 4. Test parameters for PPV tests with sprinklered heptane pan fires. ... 33
Table 5. Results of baseline tests with fans. ... 34
Table 6. Test sequence for airflow and pressure measurements (Test 1)... 35
Table 7. Test sequence for airflow and pressure measurements (Test 2)... 35
Table 8. Maximum CO and CO2 concentrations and smoke obscurations measured in stair shaft during the sofa tests. ... 36
Table 9. Maximum CO and CO2 concentrations and smoke obscurations measured in stair shaft during the mattress tests. ... 36
Table 10. Maximum CO and CO2 concentrations and smoke obscurations measured in stair shaft during the sprinklered heptane pan fire tests. ... 37
LIST OF FIGURES
Figure 1. Stair well with roof access. ... 38
Figure 2. Stair well without roof access ... 38
Figure 3. Typical floor plan in ten-storey test facility. ... 39
Figure 4. Vent locations on tenth floor. ... 39
Figure 5. Heat release rates for sofa and bed. ... 40
Figure 6. Locations for velocity measurements in exterior doorway... 41
Figure 7. Photograph showing fan location. ... 41
Figure 8. Test setup. ... 42
Figure 9. Average airflow velocities through the exterior doorway. ... 43
Figure 10. Estimated airflow through exterior doorway. ... 43
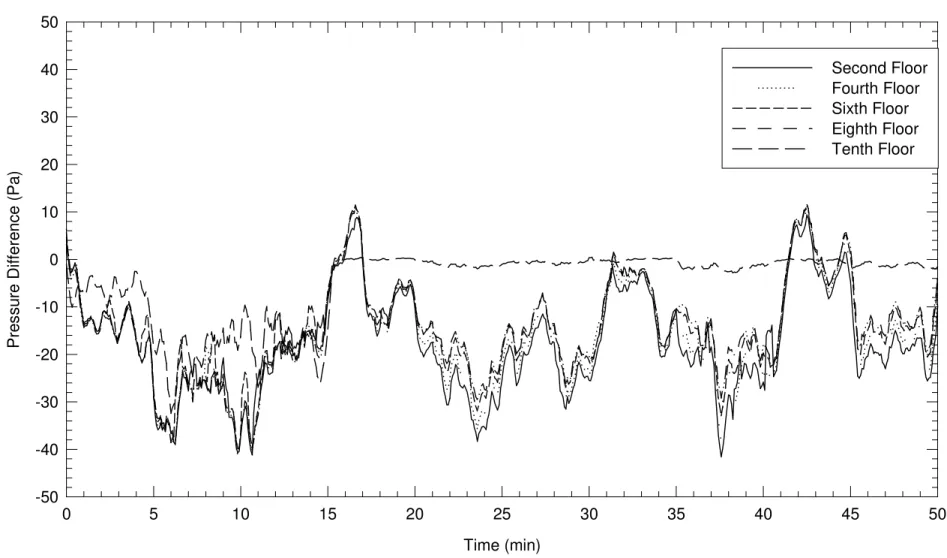
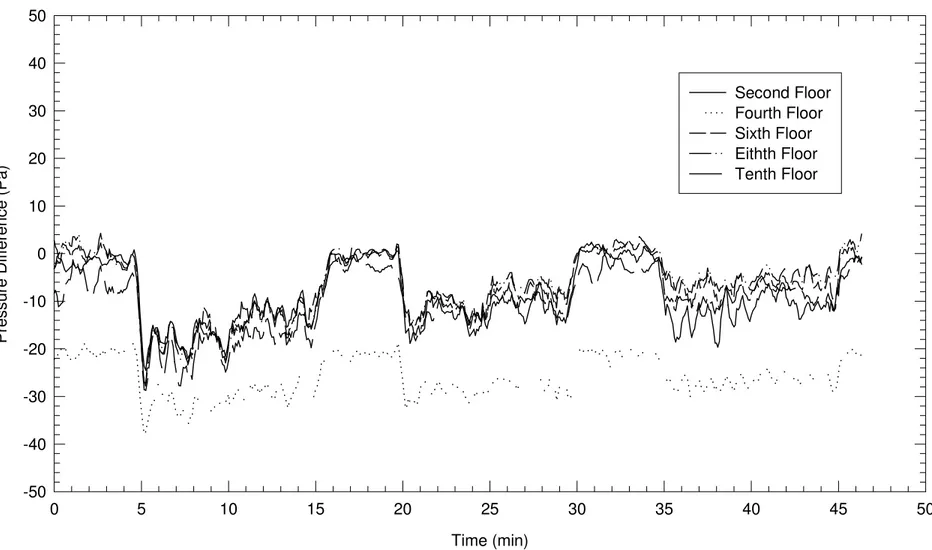
Figure 11. Pressure differences between the stair shaft and the corridor for baseline Test 1... 44
Figure 12. Pressure difference between the stair shaft and the building exterior for baseline Test 1... 45
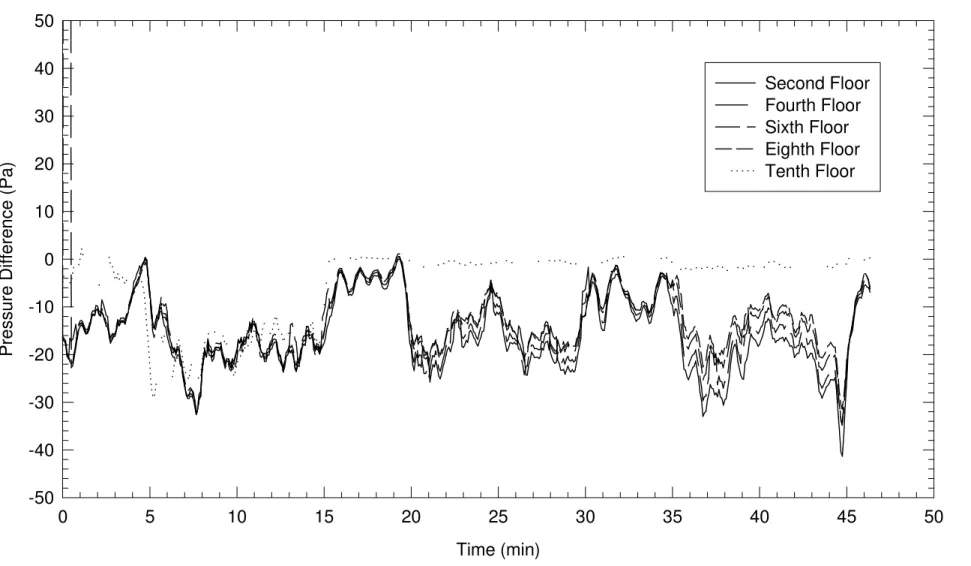
Figure 13. Pressure differences between the stair shaft and the corridor for baseline Test 2... 46
Figure 14. Pressure differences between the stair shaft and the building exterior for Baseline Test 2. ... 47
Figure 15. CO2 concentrations in stair shaft for Test 9. ... 48
Figure 16. Temperatures in stair shaft for Test 9. ... 49
Figure 17. Temperatures on the fire floor for Test 9. ... 50
Figure 18. CO2 concentrations in the stair shaft for Test 16... 51
Figure 19. Temperatures in the stair shaft for Test 16. ... 52
Figure 20. CO2 concentrations on tenth floor during venting for Tests 1-4... 53
Figure 21. CO2 concentrations on tenth floor during venting for Tests 5-8... 53
Figure 22. CO2 concentrations on tenth floor during venting for Tests 9-11... 54
Figure 23. CO2 concentrations on tenth floor during venting for Tests 12-15... 54
Figure 24. CO2 concentrations in the stair shaft for Test 17... 55
Figure 25. CO2 concentrations on tenth floor during venting for Tests 18-21... 56
Figure 26. CO2 concentrations on tenth floor during venting for Tests 9, 16 and 22. .... 56
Figure 27. CO2 concentrations in the stair shaft for Test 22... 57
Figure 28. Temperatures on the fire floor for Test 12. ... 58
Figure 29. Temperatures on the fire floor for Test 13. ... 59
Figure 30. Temperatures on the fire floor for Test 14. ... 60
Figure 31. Temperatures on the fire floor for Test 15. ... 61
Figure 32. Temperatures on the fire floor for Test 21. ... 62
Figure 33. Temperatures on the fire floor for Test 11. ... 63
Figure 34. CO2 concentrations in stair shaft for Test S1. ... 64
Figure 35. Temperatures on the fire floor for Test S1. ... 65
Figure 36. Temperatures in the stair shaft for Test S1... 66
Figure 37. Smoke optical densities for Test S1. ... 67
Figure 38. CO concentrations in the stair shaft for Test S1. ... 68
Figure 39. CO2 concentrations in the stair shaft for Test S4. ... 69
Figure 40. CO2 concentrations on the tenth floor during venting for sofa tests. ... 70
Figure 41. CO concentrations on tenth floor of stair shaft during venting... 70
Figure 42. Smoke optical densities in stair shaft on the tenth floor during venting. ... 71
Figure 43. Smoke optical densities for Test S3. ... 72
Figure 44. Smoke optical densities for Test S6. ... 73
Figure 46. Temperatures in the North Corridor on the fire floor for Test S6. ... 75
Figure 47. Temperatures 914 mm below the top of the second floor stair shaft door way during venting... 76
Figure 48. Temperatures 914 mm below the top of the North Corridor door way during venting. ... 76
Figure 49. Temperatures in the fire compartment for Test M2. ... 77
Figure 50. Temperatures in the North Corridor for Test M2. ... 78
Figure 51. CO2 concentrations in the stair shaft for Test M2... 79
Figure 52. Temperatures in the stair shaft for Test M2 (Floors 6-10). ... 80
Figure 53. CO2 concentrations on the tenth floor for the mattress tests. ... 81
Figure 54. CO concentrations on the tenth floor during venting for the mattress tests. . 81
Figure 55. Smoke optical densities in the stair shaft on the tenth floor during venting for the mattress tests... 82
Figure 56. Temperatures in the North Corridor for Test M3. ... 83
Figure 57. Temperatures in the North Corridor for Test M6. ... 84
Figure 58. Temperatures 1200 mm below the top of North Corridor door way on seventh floor... 85
Figure 59. Temperatures in the fire compartment for Test H1. ... 86
Figure 60. Temperatures in the North Corridor for Test H1. ... 87
Figure 61. Temperatures in the stair shaft for Test H1. ... 88
Figure 62. CO2 concentrations in stair shaft for Test H1... 89
Figure 63. CO2 concentrations in the stair shaft on the tenth floor during venting... 90
Figure 64. CO concentrations in the stair shaft during venting for sprinklered fires. ... 90
Figure 65. Smoke optical densities in the stair shaft on the tenth floor during venting. . 91
Figure 66. Temperatures 1200 mm below the ceiling during venting of the sprinklered fires. ... 91
POSITIVE PRESSURE VENTILATION FOR HIGH-RISE BUILDING
G.D. Lougheed, P.J. McBride and D.W. Carpenter
INTRODUCTION
Positive pressure ventilation (PPV) is achieved by placing fans outside a building and blowing air into the structure. When appropriate openings or vents are used in the structure, the airflow produced by the fan exhausts contaminants to the outside. Some U.S. fire departments have used PPV as a means to ventilate contaminated atmospheres after initial knockdown and extinguishment of a fire. In Ontario, the use of positive pressure ventilation is still relatively new. However, its use as a tool to improve conditions is being explored by a number of fire departments, including the Ottawa Fire Department.
PPV procedures have been implemented by some Ontario fire departments on a limited basis. This includes tactics for its use in the fire attack mode as well as for ventilating contaminated atmospheres during salvage and overhaul operations.
In 1998, a joint project with Canada Mortgage and Housing Corporation, Ottawa Fire Department, Tempest Technology Corporation, the Co-operators Insurance and National Research Council Canada (NRC), was initiated to investigate the use of PPV to vent smoke from high-rise buildings. NRC's ten-storey facility was used for the investigations. In the initial phase of the project, baseline tests were conducted to determine the airflow through an open exterior stair shaft door and pressures in the stair shaft produced by the fans under non-fire conditions. A second series of baseline tests were conducted using
propane burners to simulate conditions (temperature and CO2 concentrations) produced
by a fire. These tests were used to investigate the effect of various parameters, including vent area on the effectiveness of the PPV system. Subsequently, the PPV system was used to vent smoke produced by fires involving typical residential furniture (sofas and beds). In addition, a limited number of tests were conducted with sprinklered heptane pan fires to investigate the effectiveness of the system in venting cool smoke.
PPV system operations simulated included post-fire venting of a stair shaft and venting of a corridor on the fire floor during fire attack. Tests with the residential furniture were conducted under both summer and winter conditions to determine the effects of ambient temperature. The results of the test program are summarized in this report.
BACKGROUND
The importance of understanding smoke movement in storey buildings and multi-compartment buildings is well recognised. In a review of fire experience in the USA between 1987 and 1991 [1], it was shown that for most property classes, with the exception of those that care for the sick, there was a high probability of smoke damage beyond the room of fire origin. For high-rise apartment buildings, smoke damage was limited to the room of fire origin for 61.5% of fires and beyond the room of fire origin but confined to the floor of origin for 25.2% of fires. There was smoke damage beyond the
floor of fire origin for 13.3% of fires. The comparable statistics for apartment buildings of all heights were 49.5%, 21.1% and 29.3%, respectively.
The potential hazard associated with the smoke produced by a fire entering building egress routes was demonstrated in three fires in high-rise apartment buildings in Ottawa and Toronto [2,3, 4]. On May 19, 1983, the Ottawa Fire Department (OFD) responded to a fire on the sixth floor of a 20 storey residential high rise at 170 Lees Avenue. When the fire was extinguished and the smoke cleared, three people were found dead, one person was permanently injured and a family of six was found unconscious in a stairwell [2]. A fire in Toronto in a 30 storey high-rise apartment building in 1995 resulted in six deaths [4]. The fully-developed fire was in an apartment on the fifth floor of the building and the door between the fire compartment and the building corridor was left open by the
occupant. All the deaths occurred in the stair shafts well away from the fire area. In the second fire incident in Ottawa in 1997 [3], the fire started in the entrance closet of an apartment on the sixth floor of a 25-storey apartment building and rapidly spread through the apartment door into the corridor. The fire department was on the scene within 5 min of the 911 call and extinguished the fire 10 min later. Shortly after the fire department arrived on the scene, occupants were instructed to evacuate the building. All occupants of the fire floor and the floor above that attempted to evacuate encountered smoke conditions in the corridors and stair shafts. Only 54% of these people managed to reach the ground level. The remaining 46% either returned to their apartments or sought refuge in other apartments.
The fire at 170 Lees Avenue in 1983 led to a public inquiry into fire safety in high-rise buildings by Webber [2]. Subsequently, the Ottawa Fire Department (OFD) formed a committee in early 1984 to research and develop departmental high-rise operating procedures. The committee’s final document became part of the department’s official high-rise operating procedure in 1986.
The document, the first of its kind in Ontario, possibly Canada, was unique, in part, for development of a stairwell marking system that was eventually implemented through the OFD Fire Prevention Bureau. All high-rise stair shafts in Ottawa are alpha-numerically designated with the designation encircled by a black border used to indicate that the stairwell provides roof access (Figure 1). If the alpha-numeric designation is not circled (Figure 2), there is no roof access.
Studies of building occupants in the two other high-rise fires have shown that the
occupants will move through a considerable amount of smoke in an attempt to evacuate the structure [3,4]. Some of these evacuees will attempt to exit at the roof in the belief that they can exit to fresh air. In fact, the Ontario Building Code [5] requires roof access doors to be locked. The belief that one can escape the smoke via the roof is popularized by North American disaster movies, which show dramatic helicopter or rope rescues from the roof of towering buildings. Compounding this public ‘misinformation’ is the common practice, outside the Ottawa jurisdiction, of signage in stair-shafts that state “Fire Dept. Roof Access.” This practice may reinforce the existing public misconceptions or direct an individual to seek roof access during an emergency.
The Alpha-Numeric Roof-Access Designation tells firefighters, at a glance, what stair-shafts are available for ventilation through the roof --- thereby eliminating guesswork and time delays in operational decisions. This access designation also avoids the potentials of directing the public to the roof.
The OFD high-rise manual has been revised twice since its introduction: once in 1994 and again in 1998. The most recent edition reflects the adoption of the OFD Incident
Command System (ICS), and lessons learned from another tragic fire that caused two deaths at 1081 Ambleside Drive [3]. Coupled with the 1998 edition was the development of sector cards for lobby control. One of the cards details lobby control duties and the other has printed voice evacuation messages for a variety of conditions. Both cards are laminated and are placed on every OFD apparatus for use at any high-rise incident. The revisions to the OFD high-rise manual were undertaken with a balanced approach to high-rise fire and life safety by jointly addressing systems, codes, education and
firefighting operations. In many of the case studies presented in the Webber Report [2] and through operational reviews, it was noted that firefighting operations could result in serious contamination of the egress routes. While the National Building Code of Canada [6] addressed the recommendations for smoke control measures outlined in the Webber Report, smoke control remained a primary operational problem in the management of high-rise life safety during suppression efforts. In 1997 on the basis of operational review and observation, the OFD Safety Division, undertook a review of current ventilation practices and needs. As a result, a study was initiated on the concepts, tactics, benefits and potential problems associated with the introduction of Positive Pressure Ventilation (PPV).
The literature indicated that PPV should be considered as a tactic for operational needs by the OFD. Post fire application of PPV is commonly practiced as a means to
significantly reduce the time spent by crews on overhaul and salvage operations in all types of structures.
Research conducted at the University of Central Florida [7] suggests that PPV is an effective fire attack tool that can reduce heat, toxic gas and smoke levels when properly used. In addition, it is universally accepted that the proper implementation of PPV
requires training and that PPV should not be used for all fires. In the latter case mitigating factors are air inlet and exhaust point(s), obstacles to airflow, location of fire, wind
direction and victim location(s) [7].
The merits of PPV for fire attack in high-rise, large structures or complexes was uncertain due to lack of research and limited documented experience. It was this lack of research and documentation that provided the basis for the PPV research discussed in this report. The objectives of the research were to develop technical information on the use of PPV by firefighters under normal and cold weather conditions and to develop and provide
guidelines for the use of PPV systems by fire departments in high-rise buildings.
The initial phase of the project commenced in the summer of 1998 with preparation of the facility, development of the test procedures and to provide baseline data for the PPV system operation. The second phase of testing was scheduled for the months of January-February 1999 and would use selected test procedures developed in the first phase of the
project to evaluate PPV under extreme cold conditions (< -20°C) and cold conditions with
high winds (< -10°C and > 30km/h). The desired winter weather conditions were not
achieved due to an unusually mild winter and testing was delayed until the winter of 2000. During the project, information was exchanged with the Home Office Fire and Research Development Group in the United Kingdom through contacts with Officers from the Tyne
and Wear Metropolitan Fire Brigade. This included instructional material based on an extensive investigation on PPV summarized in a series of reports published by the Home Office [8-12].
A survey of US and European fire departments was undertaken [8]. It was determined that PPV is a tactic worthy of wider application by UK brigades in both post fire and fire attack particularly in single-family dwellings. The issue of large volume structures such as warehouses and the efficacy of fire attack within large structures were left open to
question but post fire smoke removal was viewed as practical. It was also noted that there was the potential for PPV to provide stairwell pressurization in buildings where fixed systems are not in place. Included in the report was a caution that an implementation of PPV should be carefully matched to training and that the progression to fire attack should not be attempted without first mastering the basics during post fire application.
In an assessment of PPV in domestic properties, it was concluded that PPV should be looked upon as simply another tactical tool that has the capability of rapidly improving the operational environment [9]. However, it was also noted that the misapplication of PPV could make things worse. Key to successful application of PPV was good fireground communications with a fan operator positioned near the fan to ensure quick control should adverse effects be found or reported from interior crews. Ventilation openings as with natural ventilation should be carefully chosen to take advantage of the prevailing wind. Manipulation of the ventilation inlet/outlet area ratio was suggested to ensure optimal airflow, particularly under opposing wind conditions. Also, ensuring that the inlet opening is larger than the outlet opening and creating a seal with the cone of air projected from the fan produced advantageous results.
In an assessment of stairshaft pressurization, it was found that it may be advantageous to use PPV to assist firefighters to reach the fire floor, locate and fight the fire, clear the stairshaft of smoke or maintain a stairshaft free of smoke for evacuation [10]. The
structure used in the trials was four stories in height and unlike most North American high-rises, had stairshaft vents at each floor landing. The venting scenarios involving the opening of stair landing outlet vents would not be transferable for use in high-rise buildings but would have application in traditional low-rise walk-ups commonly found throughout North America. Again, many of the findings of the earlier study [9] were reiterated.
Trials were conducted to assess some of the consequences of using PPV as an offensive firefighting tactic [12]. Temperature and thermal flux measurements were made to
determine the impact on a casualty that was situated between the fire and the outlet vent. Results suggested that for the scenario represented the casualty would be more severely injured by the initial fire than by the subsequent use of PPV. Results also showed that PPV cooled the compartment more rapidly than was possible using natural ventilation alone. There also was no apparent difference in fire spread under natural ventilation and when PPV was employed and that both forms of ventilation increase fire spread risk when compared to no ventilation.
Trials were also conducted to examine the ability of PPV to clear smoke from large
buildings [11]. It was found that generally the time taken to clear smoke was reduced but, a single fan would not be effective and that multiple fans would be necessary. Multiple fan techniques were tried and fan arrangements were suggested in the context of selected or available inlet openings and outlet vents.
Studies on PPV were also conducted in Finland [13] and Sweden [14]. As with the UK studies, these investigations found that PPV can be useful for both smoke ventilation and for fire attack operations. The tests undertaken in Sweden did indicate that PPV could increase the risk of fire spread to adjacent areas. The need for training and diligent command and control was emphasized.
PPV FANS
Tempest Technology Corporation* supplied the fans used for the PPV tests. The fan
systems included: a 24” gas powered fan, a 24” electric fan, 21” electric fan and 21” water-powered fan. The operating parameters for the fans are provided in Table 1. Baseline tests to determine airflow and pressures were conducted with the 24” gas-powered and 24” electric fans. The 24” gas-gas-powered fan was used for all the smoke venting tests.
TEST ARRANGEMENT Test Facility
The tests described in this report were conducted using the NRC ten-storey tower facility. This facility is part of the NRC full-scale fire test facilities located near Almonte, Ontario and was designed to represent conditions of a high-rise building. It has been used extensively for studies on smoke movement [15-17] and smoke control systems [18, 19]. This 10-storey facility includes an experimental tower and an attached observation tower. The typical floor height is 2.6 m except for the first and second floors, which are 3.6 m. Both towers are constructed of 200 mm thick monolithic reinforced concrete. A plan view of a typical floor is shown in Figure 3.
The observation tower contains a freight elevator, stairway, and a workspace for instrumentation and data acquisition. It is protected from the experimental section by a firewall and fire doors with small, fixed wired-glass windows. An independent air system maintains a comfortable temperature in winter and pressurizes the observation tower to prevent ingress of combustion products from the experimental tower.
The experimental tower contains all the shafts and other features necessary to simulate air and smoke movement patterns in the centre core of a typical multistorey building, including the elevator, stair, smoke exhaust, service, supply and return air shafts. The elevator and stair shafts are full-sized, but the elevator shaft has no car or hoisting apparatus. The stair shaft is equipped with a standard staircase.
A surrounding corridor isolates the shafts from the exterior walls, creating a typical
building centre core (Figure 3). All joints in the concrete structure were sealed to minimize uncontrolled air leakage. The exterior walls and walls of vertical shafts were provided with variable openings that can be set to provide leakage areas comparable to those in typical buildings.
*
Certain commercial products are identified in this paper in order to adequately specify the experimental procedure. In no case does such identification imply recommendations or endorsement by the National Research Council, nor does it imply that the product or material identified is the best available for the purpose.
A separate structure, adjacent to the tower, houses the air moving and heating plant; the air ducts are connected underground to the main test facility through a short tunnel. Two separate systems are used. The first system handles the main air supply and heating load. This system normally operates in the recirculation mode, but it can be operated with 100% outside air and used to pressurize the entire building. This system can also be run in an exhaust mode by using a separate variable-flow exhaust fan mounted at the top of the return airshaft. The second air handling system supplies outside air, either to the experimental stair and elevator shafts or to the vestibules located between the entrances to these shafts and the fire test area. The air handling systems are operated from the fan control room in the attached service unit. The airflow rates in the air ducts are measured with either multi-point self-averaging total pressure tubes and their associated static pressure taps or with an orifice plate. All were calibrated, using the pitot traverse method. For the majority of the tests with the PPV system, the building fan systems were not operating. The one exception was tests with the stair shaft pressurized (25 Pa) to simulate an operating smoke control system.
For the summer tests, the air in the test facility was not conditioned. The temperatures in the test facility were dependent on the ambient conditions on the test day. For the winter tests, electric heaters were used to maintain the air temperature in the test facility at
approximately 20°C. (The tower facility does have a propane heating system. However, it
is mounted in the HVAC system between the return air and supplies fans and can
introduce background CO2 into the building. Since the CO2 produced by the fires was
used as a primary indicator of smoke location during the tests, the electric heaters were used to heat the facility.)
The tower test facility was set up with an arrangement similar to previous smoke
movement studies [16,17]. In this test arrangement (Figure 3), the fire was located in a 3.9 m by 9 m compartment on the fire floor. The smoke produced during the fire was allowed to flow into a 30 m long corridor on the test floor and subsequently into the stair shaft through known leakage areas including, in most tests, an open door.
The exterior walls and the walls of the internal shafts were fitted with variable openings that can be set to simulate the leakage areas of a typical building. For these tests, the leakage openings to all the other building shafts in the centre core and between floors above the fire floor were closed. Two 134 by 279 mm leakage openings were located in the exterior wall of the corridor on each floor. There were two 146 mm diameter openings between the fire floor and the floor below.
A leakage opening with three different leakage areas was used between the stair shaft and the corridor on each floor for the tests with the propane burner (duct tape was used to cover the gap around the stair shaft doors to minimize the leakage through the gap). This opening simulated the gap around the door. In the initial tests, no leakage openings were
provided. Subsequent tests were conducted with a 60 mm diameter opening (0.003 m2
leakage area) and a 132 mm by 132 mm opening (0.0186 m2 leakage area). The largest
Instrumentation
Measurements included temperatures, pressures, CO and CO2 concentrations and smoke
levels at various locations in the tower facility. The location of the instrumentation was as follows:
1. Thermocouples in the fire compartment.
2. A thermocouple tree at the open door in the North corridor. On the seventh floor, the thermocouples were located 400, 800, 1200, 1700 and 2000 mm below the ceiling and on the second floor, the thermocouples were 75, 482, 914, 1372 and 1702 mm from the top of the doorway.
3. A thermocouple tree in the doorway into the stair shaft (the thermocouples were 400, 800, 1200, 1700 and 2000 mm below the ceiling on the seventh floor and 75, 482, 914, 1372 and 1702 mm from the top of the doorway on the second floor).
4. Thermocouples at the centre of the stair shaft on all floors (the thermocouple location was at mid-height between the designated floor and the floor above).
5. Pressure taps on Floors 2, 4, 6, 8 and 10 to measure the pressure differences
between the stair shaft and the corridor and between the stair shaft and the exterior of the test facility. For each floor, three pressure taps were located in the West wall at the mid-height between the designated floor and the floor above. Pressure taps were also located at the same height in the West corridor and in the stair shaft.
6. Gas sampling inlets in the stair shaft at the same location as the thermocouples on
Floors 2, 4, 6, 8 and 10 for CO/CO2 analyzers.
7. Smoke obscuration devices at the 1.5 m height above the landing area on Floors 2, 4, 6, 10 and in the corridor on Floor 8.
PPV Venting – Stair Shaft
The stair shaft in the ten-storey test facility was located in the centre core of the building and was separated from the exterior wall by a 1.2 m wide corridor located on the East, North and West sides of the test facility (Figure 3).
On the ground floor, partitions were constructed in the West corridor to isolate the exterior door and the stair shaft entrance from the corridor. This ensured that the airflow produced by the PPV fan was not diverted from the stair shaft into the ground floor of the test
facility.
There was no direct opening between the stair shaft and the exterior of the building on the tenth floor. For the venting tests, the smoke was initially vented through the stair shaft door into the tenth floor corridor. Three different venting arrangements (vent size and location) were used between the corridor and the building exterior. This simulated three possible venting scenarios that could occur in typical buildings:
1. To simulate venting through a corridor on the top floor of a building, tests were
conducted with the vent opening located in the East wall of the test facility. This is on the opposite side of the building to the stair shaft door (Figure 4). The vent opening was 1.5 m by 1.5 m. Tests with this scenario were only conducted with the propane burner fires. For these tests, the West corridor was isolated from the test area (Fire Compartment) on the South side of the building using a wall. However, the East corridor was not isolated and the smoke could flow past the vent opening into the test area.
2. To simulate venting through a small hatch at the top of the stair shaft, an opening with a width of 610 mm and height of 1143 mm was located in the West wall of the test facility at the location indicated in Figure 4. The base of the opening was 1 m above the corridor floor. Temporary walls were located in the West corridor to isolate the area with the opening from the remainder of the floor. Opening the door to the stair shaft on the tenth floor simulated the opening of the vent.
3. To simulate venting through a doorway at the top of the stair shaft, a 1.5 m by 1.5 m opening was located in the West corridor (Figure 4). With this large opening, the airflow to the exterior of the building was limited by the stair shaft door. For these tests, temporary walls were located in the West corridor to isolate the area with the opening from the remainder of the floor. Opening the door to the stair shaft on the tenth floor simulated the opening of the vent.
PPV Vent – Corridor on Fire Floor
Tests were also conducted to determine the effectiveness of the PPV system in venting the corridor on the fire floor. A 762 mm by 610 mm vent opening located in the exterior wall of the East corridor was used. This vent was at the same location as the wall vent used as the leakage opening (Figure 3). It was opened from the roof of the test facility, using a wire to remove pins located at the top of the vent cover. These tests were used to simulate the use of PPV during fire attack.
FIRE AND PPV TEST SCENARIOS
For the PPV study, tests were conducted using the following fire sources: propane burner fires and sofa fires on the second floor; sprinklered heptane pan fires and bed fires on the seventh floor.
Propane Burner Fire Tests
The propane burners were used to provide a steady fire source, which produced
repeatable conditions (temperature and CO2 concentrations) in the stair shaft prior to
venting. Using this fire scenario, the impact of various vent conditions was investigated. This included: vent location (top of stair shaft, in corridor on top floor, corridor on fire floor); vent size (simulated hatch and door); operating stair shaft smoke control system;
size of leakage opening between stair shaft and corridor (0, 0.003 m2 and 0.0186 m2); size
of leakage openings in exterior walls of the facility; open stair shaft doors above the fire floor. Tests were also conducted with natural venting. The relevant parameters, including ambient conditions for the propane burner tests, are summarized in Table 2.
Residential Furniture
The tests, with residential furniture fires and the sprinklered heptane pan fires, were conducted to determine the effectiveness of the PPV system for specific fire fighting operations including both post-fire salvage and fire attack scenarios.
Seven identical sofas were purchased from a local furniture outlet. One sofa was tested using a calorimeter system to determine its heat release rate. The heat release rate is shown in Figure 5. Three of the sofas were used for tests during the summer. The remaining three sofas were used for cold weather tests (because of the warm weather during January and February 1999, two tests were delayed until January 2000). The six
sofa tests were conducted with the fire on the second floor of the test facility. In addition to the tests with the six identical sofas, a fourth winter test was conducted with a used sofa.
Seven identical beds (mattress and box spring sets) were purchased from a local furniture outlet. One bed was tested using a calorimeter system to determine its heat release rate. The heat release rate is shown in Figure 5. Three of the beds were used for tests during the summer. The remaining three beds were used for cold weather tests. The six tests using the beds were conducted with the fire on the seventh floor of the test facility.
The heat release rates for the furniture were measured in an open calorimeter. Since the ventilation to the fire compartment was limited in the tests in the ten-storey facility, the heat release rates in the latter tests would be lower. However, based on video records, the fire development and time duration of the fires in the tower facility were comparable to the free-burn test.
The relevant parameters and ambient conditions for the residential furniture fire tests are summarized in Table 3.
Sprinklered Heptane Pan Fires
A 700 mm diameter pan was used for the sprinklered heptane pan fires. Twenty litres of heptane floated on water was used as the fuel. This fire source would typically produce a heat release rate of 500-600 kW under unsprinklered condition.
The fire was located under an 838 mm by 813 mm piece of corrugated sheet steel located on a metal frame. The metal sheet was 914 mm above the floor. Steel mesh (35% open) was located on the four sides of the stand supporting the sheet steel. This system was used to shield the fire from direct sprinkler impingement on the fuel. However, the sprinkler spray cooled the smoke exiting the fire area.
The fire compartment was equipped with a sprinkler system with two pendent sprinklers spaced at 4.6 m. The West sprinkler was 2.3 m from both the West and North walls of the fire compartment. Standard response 74°C pendent sprinklers with a 13 mm orifice were used for all tests. The water flow rate to the sprinklers was adjusted to maintain the
design density (4.1 L/min/m2) for a light hazard occupancy sprinkler system [20].
Previous research on sprinklered office fires showed that, for office scenarios with a portion of the fuel load shielded from the sprinkler spray, the heat release rate was between 500 kW and 1000 kW. A reasonably steady heat release rate was maintained for 10-20 min [21,22].
In the previous sprinklered fire tests in the tower facility with real office furniture, there was difficulty in repeating the same fire conditions [22]. For this project, it was decided to use a shielded heptane pan fire to simulate a sprinklered fire scenario. The size of the pan was scaled to produce a fire with a heat release rate of approximately 500 kW. This is consistent with the fire size determined for sprinklered office scenarios. However, the repeatability of the tests was improved by using the heptane pan fires.
The relevant parameters and ambient conditions for the sprinklered heptane pan fire tests are summarized in Table 4.
Fire/PPV Test Sequences for Residential Furniture and Sprinklered Tests
For the tests with residential furniture and the sprinklered heptane pan fires, venting, using the PPV system, was initiated at 10 min after ignition. Three different test situations were simulated. These were as follows:
1. Test Sequence 1. The door to the stair shaft on the fire floor was opened at 3 min after ignition to simulate occupants leaving the building. The door remained open for the remainder of the test. (This initial sequence simulated a situation in which the occupants exiting the building did not close the door to the compartment and to the stair shaft.) The exterior stair shaft door was opened at 8 min, simulating the arrival of the fire services and their initial activities. At 10 min, the stair shaft door was opened on the tenth floor and venting, using the PPV fan, initiated. This test sequence simulated venting of only the stair shaft.
2. Test Sequence 2. The door to the stair shaft was opened at 3 min after ignition to simulate occupants leaving the building. The door remained open for the remainder of the test. (This initial sequence simulated a situation in which the occupants exiting the building did not close the door to the compartment and to the stair shaft.) The exterior stair shaft door was opened at 8 min, simulating the arrival of the fire services and their initial activities. At 10 min, the stair shaft door on the tenth floor and the vent in the exterior wall of the East corridor on the fire floor were opened and venting, using the PPV fan, initiated. The stair shaft door on the eighth floor was open throughout the test. This test sequence simulated venting of both the stair shaft and the corridor on the fire floor. Also, it investigated the impact of a door to the stair shaft on a floor above the fire floor being open during venting.
3. Test Sequence 3. The exterior stair shaft door and the stair shaft door on the fire floor were opened at 8 min, simulating the arrival of the fire services and their initial
activities. At 10 min, the door to the stair shaft on the fire floor and the vent in the exterior wall of the corridor on the fire floor was opened and venting, using the PPV fan, initiated. This test sequence simulated venting of a corridor on the fire floor during fire attack.
Combustion air for the fire was provided through the leakage openings in the building walls and in the later stages of the test through the open exterior shaft door at ground level via the stair shaft and the corridor.
RESULTS – BASELINE TESTS Air Velocities and Air Flows
A series of baseline tests were conducted using the 24” gas fan and the 24” electric fan. In these tests, the velocities through the exterior door into the stair shaft were measured with a hot wire anemometer using a 21 point traverse. The locations for the velocity measurements are shown in Figure 6.
The fans were positioned on a plywood platform, which was at the same height as the base of the doorway as shown in Figure 7. The fan was oriented to directly face the doorway. Tests were conducted with the fans located 1.2, 1.8 and 2.4 m from the door (see Figure 6). At each distance, tests were conducted with the fan tilted 0, 5, 12 and 17
for the baseline tests was comparable to that used in standard tests used for rating purposes [23].
The average velocities through the exterior door for each test condition are summarized in Table 5. These average velocities were used to estimate the airflow through the doorway, which are also shown in Table 5.
The average airflow velocities through the doorway versus fan tilt angle are shown in Figure 9. There is a substantial difference in the average airflow through the doorway for the fans located 1.2 m from the doorway versus those measured with the fan at 1.8 m and 2.4 m. However, there are large variations in the measured air velocities with the fan at
1.2 m and a 0° tilt angle (see Tables B1 and B4). As a result, there is more uncertainty in
the estimated airflow through the doorway for this test set-up.
The estimated airflow through the doorway into the stair shaft is shown in Figure 10 (the doorway opening was 0.89 m wide by 2.1 m high). The airflow produced by the gas-powered and electric-gas-powered 24” fans are comparable. The results, with the fans set up 1.8 and 2.4 m from door and with tilt angles of 5 and 12 degrees, show the least variation
in airflow through the doorway (3-4 m3/s).
Airflow and Pressure
Two test series were conducted with the 24” gas-powered fan during which the pressure differences between the stair shaft and the corridor and between the stair shaft and the exterior of the building were measured on Floors 2, 4, 6, 8 and 10. The test sequence
used for the two tests is shown in Tables 6 and 7, respectively. The fan tilt angle was 12°.
For the first test series, all openings between the stair shaft and the building corridor were sealed. A 60 mm diameter opening between the stair shaft and the corridor was used on each floor for the second test series. The leakage openings in the exterior walls and between the floors were closed. There was a 20-30 km/h North-Northwest wind and the
ambient temperature was 20°C.
During the first test, the airflow velocities in the doorway were measured, using a 21 point traverse. The average velocities and volumetric airflow through the doorway were
comparable to those measured in the baseline tests summarized in the previous section
(1.8-2.4 m/s and 3.4-4.8 m3/s, respectively).
The pressure differences measured between the stair shaft and the corridor and between the stair shaft and the building exterior are shown in Figures 11-14. The stair shaft was the reference point for the pressure difference measurements. A negative pressure difference indicates that the stair shaft was pressurized.
There was a problem with the pressure difference measurement between the stair shaft and the building exterior on the fourth floor. The pressure difference on this floor follows the same general trends as the other floors. However, there was a shift of approximately 20 Pa.
The pressure differences varied with the size of the vent opening and with the location of the fan. With no venting, the pressure difference was approximately 15 Pa compared with 10 Pa and 5 Pa with the small and large vents, respectively.
The pressure differences generally required by codes and standards for smoke control for high-rise buildings are 12.5 Pa and 25 Pa for sprinklered and non-sprinklered buildings, respectively [24]. The pressure differences produced in the non-vented arrangements were comparable (approximately 15 Pa). As such, the PPV fans could be used to provide an additional measure of smoke control for stair shafts in buildings without mechanical smoke control systems. (For residential buildings and for sprinklered buildings, the National Building Code [25] relies on the opening of the exterior door or a vent at ground level (Measure A) rather than the use of mechanical systems to pressurize the stair shaft). With this approach, the pressure differences are produced by stack effect. However, field tests to investigate the effect of the height of the stair shaft are recommended.
The pressure differences are also consistent with the average airflow velocities through the exterior doorway. Higher-pressure differences were measured for the test
arrangements with higher airflow through the doorway (for example, with the fan located 1.8 m from the doorway).
RESULTS - PROPANE BURNER TESTS
Twenty-two tests were conducted using the propane burner as the fire source. These tests were used to provide initial fire conditions for use in investigating the impact of various parameters on the effectiveness of the PPV system. The test conditions and parameters are summarized in Table 2.
A test procedure was adopted which allowed for a minimum time delay between tests, but provided predetermined initial conditions for the venting phase of the test. The test procedure was as follows:
1. The leakage openings in the test facility were set up.
2. The burners were ignited using a propane torch and set to operate with low propane flow.
3. The door to the fire compartment was sealed.
4. The propane flow was adjusted to 500 L/min. The flow rate was monitored using a rotameter. This propane flow rate provided a steady fire of approximately 1 MW. 5. To simulate post-fire venting (Tests 1-10, 15-16, 18, 20 and 22), the propane flow rate
was substantially reduced during the venting phase. Although a small pilot fire was maintained in the fire compartment, this test condition is indicated as fire-off during venting in Table 2. Using this procedure, the fire could be re-started with a minimum time delay (if the propane flow was completely shut-off, the fire compartment would have to be cooled sufficiently between tests to allow personnel to enter and ignite the burners).
6. To simulate fire attack operations, the propane flow rate was maintained steady during the venting phase (Tests 11-14, 17, 19 and 21). Subsequent to the venting phase, the propane flow rate was reduced to maintain a pilot fire.
7. The building (doors, vents, etc.) and data acquisition systems were re-set and the next test started.
Using this test procedure, areas on the fire floor did not return to ambient conditions between tests. As such, smoke movement and thus the time required to fill the stair shaft and corridor with smoke, varied from test to test. In order to provide a repeatable initial condition for the venting phase, the smoke-filling phase was completed for most tests
once the CO2 concentration measured on the sixth floor of the stair shaft reached
approximately 4% by volume. At this time, the venting activities were initiated.
Propane Burner Fires
The CO2 concentrations and temperatures in the stair shaft and the temperatures on the
fire floor are shown in Figures 15-17 for a typical test (Test 9). At the end of the
smoke-filling phase, the CO2 concentration was 5-6% on the second floor and 4% on the sixth
floor. There was, however, only a minimal increase in CO2 concentrations on the eighth
and tenth floors.
The temperatures measured in the stair shaft also showed a substantial variation with height above the fire floor (Figure 16). The temperature measured in the stair shaft at the
second floor was 140°C at the end of the smoke filling phase. The temperature at the
tenth floor was near ambient.
The temperature in the stair shaft at the second floor (140°C) was slightly lower but
comparable to the temperatures (180-250°C) measured in the upper portion of the second
floor doorway (Figure 17). This indicates that there was cooling of the smoke as it flowed into the stair shaft. This cooling of the smoke was due to mixing with the air in the stair shaft.
Temperatures in the lower portion of the stair shaft doorway were near ambient, indicating that combustion air for the fire was being provided through the doorway. The
temperatures in the fire compartment were approximately 600°C at the end of the
smoke-filling phase (Figure 17).
With this test scenario, the primary areas of smoke-filling were the corridor on the fire floor and the section of the stair shaft between the second and sixth floors. This provided a scenario in which the smoke in the stair shaft was sandwiched above and below by air at or near ambient conditions.
The same smoke-filling criterion (4% CO2 concentration at the sixth floor) was used for all
tests except Tests 16 and 22. For Tests 16 and 22, extended time duration for smoke-filling was allowed with smoke reaching the tenth floor prior to venting. In addition, the exterior door at ground level was open during the smoke-filling phase.
The CO2 concentrations and temperatures in the stair shaft for Test 16 are shown in
Figures 18 and 19, respectively. The CO2 concentrations ranged from 5% on the second
floor to approximately 2% on the tenth floor. The temperatures measured in the stair shaft
varied from 160°C to near ambient at the tenth floor.
For Tests 18-21, the building mechanical system was used to provide pressurization in the stair shaft during the smoke-filling phase. The system was set up to provide a 25 Pa pressure difference between the stair shaft and the building corridors under non-fire conditions and with the exterior ground floor door open. This pressure difference is typical of that required by codes and standards for non-sprinklered buildings [24].
Preliminary tests were used to determine the airflow required to produce the 25 Pa
pressure difference. This airflow (4.95 m3/s) was used for Tests 18-21. As is typical for
buildings of this height, the air supply was provided to the stair shaft at the ground floor. With the pressure difference between the stair shaft and the corridor on the fire floor produced by the stair shaft pressurization, the smoke-filling rate was much slower. In
these tests, the venting sequence was initiated once the CO2 concentration in the stair
shaft at the sixth floor reached 2%.
Stair Shaft Venting
Figures 15 and 16 illustrate the general trend, which occurred after venting was initiated:
1. There was a rapid decrease in the CO2 concentrations and temperature at the bottom
of the smoke layer (Floor 2).
2. There was an initial increase in the CO2 concentrations and temperatures in the stair
shaft on the higher floors (Floors 6-10).
3. The highest increase in CO2 concentration was on the tenth floor, indicating that the
door restricted the smoke flow rate from the stair shaft.
4. Subsequent to the initial increase in CO2 concentration, the smoke was rapidly cleared
from the stair shaft. The total duration of the smoke flow through the upper section of the stair shaft to the corridor was typically 2-3 min.
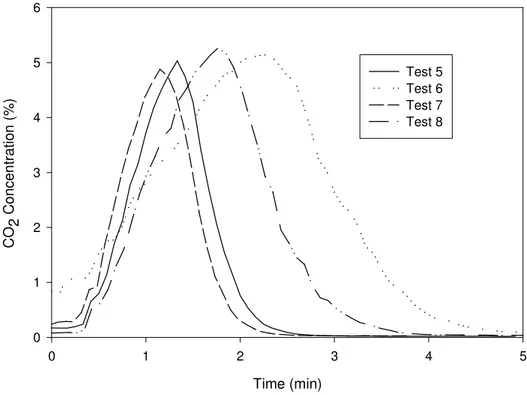
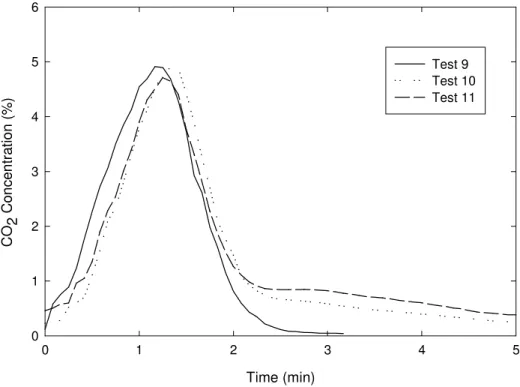
Figures 20-26 provide comparisons for the CO2 concentrations in the stair shaft on the
tenth floor. Time zero for these plots were shifted to the time at which venting was
initiated. These plots indicate the following general trends regarding the impact of venting parameters on the effectiveness of the PPV system in venting the stair shaft:
1. In Figure 20, the results for Tests 1-4 are shown. For Tests 1 and 4, the area of the
vent was 0.7 m2 compared with a vent area of 1.9 m2 that was used in Tests 3 and 4.
The results indicate a marginal increase (30-60 s) in the total venting time with the smaller opening. However, in the test arrangement, the venting was through the corridor with the small vent in the exterior wall of the test facility. This could allow some expansion of the smoke into the corridor before the small opening restricted the flow to the exterior.
2. In Figure 21, the results for Tests 5-8 are shown. For Tests 5 and 7, the PPV system was operated under the same conditions. Tests 6 and 8 were replicate tests without PPV. These results show that the venting with the PPV system was repeatable. Also, the time duration for venting was much shorter using PPV (< 2 min with PPV
compared with <4 min without).
3. In Figure 22, the results for Tests 9-11 are shown. For Tests 9 and 10, the fire was reduced during the venting phase with the stair shaft door partially and fully open, respectively. For Test 11, the stair shaft door was fully open and the fire was on during the venting phase. The time to vent the bulk of the smoke from the stair shaft did not vary significantly. However, with the door fully open and the fire on (Test 11), smoke continued to flow into the stair shaft in the latter venting stage (> 2 min). The
amount of CO2 measured at the tenth floor was marginally higher with the fire on.
4. In Figure 23, the results of Tests 12-15 are shown. In these tests, the stair shaft and the corridor on the fire floor were both vented. PPV was used for Test 12 and natural venting for Test 13. For Tests 14 and 15, the opening of the stair shaft vent was delayed up to 5 min after the PPV system was started. The simultaneous venting of
the stair shaft and the corridor did not result in a significant delay in the venting of the stair shaft (approximately 2.5 min). Also, with the venting of the corridor, smoke infiltration into the stair shaft in the latter stages was minimal compared with Test 11. Similar to Tests 6 and 8, natural venting was slower than venting with PPV (Test 15). Also, with the fire maintained throughout the test, smoke continued to infiltrate into the stair shaft during the latter stages of venting (> 3 min after venting was initiated). 5. In the tests in which the opening of the stair shaft vent was delayed after the PPV
system was started for corridor venting (Tests 14-15), there was a slow increase in the
CO2 concentration at the tenth floor. Once the vent was opened, the CO2
concentration measured at the tenth floor followed the normal pattern. However, the
peak CO2 concentrations measured during venting were lower, indicating that smoke
was forced through the leakage openings into the main facility during the initial PPV
venting phase. The small (0.003 m2) leakage openings between the stair shaft and
the corridors were used for these tests.
6. The potential for forcing smoke from the stair shaft into the building is also shown by
the CO2 concentrations measured in Test 17 (Figure 24). In this test, the door on the
tenth floor remained closed for 15 min after the PPV system was initiated at 15 min.
The CO2 concentrations decreased on Floors 2 and 6 and increased on the upper
Floors. However, the CO2 concentrations on Floors 8 and 10 never exceeded 1 and
2%, respectively. This suggests that smoke was forced into the corridors through the
0.0186 m2 leakage openings.
7. In Figure 25, the results of Tests 18-21 are shown. In these tests, a smoke control system was used to pressurize the stair shaft. Since the smoke control system limited
the flow of smoke into the stair shaft, the CO2 accumulation in the stair shaft was
slower resulting in lower CO2 concentrations measured on the tenth floor when the
venting phase was initiated. In Test 19, both the smoke control and PPV systems were used in the venting phase. Venting was completed in approximately 2 min compared with 3 min in Test 18 in which only the smoke control system was
operating. The airflow for the smoke control system was supplied to the stair shaft at the first floor and would normally result in an outward airflow through the exterior door at ground level. However, with the PPV operating, the airflow up the stair shaft was increased, resulting in a faster venting time.
8. In Tests 20 and 21, the stair shaft door on the eighth floor was open during venting.
The peak CO2 concentration on the tenth floor was significantly lower, indicating
considerable smoke was pushed into the corridor on this floor.
9. In Figure 26, the results of Tests 9, 16 and 22 are shown. In the latter two tests, the smoke-filling period was extended to allow smoke to reach the tenth floor prior to venting. The leakage openings between the stair shaft and the corridors were 0.003
m2 in Test 16 and 0.0186 m2 in Test 22. With the larger leakage openings, there was
less accumulation of CO2 in the lower sections of the stair shaft prior to the venting
phase (see Figures 18 and 27). As a result, the CO2 concentration did not increase
during the initial venting phase in Test 22.
10. The time (approximately 2 min) required to initially vent the stair shaft in the two tests with extended smoke-filling was comparable to the other tests in which only the stair shaft was vented. This indicates that the venting time is primarily dependent on the airflow through the stair shaft produced by the PPV system rather than on the amount of smoke accumulated in the stair shaft.
Stair Shaft Venting Analysis
The stair shaft was approximately 29 m high with a footprint of 12.5 m2. The total volume
of the stair shaft was approximately 363 m3. This does not take into consideration the
volume filled by the stairs and landings.
Assuming the airflow through the exterior doorway produced by the PPV fan was 4 m3/s,
the total airflow into the stair shaft during the venting time (2-3 min) was 480-720 m3,
which provided 1.5-2 air changes. This suggests the PPV system was very efficient in venting the smoke.
The venting rate for the stair shaft provided by the PPV system was approximately 30 air changes per hour (ACH). This is high compared with the 6 ACH required by the NBC (Article 3.2.6.6) for venting floor areas in high-rise buildings to aid firefighting [25]. However, for the stair shaft venting tests, the airflow was limited to a small portion of the building.
For the 6 ACH venting rate required by the NBC, 63% of the smoke in the area being vented should be removed within 10 min, assuming the smoke is evenly distributed. After 46 min, the smoke level should be reduced to 1%. If the original smoke concentration was equivalent to that of a fully-developed fire, the 99% reduction in smoke level would result in a visibility of 12.5 to 25 m.
Corridor Venting
The main objective of the tests with the propane burner was to determine the impact of various parameters, including corridor venting on the stair shaft venting. The only data available for use in determining the effectiveness of the corridor venting is the temperature profiles in the stair shaft doorway on the fire floor. (For the furniture tests, the
temperatures were measured at the doorway in the North corridor and thus provided more information on corridor venting than the propane burner fire tests.)
Five tests were conducted with corridor venting as follows:
1. For Test 12, both the corridor and the stair shaft were vented simultaneously.
2. For Tests 13 and 14, the stair shaft venting was delayed 180 and 280 s, respectively, after the corridor venting was initiated.
3. For Test 15, natural venting was used for both stair shaft and corridor venting.
4. For Test 21, the stair shaft and corridor were vented with both the mechanical smoke control system and the PPV system.
The temperatures measured in the stair shaft doorway and the fire compartment for Tests 12-15 and 21 are shown in Figures 28-32, respectively. For comparison, the temperature profiles measured in Test 11 are shown in Figure 33.
In Tests 12-15, the temperatures at the lower heights (914, 1372 and 1702 mm below the top of the doorway) were reduced to near ambient in less than 1 min. With corridor venting, the temperature was also reduced at the higher heights (75 and 482 mm below the top of the doorway. In the tests without corridor venting (Figure 33) or with natural venting (Figure 31), the temperatures near the top of the doorway remained high until the
fire was reduced. These results indicate that entrance through the stair shaft doorway could be more readily accommodated with corridor venting.
In Test 21, the smoke control system was operating throughout the smoke-filling phase. The temperatures at all heights in the doorway, except the two highest locations, were maintained at or near ambient (Figure 32). The temperatures at these two locations were reduced to near ambient once the venting phase was started.
RESULTS – SOFA FIRE TESTS
Seven tests were conducted using a sofa as the fire source. Tests S1-S3 were warm weather tests. Tests S4-S6 were conducted under cold weather conditions using identical sofas. A fourth sofa test (Test S7) was conducted in the winter. However, the sofa for this test was not the same as those used for the other six tests. The test conditions and parameters are summarized in Table 3.
Sofa Fires – Test Sequences 1 and 2
In both Test Sequences 1 and 2, the door to the stair shaft on the fire floor was opened 3 min after the fire was started. The only difference between the two scenarios during the first ten minutes was that the stair shaft door on the eighth floor was open throughout the test for Test Sequence 2.
The results for Test S1 with a sofa are shown in Figures 34-36. The propane burner was ignited at 2 min. Test Scenario 1 was used and the fire compartment was on the second floor. The results are typical of tests using Scenarios 1 and 2. The fire growth was very
rapid, with a peak temperature of approximately 860°C in the fire compartment 3 min after
ignition (Figure 35). The temperature started to increase at the top of the stair shaft door
within 2 min. The temperature at the top of the door reached 250°C in 4-5 min and
remained constant for the remainder of the test. The temperatures in the lower portion of the door decreased when the door was opened approximately 3 min after the test was started and were further reduced with the opening of the exterior door at 8 min.
The CO2 and temperature measured in the stair shaft (Floors 2, 4, 6, 8 and 10) are shown
in Figures 34 and 36, respectively. The initial increase in the smoke parameters was a result of smoke flow through the leakage opening between the corridor and the stair shaft. Once the door to the stair shaft was opened at 3 min, the smoke accumulation between
the second and third floor was very rapid, with the CO2 concentrations reaching 9% at 5
min.
There was a time lag in the smoke reaching other floors. It required approximately 2 min after the stair shaft door was opened for the smoke to reach the sixth floor. There was minimal smoke at the tenth floor prior to activation of the PPV system at 10 min. The
rapid increase in temperature and CO2 concentrations at the end of the test was as a
result of the operation of the positive pressure ventilation system.
Smoke Levels in Stair Shaft – Sofa Fire Tests Sequence 1 and 2
The sofa fire was a short duration (approximately 5 min) but a very intense fire (see Figure 5 for the measured heat release rate), which in an actual dwelling unit could have resulted in the ignition of other room contents. This limited fire did result in a very rapid
smoke accumulation in the corridor on the fire floor and in the stair shaft (Figure 37). The carbon monoxide concentrations in the stair shaft are shown in Figure 38.
The maximum CO and CO2 concentrations and smoke obscurations measured in the stair
shaft are shown in Table 8. For Scenarios 1 and 2, the maximum levels were measured during the smoke-filling stage for the lower floor levels (Floors 2-6). The maximum levels on the higher floors were measured during the venting stage.
The maximum smoke obscuration at the fourth floor were 0.8-3 OD/m (0.5-2 m visibility). This exceeds normal tenability criteria, which range from 0.05-0.5 OD/m, depending on the application [19, 26]. It is lower than the limiting value (4-10 OD/m) generally taken to represent the smoke optical densities for adverse fire conditions [19].
The maximum CO concentrations in the stair shaft (Table 8) were limited to less than 0.05% for all tests except Test S5. These levels are lower than the levels that would cause incapacitation with extended exposure (0.14-0.17% for 30 minute exposures [26]). For Test S5, the maximum CO concentration measured on the second floor was 0.2%. This is comparable to the level, which would result in incapacitation with extended exposure.
The smoke levels in the stair shaft were lower than the worst conditions that could be encountered in a fire situation. However, the smoke would represent an adverse condition for fire fighting operations, particularly in terms of visibility.
Summer versus Winter Tests
The CO2 concentrations in the stair shaft for a winter test with the exterior temperature at
-20°C is shown in Figure 39 (an analyzer with a range of 0-4% was used on the sixth
floor). In comparison with the warm weather test using the same test scenario
(Figure34), there was a more rapid increase in CO2 concentration due to stack effect.
Also, with the winter test, there was an increase in temperatures in the fire compartment,
indicating an increased burning rate. This resulted in a higher peak concentration of CO2
at the second floor (10.5% versus 9 %).
A comparison of the maximum CO and CO2 concentrations and smoke optical densities,
shown in Table 8, indicates increased smoke accumulation in the stair shaft under winter conditions. For the tests with the same sofa, the least amount of smoke accumulation in the stair shaft was for the summer tests (Tests S1 and S2) with higher smoke levels measured in Test S2 in which the stair shaft door on the eighth floor was open. Higher smoke levels were measured in the comparable tests conducted in the winter (Tests S4 and S5, respectively). The highest smoke levels were measured in Test S5 in which the stair shaft door on the eighth floor was open.
Stair Shaft Venting – Sofa Tests
The CO2 concentrations on the tenth floor during the venting phase are shown in
Figure 40 for Tests S1, S2, S4 and S5. Time zero for the plot was shifted to the time at which venting was initiated. The following general trends are indicated: