HAL Id: hal-00326967
https://hal.archives-ouvertes.fr/hal-00326967
Submitted on 7 Oct 2008
HAL is a multi-disciplinary open access archive for the deposit and dissemination of sci-entific research documents, whether they are pub-lished or not. The documents may come from teaching and research institutions in France or abroad, or from public or private research centers.
L’archive ouverte pluridisciplinaire HAL, est destinée au dépôt et à la diffusion de documents scientifiques de niveau recherche, publiés ou non, émanant des établissements d’enseignement et de recherche français ou étrangers, des laboratoires publics ou privés.
Small-mammal assemblage response to deforestation and
afforestation in central China
Francis Raoul, David Pleydell, Jean-Pierre Quere, Amélie Vaniscotte,
Dominique Rieffel, Kenichi Takahashi, Nadine Bernard, Junli Wang, Taiana
Dobigny, Kurt E. Galbreath, et al.
To cite this version:
Francis Raoul, David Pleydell, Jean-Pierre Quere, Amélie Vaniscotte, Dominique Rieffel, et al.. Small-mammal assemblage response to deforestation and afforestation in central China. Mammalia, De Gruyter, 2008, 72, pp.320-332. �hal-00326967�
Title: Small-mammal assemblage response to deforestation and afforestation in central China.
Running title: Small mammals and forest management in China
Francis Raoula*, David Pleydella, Jean-Pierre Quereb, Amélie Vaniscottea, Dominique Rieffela, Kenichi Takahashic, Nadine Bernarda, Junli Wangd, Taiana Dobignyb, Kurt E. Galbreathe, Patrick Giraudouxa
aDepartment of Chrono-environment, UMR CNRS 6249 usc INRA, University of
Franche-Comté, Place Leclerc, 25030 Besancon cedex, France
b INRA, CBGP-UMR 1062, Campus International du Baillarguet, CS 30016
34988 Montferrier sur Lez, France
cDivision of Medical Zoology, Hokkaido Institute of Public Health, N-19, W-12,
Kita-ku, Sapporo 060-0819, Hokkaido, Japan
dNingxia Medical College, Ningxia Hui Autonomous Region, 75004, P.R. China eDepartment of Ecology and Evolutionary Biology. Cornell University. E137
Corson Hall. Ithaca, NY 14850, USA
*Corresponding author: francis.raoul@univ-fcomte.fr Tel.: +33(0)3 81665736;
fax: +33(0)3 81665797. Department of Environmental Biology-EA3184-usc INRA, University of Franche-Comte, Place Leclerc, 25030 Besancon cedex, France
Abstract
Deforestation is a major environmental issue driving the loss of animal and plant species. Afforestation has recently been promoted to conserve and restore Chinese forest ecosystems. We investigated the distribution of small-mammal assemblages in an area where forest and associated deforestation habitats dominate and in an agricultural area where afforestation is ongoing in the Loess Plateau of southern Ningxia Autonomous Region, P.R. China. Multiple trapping was used.Assemblages were defined based on the multinomial probability distribution and information theory. Species turnover between assemblages of deforested and afforested habitats was high, although no clear effect on species richness was observed. The two assemblages described along the
deforestation gradient displayed higher diversity, whereas diversity was lower in assemblages identified in afforested habitats where Cricetulus longicaudatus, known agricultural pest in various areas of China, clearly dominated. The threatened Sorex cylindricauda and Eozapus setchuanus were recorded along the deforestation gradient but not in plantations. Therefore, habitats present along a deforestation succession in this part of Ningxia sustain a high diversity of small mammals and include species of conservation concern. At the present stage of its process (maximum 15 years), afforestation in southern Ningxia favours the dominance of an agricultural pest.
Keywords
Introduction
Deforestation is one of the main forces driving the loss of biodiversity via habitat loss, fragmentation, and degradation. The loss of forest area in China between 1700 and 2000, estimated as 180,106,000 ha (Houghton and Hackler 2003), has resulted mainly from conversion to farmland to sustain the demand of human development. The area of forest in China now makes up 13.9% of the total area of China (Fu et al. 2004). Deforestation is a major environmental (soil erosion, desertification) and ecological (loss of biodiversity) issue in this country (Lang 2002, Fu et al. 2004, Wang 2004). The Chinese government has recently increased its focus on conservation and restoration of forest ecosystems
through a set of measures including afforestation (National Forest Conservation Programme launched in 1998, Wenhua 2004), and plantations now account for 26.6% of the total forested area. Fast growing trees such as Chinese fir,
Masoon pine and poplar are chosen for their capacity to meet the high demand for wood product (Fu et al. 2004). The ecological role of such man-made forests in terms of biodiversity conservation is largely unexplored in China. Among the 287 species of Rodentia, Soricomorpha and Lagomorpha assessed in China by the IUCN (2006), 38 are listed threatened, and temperate forests of South west China have been designated as a priority ecoregion for rodent conservation, with agriculture expansion and timber harvesting being the major threats (Amori and Gippoliti 2001).
The effect of forest fragmentation on small mammals is now well documented over a variety of biogeographical areas, through the relationship between forest patch metrics (e.g. size, shape, inter-patch distance, habitat structure) and species abundance, richness and diversity indices (Kelt 2000, Schmid-Holmes and Drickamer 2001, Cox et al. 2004, Pardini 2004, Pardini et
al. 2005, Silva et al. 2005). The beneficial impact of landscape heterogeneity, stand structural complexity and use of native tree species for afforestation on biodiversity has been highlighted (Thompson et al. 2003, Lindenmayer and Hobbs 2004). Less attention has been paid however on the distribution of small mammals in the successions of habitats resulting from deforestation (Giraudoux et al. 1998, Bryja et al. 2002, Scott et al. 2006) or afforestation (Johnson et al. 2002, Moser et al. 2002, Liang and Li 2004, Men et al. 2006). To our
knowledge, only one study has simultaneously considered the effect of
deforestation and plantation on small mammal assemblages within a given area (Nakagawa et al. 2006, in Malaysia). This is however crucial to evaluate the ability of species to tolerate or exploit modified habitats (species turnover), and therefore to properly address biodiversity conservation issues when planning forest management schemes.
In the Loess Plateau of southern Ningxia Hui Autonomous Region, P.R. China, deforestation and agriculture intensification reached their maximum during the Great Leap period (1958-1961; Lang 2002), a peak that lasted until the late 1980’s. This has led to severe forest fragmentation leaving restricted patches of forest and associated deforestation habitats (shrubland) within a large matrix of agricultural land. Incentives for converting grazing land into tree and shrub plantation, and to reduce grazing pressure started in the late 1990’s. We describe small-mammal assemblages in the large patches of forest areas of the LiuPan mountains and in an agricultural area where afforestation has
recently started in small patches outside the LiuPan mountain area. Small mammal assemblages were defined using the multinomial probability distribution and information theory. Species richness, species density and α diversity of the defined assemblages were compared, as well as species
Material and methods
Study area
Sampling was conducted in September 2003 in three areas of Southern Ningxia Hui Autonomous Region (P.R. China) (Figure 1): south-west of Xiji city (35.92 N, 105.68 E) in the agricultural plain; north-east of Longde city (southern LiuPan; 35.67 N, 106.19 E); south-west of Guyan city (northern LiuPan; 35.93 N,106.13 E) in the forest area of LiuPan mountains. All three study areas were located on the Loess plateau. Altitude ranged from 2000 m to 2700 m. The climate is semi-arid continental with average annual temperature around 6-7°c and average precipitation ranging from 268 mm (Xiji county) to 396 mm
(Longde county).
Sampled habitats
Trapping was undertaken in 8 a priori habitats identified prior to small mammal survey on the basis of physiognomy and dominant vegetation species. For logistical reasons, detailed quantification of habitat structure and composition was not possible. Habitats from LiuPan mountains were ranked on a
deforestation gradient and habitats of the agricultural area were ranked on an afforestation gradient. These rankings were made in reference to vegetation physiognomy and the relative dominance of the different strata. Habitats in the LiuPan mountains included: (1) Forest. (2) Woody shrub (first stage after
deforestation). (3) Non-woody shrub: (second stage after deforestation). (4) Tall grassland. Habitats in the agricultural area included: (5) Ploughed fields (in valley bottom near villages). (6) Afforested set-aside fields (first stage of
afforestation). (7) Afforested grasslands (first stage of afforestation). (8) Young forest (second stage of afforestation). Further details relating to habitat
Small mammal sampling
Extensive trapping was undertaken to assess and compare the relative
abundance of species among habitats (Giraudoux et al. 1998). This study was part of a NIH-NSF funded programme on the transmission ecology of the cestode Echinococcus multilocularis (Ecology of Infectious Diseases program, grants n° TW01565-02 and TW001565-05). Lethal trapping was therefore necessary for parasitological examination. Moreover, species identification of Chinese small mammals requires investigation of teeth and skull morphology and/or DNA analysis of fresh tissue. Smaller small mammals (< 100 g) were sampled using small break-back traps (SBBT: wood and snapping bar 4.5 x 9 cm), and larger animals were trapped using big break-back traps (BBBT; iron and snapping bar 9 x 15 cm). Traps were baited with a mix of flour, peanut butter and water. Each standard trap line consisted of 25 traps set 3 m apart within a given habitat. A total of 70 SBBT and 26 BBBT standard trap lines were set up. 58 SBBT and 22 BBBT traps lines were checked every morning for 3 consecutive nights, and traps re-baited and re-set if necessary. The other lines were checked on just 1 or 2 consecutive mornings for logistical reasons. The relative proportions of SBBT and BBBT trap lines in each a priori habitat were kept constant (3 to 1). The total sampling pressure of standard trapping was 5821 trap nights (Table 1). Additionally, SBBT, BBBT, and also jaw traps were used in a non-standardized way (i.e. less than 25 traps set-up or not spaced in 3 m intervals) in villages for a total of 613 trap nights.
Animals were weighed and dissected for sex determination, reproductive status, and parasitological examination. Heads (or the whole body for a few specimens of each species) were preserved in a 5% formalin solution. Skulls and skins were prepared at the University of Franche-Comté. Specimens were
(JPQ). Species identification was made using the following references: Corbet (1978), Feng and Zheng (1985), Gromov and Polyakov (1992), Smith and Xie (2008). Nomenclature follows Wilson and Reeder (2005). Ochotona species were identified by comparing mitochondrial DNA sequences (complete
cytochrome b gene and a 993 bp portion of ND4) to those reported previously for Eurasian pikas (Yu et al. 2000). We used PAUP* 4.0b10 (Swofford 2003) to construct neighbor joining trees based on uncorrected genetic distances.
Apodemus agrarius and Apodemus peninsulae identifications were also
confirmed using cytochrome b sequencing.
Data analysis
Modelling and assemblages definition
The aim was to objectively delineate small-mammal assemblages by pooling habitats displaying similar joint trapping probability distributions of every species. Only data from standard trap lines were included in the modelling procedure. The term “trap-night” was defined as the trapping effort of a single trap set for one night and included information regarding spatial location, habitat class and which of the three consecutive nights.
a. The model
The response vector Yi for a given trap-night i was a vector of zeros and a single one such that Yi0=1 indicated an empty trap and Yij=1 indicated that species j was trapped during trap-night i. Each vector Yi was assumed to follow a multinomial probability distribution which is an appropriate distribution for modelling the frequency of observed presence among mutually exclusive categorical random variables. Since the probability of observing more than one species with a single trap-night is effectively zero the multinomial assumption is
reasonable. In order to investigate how trapping frequencies varied among habitats a log linear multinomial regression was used. In this regression the response matrix Y was the stack of all vectors Yi transposed. The 8 a priori habitat classes, represented in an indicator matrix, provided an explanatory factor. To account for reduced trapping success over successive nights, night was included as a three-level factor. Trap type was included as a two-level factor. For each species j and each trap-night i, the following linear predictor ηij was constructed:
where β0j,β1j2,…,β1jH,β2j2,β2j3,β3j were regression parameters for species j; H was the number of habitats in the habitat classification; x1ih was equal to one if trap-night i was located in habitat h and zero otherwise; x2ik was equal to one if trap-night i was set on the kth night and zero otherwise and similarly x3iwas equal to one if a BBBT and not SBBT was used for trap-night i. The probability of trapping species j on trap-night i was obtained via the link function
(McCullagh and Nelder 1989):
where, for identifiability,ηi0 =0 for all i. Thus the probability of trapping species j
was defined to be not only dependent on how the factors in question affected species j, but dependant also on how those factors affected all other species trapped in the survey. In biological terms, an advantage of the multinomial approach is that the response vectors Yj are not analysed independently on a per species basis thus assemblage level inference is made possible. In
mathematical terms, the responses in Y are not independent since there is the restriction that a single trap-night can produce only one positive result and the multinomial approach is the correct way to account for this dependence. Model parameters were estimated via maximisation of the multinomial likelihood (McCullagh and Nelder 1989):
b. Re-classification of habitats
The 8 a priori classes identified in the field constitute a habitat classification based on vegetation criteria. The question arose, was there redundancy within this classification with regards to small-mammal assemblages? To investigate this question the number of classes was reduced by means of: iterative and exhaustive pairwise class merges; re-estimation of model parameters under each new re-classification; and comparing competing models using a criterion from information theory. The aim here was to identify the most parsimonious set of composite classes which could distinguish between the principal
small-mammal assemblages sampled. The rational was that, if small small-mammal
trapping probabilities were not particularly different in two of the sampled habitat classes then a single combined class could provide a sufficient description from the perspective of rodent responses to habitat. For example, merging habitat classes a and b would change the linear predictor to
with the constraint that β1jm = 0 in the case where either a = 1 or b = 1 (to avoid
against which other parameters operate as contrasts). This is equivalent to equation 1 under the constraint that β1ja =β1jb resulting in one fewer parameter to estimate for each species being analysed. For each combination of a and b parameters of the constrained multinomial model were re-estimated using maximum likelihood and the new Akaike Information Criterion (AICab) was
derived. It was then simple to derived ∆AICab = AICab - AICori where the latter
refers to the AIC of the original (i.e. unconstrained) model. ∆AICab was used to
measure the information gained by merging habitat classes a and b. If ∆AICab
was negative an information gain had been observed such that the perceived differences between the two habitats did not relate to detectable functional differences from the small-mammal assemblage point of view. After an
exhaustive comparison of all pairwise merges, the two habitat classes providing the greatest information gain were aggregated, giving a new composite class and a new classification. The exploration of class merging was then iterated using the new classification and was finally stopped when all ∆AICabs were
positive, i.e. when the maximum of information on species distribution by habitat had been gained. In this way a new habitat classification was obtained in which each habitat class or composite class was associated with a unique small-mammal assemblage. i.e. in terms of trapping probabilities, each resultant a
posteriori habitat class was associated with a unique and distinct probability
distribution.
c. Testing for a night effect
The same redundancy reduction method was also used to investigate possible redundancy in the three-level night factor. All multinomial models were fitted using the R function “multinom” (nnet library) (Venables and Ripley 2002) and
the merging procedure was coded using the R language (version 2.2.1; R-Development-Core-Team 2005).
As a model check of residual spatial autocorrelation the Moran I statistic was estimated from model residuals of each species. None of the Moran I estimates were significant, suggesting no spatial autocorrelation in the residuals. There was therefore no need to include a spatial autocovariate in the model.
Biodiversity evaluation
Total species richness in the area was estimated using the Michaelis-Menten equation, Chao 1 and Jackknife 2 estimators (Magurran 2004). The following analyses were undertaken on the resultant a posteriori combined habitat classes (see previous section). Comparison of species richness, species density, and diversity (reciprocal Simpson index, 1/D) were made on the basis of sample-based rarefaction procedures (Gotelli and Colwell 2001) with one trap line as a sampling unit. The analytically computed Sobs Mao Tau (+/- 95%CI)
was chosen as a richness estimator (Colwell et al. 2004). Analysis of beta diversity (species turnover among combined habitat classes) was undertaken by using the Jaccard similarity index modified by Chao et al. (2005) to handle abundance data and include the effect of unseen shared species between groups (Chao et al. 2005). Jaccard similarity was transformed into distance using the complement to 1, and complete linkage agglomerative clustering was used for hierarchical agglomeration (Legendre and Legendre 1998). Analyses were run using EstimateS software version 7.5 (Colwell 2005).
Results
Small mammal species
A total of 265 animals were trapped using standard and non-standard trapping, among which 254 could be identified at the species level (Table 2). Six animals were trapped during a pilot visit in July 2003, and 10 animals in May 2005. A total of 16 species were recorded. Figure 2 shows that the total species richness, given our trapping protocol and effort, was estimated to be between 17.63 and 19. Simpson index of diversity was 4.05. Trapping results were dominated by species of the Cricetinae subfamily (60.3% of captures), i.e
Cricetulus longicaudatus and Tscherskia triton (Table 2).
Small mammal trapping probabilities
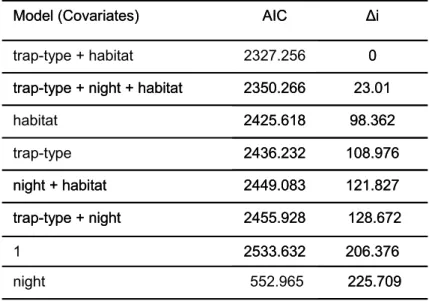
Table 3 shows that the model with the lowest AIC included an effect of “trap type” and “habitat” variables. This suggests that trapping probabilities were dependent on the kind of trap used (small and big break-back traps) and on a
priori selected habitats in which traps were set but that evidence of a night
effect was not found. The night factor was therefore removed from subsequent analyses.
Habitat reclassification
Eospalax fontanierii, Rattus rattus and Allactaga sibirica were trapped by
non-standard trapping only (in ploughed fields and in village for the two latter species, respectively), thus the reclassification procedure was performed with 13 species only. A summary of the habitat re-classification using the
redundancy reduction procedure is given in Figure 3. Three combined classes were created: (1) Forest + woody shrub: secondary forest combined with the first stage of deforestation (called “forest - woody shrub” hereafter); (2)
Non-woody shrub + tall grassland: the second stage of deforestation (i.e lower shrub cover) combined with grassland (called “shrub - grassland” hereafter); (3)
Afforested grassland + young forest: recently afforested ungrazed grassland combined with the most advanced stage of planted forest (called “young forest - afforested grassland” hereafter). Ploughed fields and afforested set-aside fields were not merged with any other habitat. Finally, five different small-mammal assemblages were defined. The relative proportions of BBBT and SBBT total trap nights in each class were 1 to 3, respectively. Therefore a trap-type bias in the comparison of assemblages was unlikely.
Assemblage response: trapping probabilities, species richness, species density, and alpha diversity
Figure 4 shows trapping probabilities for each species in the 5 assemblages as predicted by the final model. The forest – woody shrub assemblage exhibited the lowest trapping probabilities and was dominated by Apodemus agrarius, A.
peninsulae and Eothenomys sp. The two latter species were recorded only in
this assemblage. Eozapus setchuanus and Ochotona huangensis were only present in the shrub – grassland assemblage. The ploughed field assemblage was characterised by a dominance of Cricetinae (C. longicaudatus and T.
triton). Cricetulus longicaudatus was largely dominant in the two assemblages
of afforested habitats, with the higher trapping probability in the afforested set-aside fields class. Tscherskia triton and A. agrarius were present in every assemblage though at different relative abundance.
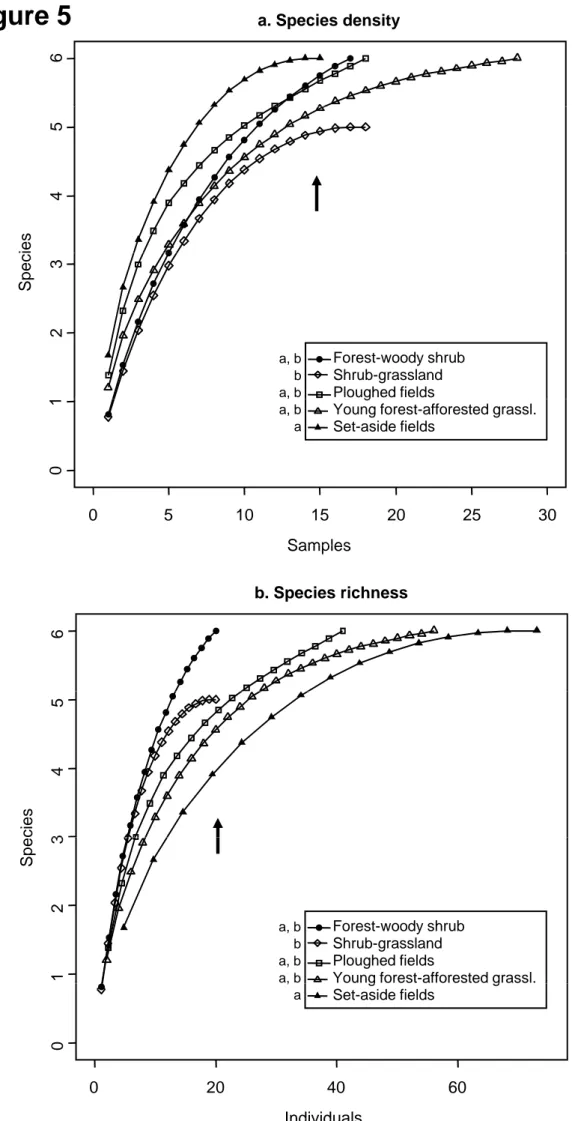
Figure 5 shows species density (Figure 5 A) and species richness (Figure 5 B) in the 5 assemblages. Species density was compared at 15 samples and species richness at 20 individuals. In both cases, the only significant difference was recorded between afforested set-aside fields and
shrub - grassland assemblages: species density of the afforested set-aside fields assemblage was higher (Sobs=6 [CI95%: 6-6] vs. Sobs=4.94 [4.90-4.98]
species), whereas the figure was reversed considering species richness (Sobs=3.91 [2.93-4.89] vs. Sobs=5 [5-5]). This was probably due to the much
higher relative abundance of species in the afforested set-aside fields
assemblage. The total number of species was therefore higher in the shrub – grassland assemblage than in the afforested set-aside fields assemblage.
Simpson diversity indices were compared at 15 samples (Figure 6). Three groups of assemblages were easily distinguished: (i) higher diversity in the forest - woody shrub (Simpson=4.77) and shrub – grassland
(Simpson=4.79) assemblages; (ii) intermediate diversity in the ploughed fields assemblage (Simpson=3.60); and (iii) lower diversity in the young forest - afforested grassland (Simpson=2.05) and afforested set-aside fields (1.85) assemblages.
Assemblage response: beta diversity
Figure 7 shows the clustering of assemblages. We set the critical level of distance at 0.3 because it led to identify 3 groups of assemblages relevant regarding the gradients of deforestation and afforestation: (i) forest – woody shrub; (ii) shrub – grassland; (iii) young forest – afforested grassland / ploughed fields / afforested set-aside fields. The afforested set-aside fields and ploughed fields assemblages were the less distant and the forest – woody shrub
assemblage was clearly distant from the other assemblages.
Discussion and conclusion
Limitations of the study
studies reported from this region. To the best of our knowledge, only one study to date related to small mammals of this area has been published in Chinese journals (Changyu 1991). This previous study failed to report in detail the stratification of small mammal species by habitat and instead has reported lists of trapped species in large regions. Here we present for the first time small mammal survey results in relation to land cover with an analysis at the community level. It is clear that a community assessment would be more complete if temporal variation was incorporated (e.g several species trapped in the present study have been described as potentially cyclic (i.e C.
longicaudatus), or belong to genera which include cyclic species, such as Ochotona (Smith and Foggin 1999, Giraudoux et al. 2006, Raoul et al. 2006).
But in the face of logistic constraints the present study represent a unique contribution to the current state of knowledge of small mammal community ecology in this part of China of which, at current, there exists far greater paucity of expertise than would be accepted in Europe or America. Trapping was
designed according to logistic constraints including habitats accessibility (roads …). Trap lines were therefore clustered in space in several locations. However, no spatial autocorrelation was detected in the model residuals, suggesting no bias from clustered sampling in the estimation of trapping probabilities. For similar reasons, some trap lines were set at a short distance from the habitat edge (although at least at 20 meters). One cannot therefore totally exclude a few temporary visitors of species with high mobility coming from neighbour habitats, potentially introducing a bias in assemblage definition.
The assemblage definition
Besides definitions based on topology and vegetation structure without reference to focal organisms, the concept of habitat can objectively be related
to the presence of a species or of a particular group of species (Hall et al. 1997, Baudry and Burel 1999). Habitat can thus be viewed as a subset of space characterised by a set of biological and physical resources favourable to the occupancy, survival and reproduction of a species (Hall et al. 1997) or of an assemblage of species. Few attempts have been made to define and classify habitats based on the presence of focal species assemblages (see Krasnov et al. (1996) for an example on small mammals). It is however at this level of biological organisation that the effect of landscape and habitat alteration can be measured. Delineation of small-mammal assemblages along a habitat gradient can be undertaken a priori on the basis of apparent changes in vegetation structure. However, this does not seem relevant since apparent changes in vegetation may not necessarily lead to drastic changes in assemblage structure and composition. Some authors (e.g Krasnov et al. 1996) have used similarity coefficients and hierarchical clustering to define a posterior habitat types based on small mammal species composition. Though more objective than a purely “visual” definition of assemblages (Giraudoux et al. 1998), the selection of a critical similarity threshold to define groups is still more or less subjective. We consider our modelling approach to provide objective assemblage definitions: it considers how well pooled a priori selected habitats explain the joint probability distribution of every species of concern. It objectively defines breaking points in more or less continuous gradients of species distribution. The approach
objectively removes subjectively identified thresholds in vegetation gradients when those thresholds provide little information relating to variations between different small-mammal assemblages. Each defined assemblage is therefore unique in terms of the joint probability distribution of the analysed species, i.e the redundancy reduction is relevant at the assemblage level. This approach has the additional advantage that it allows the inclusion and estimation of
effects of sampling-related factors such as trapping night or trap type when forming the assemblage definitions. Variables such as the proportion of habitats around trap lines or habitat structure might be included in the model if the aim was to measure the effect of landscape composition on assemblages. We are aware that information theory provides a relative measurement of model
goodness-of-fit: the first ranked model may simply be the least worse. However, the identified merges of a priori habitats appear to be ecologically relevant in relation to both their respective locations (forest vs. agriculture area) and the gradients of deforestation and afforestation.
Trapped small mammal species
Among all species trapped, S. cylindricauda and O. huangensis had never been reported in Ningxia: their current distribution, based on available information so far, covers the mountains of Central China (Shaanxi, Gansu, Qinghai and Sichuan) at least 100 km south of the study area (Zhang 1997). Given the doubtful taxonomic status of some species reported in atlases and the rather large spatial grain of their distribution maps, it seems hardly possible to determine with accuracy which species might have been missed by our
sampling design. One can however assume that only species being trap-shy or with very low densities have been undetected.
Forest practices and small-mammal assemblage response
Diversity of assemblages in afforested area was two times lower than that of assemblages in deforested area. We found no evidence of large effects of either deforestation or afforestation on species richness. Along with habitat effects described below, the difference in altitude, and the geographic distance between Liu Pan mountains and agricultural plain may also impact species distribution and induce differences in species composition among assemblages
of deforested and afforested areas. Deforestation has previously been shown to have a detrimental effect on small mammal richness in mountainous forests of central China (Giraudoux et al. 1998) and of Central Europe (Bryja et al. 2002), whereas no effect was observed in Madagascar forests (Scott et al 2006). Diversity was similar between forest and clearings in Central Europe forests (Bryja et al. 2002). In pine afforested areas of Yunnan, China, small mammal richness and diversity were higher in younger plantations (less than 15 years old) than in older ones (Men et al. 2006). Small mammal communities were not clearly differentiated among forest types in Malaysia (primeval forest, fallows and rubber plantation) except for new fallows where human-associated rats emerged (Nakagawa et al. 2006). Actually, these differences in species richness and diversity response patterns are likely to be the result of species-specific responses to forest vegetation-induced changes after disturbance and along succession gradients, as demonstrated by many authors (Etcheverry et al. 2005, Fisher and Wilkinson 2005, Men et al. 2006, Robitaille and Linley 2006, Scott et al. 2006). Richness and diversity responses to forest
management practices can therefore hardly be generalized but should be analysed considering both the vegetation structure and the ecology of small mammal species (e.g functional groups, habitat requirement). Here it was impossible to describe vegetation characteristics in detail for logistic reasons, and knowledge about the basic ecology of most Chinese small mammal species is crucially lacking. This study should therefore be taken as a preliminary
attempt to analyse the relationship between forest management and small mammals in this biogeographical area of China.
The higher diversity recorded in assemblages of the LiuPan mountains suggests that vegetation characteristics in those habitats offer a range of
lie on a deforestation gradient, but do not include agricultural or post-agricultural landcover. Density of small mammal species living in closed habitats such as forest (vs. opened short grassland) is generally low (Giraudoux et al. 1994, Raoul et al. 2001). However, the forest-woody shrub assemblage was clearly distinct from the shrub-grassland assemblage, and from the other assemblages, in terms of species composition. Apodemus peninsulae.and Sorex cylindricauda were specific to the forest-woody shrub assemblage. Apodemus peninsulae was already recorded in various kinds of primeval or secondary forests and in bushes in Heilongjiang, Jilin, Sichuan and Gansu provinces (Shu et al. 1987, Giraudoux et al. 1998, Wang et al. 2004), although Giraudoux et al. (1998) mention that this species can be sporadically trapped in farmland. However this species has been trapped in plantations in eastern and central China (Yang et al. 1993, Li et al. 2004, Liang and Li 2004). Interspecific competition leading to spatial segregation, and/or unfavourable habitat quality may explain the
absence of A. peninsulae in afforested habitats under study. Sorex
cylindricauda seems to be restricted to forests with a substantial shrub and
herbage cover at altitudes below 2500m (Wang et al. 2004).
The species composition of assemblages in ploughed fields and afforested areas were closely related. Cricetulus longicaudatus clearly dominated the afforested set-aside fields and the young forest – afforested grassland assemblages, thus decreasing the diversity of the assemblages. This species, widely distributed over the Loess plateau of central China (Wang 1990, Zhang 1997), can be present in many habitats although it is generally not found in dense forest (Giraudoux et al. 1998, and the present study). It is considered as a pest species in the grasslands of southern Gansu, due to its regular high population densities leading to severe loss in the corn harvest (Chen et al.
species’ optimal habitat to marginal habitat patch area (ROMPA) could influence the probability of multi-annual population outbreaks, through a combined effect of dispersal and predation. Recently afforested areas may therefore be optimal for Cricetulus longicaudatus and the high areal proportion of this habitat in the landscape of southern Ningxia might be favourable to sustain chronic or regular high population densities of this pest species. The problem of pest species in plantations is an issue discussed by Lindenmayer and Hobbs (2004).
The distribution of species abundance in the ploughed fields assemblage is more even, although the two species of Cricetinae (C. longicaudatus and T.
triton) seems to dominate. Dipus sagitta and Allactaga sibirica are typical
steppe, semi-desert and desert species (Wang 1990, Li and Wang 1996, Zhang 1997, Fu et al. 2005). Here they were trapped in ploughed fields and afforested set-aside fields, i.e the most degraded habitats regarding ground cover. These species were also recorded by Li et al. (2003) in the most degraded habitats of Qilian mountains (Gansu), ie. desert, semi-desert and overgrazed grassland, at similar altitude levels. Massive deforestation and agriculture intensification may have connected the desert area of northern Ningxia to the southern part of the region, allowing progressive southward colonization of semi-desert species in such degraded habitats.
Forest practices and species of conservation concern
Sorex cylindricauda and Eozapus setchuanus have been declared threatened
by IUCN (2006) and are both endemic to central China (Zhang 1997, Wilson and Reeder 2005). Sorex cylindricauda is listed Endangered (category EN B1+2c), because of its restricted distribution range and of a decline in the extent and quality of its habitat due to human encroachment. This species was only
recorded in the forest-woody shrub assemblage (one specimen caught in forest). Eozapus setchuanus is listed Vulnerable (category VU A1c), with identified major threats being habitat loss and degradation. This species was previously reported in the near LiuPan mountains (Changyu 1991), in mountain forests and shrubland resulting from deforestation in southern Gansu
(Giraudoux et al. 1998), and in Qiling mountains (Li and Wang 1996). This species was present in the assemblage characteristic of transitional habitats between forest and farmland. We could not demonstrate the presence of E.
setchuanus and S. cylindricauda in any of the assemblages described along the
afforestation gradient.
This study showed that habitats within a deforestation succession in this part of southern Ningxia sustain two distinct small mammal assemblages with a high diversity, each of them having a specific species composition and
containing species of conservation concern. The impact of deforestation on small-mammal assemblages and on threatened species is therefore complex and not necessarily negative. At the present stage of its process (maximum 15 years), afforestation in southern Ningxia does not seem to provide the habitat structure that would allow small mammal communities to display a high level of diversity. Afforested habitats indeed sustain assemblages which are dominated by agricultural pest species (C. longicaudatus), and no species of conservation concern seems to benefit from these habitats.
Acknowledgments
The authors express special thanks to Teng Jing and Yang Yurong of Ningxia Medical College who provided invaluable help in the field and for logistics, and to Jean-François Dobremez for plant species identification. We are grateful to the anonymous referees who helped to improve the manuscript. The research
described was supported by Grant Number RO1 TW001565 from the Fogarty International Center. The content is solely the responsibility of the authors and does not necessarily represent the official views of the Fogarty International Center or the National Institutes of Health.
References
Amori, G. and S. Gippoliti. 2001. Identifing priority ecoregions for rodent conservation at the genus level. Oryx 35: 158-165.
Baudry, J. and F. Burel. 1999. Ecologie du paysage. Concepts, méthodes et applications. Tec & Doc, Paris. pp. 359.
Bryja, J., M. Heroldova and J. Zejda. 2002. Effects of deforestation on structure and diversity of small mammal communities in the Moravskoslezske Beskydy Mts (Czech Republic). Acta Theriol. 47: 295-306.
Changyu, Q. 1991. On the faunistics and regionalization of Glires in Ningxia Autonomous Region, China. Acta Theriol. Sin. 11: 143-151.
Chao, A., R.L. Chazdon and T.-J. Shen. 2005. A new statistical approach for assessing similarity of species composition with incidence and abundance data. Ecol. Lett. 8: 148-159.
Chen, J.C., Z.Y. Yao and C.H. Liao. 1982. Report on the damage caused by rodent pest in the grassland of South Gansu, China. Chin. J. Zool. 3: 25. Colwell, R.K. 2005. EstimateS: Statistical estimation of species richness and shared species from samples. Version 7.5. User's Guide and application published at: http://purl.oclc.org/estimates.
Colwell, R.K., X.M. Chang and J. Chang. 2004. Interpolating, extrapolating, and comparing incidence-based species accumulation curves. Ecology 85: 2717-2727.
Corbet, G.B. 1978. The mammals of the Palearctic Region : a taxonomic
review. British Museum (Natural History), Cornell University Press, London, UK. pp. 314.
Cox, M.P., C.R. Dickman and J. Hunter. 2004. Effects of rainforest
fragmentation on non-flying mammals of the Eastern Dorrigo Plateau, Australia. Biol. Conserv. 115: 175-189.
Etcheverry, P., J.-P. Ouellet and M. Crête. 2005. Response of small mammals to clear-cutting and precommercial thinning in mixed forests of southeastern Quebec. Can. J. For. Res. 35: 2813-2822.
Feng, Z. and C. Zheng. 1985. Studies on the Pikas (genus Ochotona) of China. Acta Theriol. Sin. 5: 269-285.
Fisher, J.T. and L. Wilkinson. 2005. The response of mammals to forest fire and timber harvest in the North American boreal forest. Mammal. Rev. 35: 51-81. Fu, B.-J., G.-H. Liu, X.-K. Wang and Z.-Y. Ouyang. 2004. Ecological issues and risk assessment in China. Int. J. Sustain. Dev. World Ecol. 11: 143-149.
Fu, H., X. Wu and Z. Yang. 2005. Diversity of small mammals communities at different habitats in Alashan region, Inner Mongolia. Acta Theriol. Sin. 25: 32-38.
Giraudoux, P., P. Delattre, J.P. Quéré and J.P. Damange. 1994. Structure and kinetics of rodent populations in a region under agricultural land abandonment. Acta Oecol. 15: 385-400.
Giraudoux, P., D. Pleydell, F. Raoul, J.P. Quéré, Q. Wang, Y. Yang, D.A. Vuitton, J. Qiu, W. Yang and P.S. Craig. 2006. Transmission ecology of
Echinococcus multilocularis: What are the ranges of parasite stability among
various host communities in China? Parasitol. Int. 55: S237-S246.
Giraudoux, P., J.P. Quéré, P. Delattre, G. Bao, X. Wang, D. Shi, D. Vuitton and P.S. Craig. 1998. Distribution of small mammals along a deforestation gradient in south Gansu, China. Acta Theriol. 43: 349-362.
Gotelli, N.J. and R.K. Colwell. 2001. Quantifying biodiversity: Procedures and pitfalls in the measurement and comparison of species richness. Ecol. Lett. 4: 379-391.
Gromov, I.M. and I.Y. Polyakov. 1992. Voles (Microtinae). Fauna of the USSR, Mammals, Vol. III. Brill E.J., Publishing Company, Leiden, Germany. pp. 725. Hall, L.S., P.R. Krausman and M.L. Morrison. 1997. The habitat concept and a plea for standard terminology. Wildl. Soc. Bull. 25: 173-182.
Houghton, R.A. and J.L. Hackler. 2003. Sources and sinks of carbon land-use change in China. Global Biogeochem. Cy. 17: 1034-1052.
IUCN. 2006. 2006 IUCN Red List of Threatened Species.
Http://www.iucnredlist.org. Downloaded on 23 june 2006.
Johnson, R., J.W.H. Ferguson, A.S. Van Jaarsveld, G.N. Bronner and C.T. Chimimba. 2002. Delayed responses of small-mammal assemblages subject to afforestation-induced grassland fragmentation. J. Mammal. 83: 290-300.
Kelt, D.A. 2000. Small mammal communities in rainforest fragments in central southern Chile. Biol. Conserv. 92: 345-358.
Krasnov, B., G. Shenbrot, I. Khokhlova and E. Ivanitskaya. 1996. Spatial
patterns of rodent communities in the Ramon erosion cirque, Negev Highlands, Israel. J. Arid Environ. 32: 319-327.
Lang, G. 2002. Forests, floods, and the environmental state in China. Organization and Environment 15: 109-130.
Legendre, P. and L. Legendre. 1998. Numerical Ecology. Elsevier, Amsterdam. pp. 853.
Li, H., Z. Zhang, Y. Wang, F. Wang and X. Cao. 2004. Small rodents
community composition and seasonal changes of their dominant populations in Dongling Mountain. Acta Theriol. Sin. 24: 215-221.
Li, J.S., Y.L. Song and Z.G. Zeng. 2003. Elevational gradients of small mammal diversity on the northern slopes of Mt. Qilian, China. Glob. Ecol. Biogeogr. 12: 449-460.
Li, X. and T. Wang. 1996. An analysis of the relationship between ecology factors and the number of species of rodents in Shaanxi district. Acta Theriol. Sin. 16: 129-135.
Liang, J. and J. Li. 2004. Seasonal fluctuations of the small mammals community in plantation of Yan'an. Acta Theriol. Sin. 24: 322-328. Lidicker, W.Z. 1985. Population structuring as a factor in understanding microtine cycles. Acta Zool. Fennica 173: 23-27.
Lidicker, W.Z. 1988. Solving the enigma of microtine "cycles". J. Mamm. 69: 225-235.
Lidicker, W.Z. 2000. A food web / landscape interaction model for microtine rodent density cycles. Oikos 91: 435 - 445.
Lindenmayer, D.B. and R.J. Hobbs. 2004. Fauna conservation in Australian plantation forests - A review. Biol. Conserv. 119: 151-168.
Magurran, A.E. 2004. Measuring biological diversity. Blackwell Publishing. pp. 256.
McCullagh, P. and J. Nelder. 1989. Generalized Linear Models. Chapman and Hall, London. pp. 511.
Men, X.-Y., X.-G. Guo, E.N. Yardim, W.-G. Dong and T.-J. Qian. 2006.
Relationship between small mammal community and ecological factors of pine plantations in Dali, Yunnan Province. Acta Zool. Sin. 52: 215-223.
Moser, B.W., M.J. Pipas, G.W. Witmer and R.M. Engeman. 2002. Small
mammal use of hybrid poplar plantations relative to stand age. Northwest. Sci. 76: 158-165.
Nakagawa, M., H. Miguchi and T. Nakashizuka. 2006. The effects of various forest uses on small mammal communities in Sarawak, Malaysia. For. Ecol. Manag. 231: 55-62.
Pardini, R. 2004. Effects of forest fragmentation on small mammals in an atlantic forest landscape. Biodivers. Conserv. 13: 2567-2586.
Pardini, R., S. Marques de Souza, R. Braga-Neto and J.-P. Metzger. 2005. The role of forest structure, fragment size and corridors in maintaining small
mammal abundance and diversity in an Atlantic forest landscape. Biol. Conserv. 124: 253-266.
R-Development-Core-Team. 2005. R: A language and environment for
statistical computing. R Foundation for Statistical Computing, Vienna, Austria. ISBN 3-900051-07-0, URL http://www.R-project.org.
Raoul, F., R. Defaut, D. Michelat, M. Montadert, D. Pépin, J.P. Quéré, B. Tissot, P. Delattre and P. Giraudoux. 2001. Landscape effects on the populations dynamics of small mammal communities and prey-resource variations: a preliminary analysis. Rev. Ecol. (Terre Vie) 56: 339-352.
Raoul, F., J.P. Quéré, D. Rieffel, N. Bernard, K. Takahashi, R. Scheifler, Q. Wang, J. Qiu, W. Yang, P.S. Craig, A. Ito and P. Giraudoux. 2006. Distribution of small mammals in a pastoral landscape of the Tibetan plateaus (Western Sichuan, China) and relationship with grazing practices. Mammalia 3-4: 214-225.
Robitaille, J.-F. and R.D. Linley. 2006. Structure of forests used by small mammals in the industrially damaged landscape of Sudbury, Ontario, Canada. For. Ecol. Manag. 225: 160-167.
Schmid-Holmes, S. and L.C. Drickamer. 2001. Impact of forest patch
characteristics on small mammal communities: A multivariate approach. Biol. Conserv. 99: 293-305.
Scott, D.M., D. Brown, S. Mahood, B. Denton, A. Silburn and F.
Rakotondraparany. 2006. The impacts of forest clearance on lizard, small mammal and bird communities in the arid spiny forest, southern Madagascar. Biol. Conserv. 127: 72-87.
Shu, F.M., K.X. Yang, C.Y. Li, Y. Gao and Q. Dong. 1987. Rodents under the different secondary vegetation after deforestation. Acta Theriol. Sin. 7: 236-237. Silva, M., L. Hartling and S.B. Opps. 2005. Small mammals in agricultural
landscapes of Prince Edward Island (Canada): Effects of habitat characteristics at three different spatial scales. Biol. Conserv. 126: 556-568.
Smith, A.T. and J.M. Foggin. 1999. The plateau pika (Ochotona curzoniae) is a keystone species for biodiversity on the Tibetan plateau. Anim. Conserv. 2: 235-240.
Smith, A. and Y. Xie. 2008. A Guide to the Mammals of China. Princeton University Press. pp. 576.
Swofford, D.L. 2003. PAUP*. Phylogenetic Analysis Using Parsimony (*and Other Methods). Sinauer Associates, Sunderland, Massachusetts.
Thompson, I.D., J.A. Baker and M. Ter-Mikaelian. 2003. A review of the long-term effects of post-harvest silviculture on vertebrate wildlife, and predictive models, with an emphasis on boreal forests in Ontario, Canada. For. Ecol. Manag. 177: 441-469.
Venables, W.N. and B.D. Ripley. 2002. Modern Applied Statistics with S. Springer, New-York. pp. 501.
Wang, J., S. Liu, J. Ran, C. Wang, L. Shen, P. Jiang and C. Guo. 2004. Effects of annual net primary productivity of forest ecosystem and habitat complexity on species diversity of small mammals. Acta Theriol. Sin. 24: 298-303.
Wang, S. 1990. On the fauna and the zoogeographical regionization of Glires (including rodents and lagomorphs) in Shaanxi province. Acta Theriol. Sin. 10: 128-136.
Wang, Y. 2004. Environmental degradation and environmental threats in China. Environ. Monit. Assess. 90: 161-169.
Wenhua, L. 2004. Degradation and restoration of forest ecosystems in China. For. Ecol. Manag. 201: 33-41.
Wilson, D.E. and D.M. Reeder. 2005. Mammals species of the World: a taxonomic and geographic reference. Smithsonian Institution Press, Washington, Londres. pp. 1207.
Yang, C., R. Chen, Z. Dong and R. Zhao. 1993. A study of the rodent
community succession in Huangnihe forest region. Acta Theriol. Sin. 13: 205-210.
Yu, N., C. Zheng, Y. Zhang and W. Li. 2000. Molecular systematics of pikas (Genus Ochotona) inferred from mitochondrial DNA sequences. Mol.
Phylogenet. Evol. 16: 85-95.
Zhang, Y. 1997. Distributions of mammalian species in China. China Forestry Publishing House, under the Patronage of CITES management authority of China. pp. 280.
Tables
Table 1: Habitat description and standard trapping sampling pressure (bbbt: big break-back traps, sbbt: small break-back traps).
283 735 4 10 bbbt sbbt A more advanced stage of planted forest on former
terraces dominated by Poplar sp., presence of Pinus sp.,
Picea sp., Abies sp., shrubs (Potentilla
sericea/microphylla). Grassland cover (Achillea cf. macrophylla, Raphanus sativus, Setaria cf. violacea, Artemisia cf. brevifolia, Erigeron cf. bellidioides).
Maximum height was 4 m Young forest 250 735 4 10 bbbt sbbt Short grasslands left ungrazed and recently planted
mainly with Poplar sp. trees less than 2 m high Afforested grasslands 250 687 4 11 bbbt sbbt Set-aside fields recently planted mainly with Poplar sp.
Tree height less than 2 m, herbaceous cover (maximum 40 cm high, Saussurea fastuosa, Saussurea cf. uniflora,
Indigofera heterautha, Setaria cf. violacea) ranging from
30% to 100% Afforested set-aside fields 263 689 6 12 bbbt sbbt Mainly potatoes and maize
Ploughed fields 135 407 3 10 bbbt sbbt Graminaceous and herbaceous grassland (maximum 50
cm high, Aster cf. diplostephloides, Vicia tenuifolia,
Melilotus officinalis, Fragaria nubicola) on lower hill
slopes Tall grassland 25 146 1 4 bbbt sbbt Continuous cover of low shrub and scrub (maximum 1 m high) and grass
Non-woody shrub 150 391 2 6 bbbt sbbt Continuous cover of shrub (1-2 m high, Sorbus foliolosa,
Cotoneaster sp., Hippophae salicifolia, Holboellia latifolia)
and grass. Spatially connected to forests Woody shrub 150 525 2 7 bbbt sbbt Secondary forests dominated by larch Larix sp. (10-20 m high); shrub cover around 80% (maximum 1 m high) Forest Number of trap nights Number of trap lines Trap type
Description and main plant species Habitat 283 735 4 10 bbbt sbbt A more advanced stage of planted forest on former
terraces dominated by Poplar sp., presence of Pinus sp.,
Picea sp., Abies sp., shrubs (Potentilla
sericea/microphylla). Grassland cover (Achillea cf. macrophylla, Raphanus sativus, Setaria cf. violacea, Artemisia cf. brevifolia, Erigeron cf. bellidioides).
Maximum height was 4 m Young forest 250 735 4 10 bbbt sbbt Short grasslands left ungrazed and recently planted
mainly with Poplar sp. trees less than 2 m high Afforested grasslands 250 687 4 11 bbbt sbbt Set-aside fields recently planted mainly with Poplar sp.
Tree height less than 2 m, herbaceous cover (maximum 40 cm high, Saussurea fastuosa, Saussurea cf. uniflora,
Indigofera heterautha, Setaria cf. violacea) ranging from
30% to 100% Afforested set-aside fields 263 689 6 12 bbbt sbbt Mainly potatoes and maize
Ploughed fields 135 407 3 10 bbbt sbbt Graminaceous and herbaceous grassland (maximum 50
cm high, Aster cf. diplostephloides, Vicia tenuifolia,
Melilotus officinalis, Fragaria nubicola) on lower hill
slopes Tall grassland 25 146 1 4 bbbt sbbt Continuous cover of low shrub and scrub (maximum 1 m high) and grass
Non-woody shrub 150 391 2 6 bbbt sbbt Continuous cover of shrub (1-2 m high, Sorbus foliolosa,
Cotoneaster sp., Hippophae salicifolia, Holboellia latifolia)
and grass. Spatially connected to forests Woody shrub 150 525 2 7 bbbt sbbt Secondary forests dominated by larch Larix sp. (10-20 m high); shrub cover around 80% (maximum 1 m high) Forest Number of trap nights Number of trap lines Trap type
Description and main plant species Habitat
Table 2: Number of individuals (N) of each trapped species.
Family Subfamily
Genus species N
Cricetidae Subfamily Arvicolinae
Eothenomys sp. 7
Subfamily Cricetinae
Cricetulus longicaudatus (Milne-Edwards, 1867)
Long-tailed dwarf hamster 117
Cricetulus sp.(a) 1
Tscherskia triton (de Winton, 1899)
Greater long-tailed hamster 41
Muridae Subfamily Murinae
Apodemus agrarius (Pallas, 1771)
Striped field mouse 20
Apodemus peninsulae (Thomas, 1907)
Korean field mouse 7
Apodemus sp.(a) 1
Mus musculus Linnaeus, 1758
House mouse 25
Niviventer confucianus (Milne-Edwards, 1871)
Confucian niviventer 1
Rattus rattus (Linnaeus, 1758)
Roof rat 4
Dipodidae Subfamily Zapodinae
Eozapus setchuanus (Pousargues, 1896)
Chinese jumping mouse 3
Subfamily Dipodinae
Dipus sagitta (Pallas, 1773)
Northern three-toed jerboa 9 Subfamily Allactaginae
Allactaga sibirica (Forster, 1778)
Mongolian five-toed jerboa 1
Sciuridae Subfamily Xerinae
Spermophilus alashanicus ( Büchner, 1888) / dauricus ( Brandt, 1843)
Alashan / Daurian ground squirrel 6
Spalacidae Subfamily Myospalacinae
Eospalax fontanierii (Milne-Edwards, 1867)
Chinese zokor 10
Ochotonidae Ochotona dauurica (Pallas, 1776)
Daurian pika 6
Ochotona huangensis ( Matschi, 1908)
Tsing-Ling pika 3
Soricidae Subfamily Soricinae
Sorex cylindricauda Milne-Edwards, 1872
Stripe-backed shrew 1
Unidentified 2
Table 3: Comparison of all possible candidates models prior to redundancy reduction. Covariates contributions are assessed by the AIC obtain after
including them in the multinomial model. Delta AIC (∆i) provides the distance to the most explanatory model.
225.709 552.965 night 98.362 2425.618 habitat 23.01 2350.266
trap-type + night + habitat
0 2327.256 trap-type + habitat 108.976 2436.232 trap-type 206.376 2533.632 1 128.672 2455.928 trap-type + night 121.827 2449.083 night + habitat ∆i AIC Model (Covariates) 225.709 552.965 night 98.362 2425.618 habitat 23.01 2350.266
trap-type + night + habitat
0 2327.256 trap-type + habitat 108.976 2436.232 trap-type 206.376 2533.632 1 128.672 2455.928 trap-type + night 121.827 2449.083 night + habitat ∆i AIC Model (Covariates)
Figure captions
Figure 1: Location of the three study areas in Southern Ningxia Hui
Autonomous Region. Black spots show trapping locations in each study area. Figure 2: Species rarefaction curve for the whole study area (Sobs) and curves of
three total richness estimators (asymptotic Michaelis-Menten equation, and Chao 1 and Jackknife 2 nonparametric estimators).
Figure 3: Diagram of the habitat re-classification along deforestation and afforestation gradients using the multinomial redundancy reduction procedure.
A posterior classes are distinct in terms of their joint probability distributions and
therefore used to define different assemblages. δAIC: relates to the information gain obtained from each class merge (see section 2.4.1).
Figure 4: Multinomial model predictions of species trapping probabilities of the 5 assemblages. (*): combined habitat classes resulting from the merging
procedure. Dotted lines: big break back traps, full lines: small break back traps, no line: species not present in the assemblage. Apag: Apodemus agrarius; Appe: Apodemus peninsulae; Crlo: Cricetulus longicaudatus; Disa: Dipus
sagitta; Eose: Eozapus setchuanus; Eosp: Eothenomys sp.; Mumu: Mus musculus; Nico: Niviventer confucianus; Ocda: Ochotona dauurica; Ochu: Ochotona huangensis; Socy: Sorex cylindricauda; Spld: Spermophilus alashanicus/dauricus; Tstr: Tscherskia triton.
Figure 5: Comparison of species density (number of species per a given
number of trap lines; A) and richness (number of species per a given number of animals trapped; B) among assemblages using rarefaction curves. Black
arrows: assemblages are compared at 15 samples (species density) and at 20 individuals (species richness). The letters accompanying the legend indicate
significantly different species richness and densities at the considered number of individuals and samples (arrows).
Figure 6: Comparison of species diversity (Simpson index) among assemblages using rarefaction curves. Black arrow: assemblages are compared at 15
samples. Forest-woody shrub and Shrub-grassland curves are superimposed. Figure 7: Dendrogram from the cluster analysis on the distance among
assemblages, using Chao-Jaccard modified index and complete linkage agglomerative clustering method.
Figure 2
20 15 s 5 10 Specie s Sobs 0 5 Michaelis-Menten Chao1 Jackknife2 0 20 40 60 80 100 SamplesFigure 3
Deforestation gradient Afforestation gradient
Forest Woody shrub Non-woody shrub Tall grassland Ploughed fields Afforested set-aside fields Afforested grassland Young forest A priori habitat classification Shrub grassland Step 1 δAIC=-19.3 Merging procedure Shrub - grassland Step 2
Forest - Woody shrub
δAIC=-15.8 A posterior Step 3 Young forest -afforested grassl. δAIC=-12.5 Pl h d Afforested t id Y f t A posterior habitat classification Ploughed fields set-aside fields Shrub - grassland
Forest - woody shrub
Young forest -afforested grassl.
Figure 4
Forest - woody shrub (*) Shrub - grassland (*)
p
ping probability
p
ping probability
Apag Appe Crlo Disa Eose Eosp Mumu Nico Oc
da Oc hu Socy Spld Ts tr Species Tra p Tra p
Apag Appe Crlo Disa Eose Eosp Mumu Nico Oc
da Oc hu Socy Spld Ts tr Species
Afforested set-aside fields Ploughed fields b ility b ility Trapp in g proba b Trapp in g proba b
Young forest - afforested grassland (*)
Apag Appe Crlo Disa Eose Eosp Mumu Nico Oc
da Oc hu Socy Spld Ts tr Species
Apag Appe Crlo Disa Eose Eosp Mumu Nico Oc
da Oc hu Socy Spld Ts tr Species T rapping probability T da hu tr
Figure 5
6 a. Species density 45 ies a, b a, b b 23 Spec Forest-woody shrub Shrub-grassland Ploughed fields a a, b 0 5 10 15 20 25 30 01 Samples gYoung forest-afforested grassl. Set-aside fields Samples 6 b. Species richness 3 45 cies 12 3 Spe a, b a, b b a, b Forest-woody shrub Shrub-grassland Ploughed fields
Young forest-afforested grassl.
0
a
, g g
Figure 6
Alpha diversity (Simpson)
5 6 4 d iversity 23 Simpson d 01 Forest-woody shrub Shrub-grassland Ploughed fields
Young forest-afforested grassl. Set-aside fields
0 5 10 15 20 25 30