Publisher’s version / Version de l'éditeur:
ASHRAE Transactions, 110, Pt. 1, pp. 652-665, 2004-11-01
READ THESE TERMS AND CONDITIONS CAREFULLY BEFORE USING THIS WEBSITE. https://nrc-publications.canada.ca/eng/copyright
Vous avez des questions? Nous pouvons vous aider. Pour communiquer directement avec un auteur, consultez la
première page de la revue dans laquelle son article a été publié afin de trouver ses coordonnées. Si vous n’arrivez pas à les repérer, communiquez avec nous à [email protected].
Questions? Contact the NRC Publications Archive team at
[email protected]. If you wish to email the authors directly, please see the first page of the publication for their contact information.
NRC Publications Archive
Archives des publications du CNRC
This publication could be one of several versions: author’s original, accepted manuscript or the publisher’s version. / La version de cette publication peut être l’une des suivantes : la version prépublication de l’auteur, la version acceptée du manuscrit ou la version de l’éditeur.
Access and use of this website and the material on it are subject to the Terms and Conditions set forth at
Full scale fire tests for cables in plenums
Lougheed, G. D.; McCartney, C. J.; Kanabus-Kaminska, J. M.
https://publications-cnrc.canada.ca/fra/droits
L’accès à ce site Web et l’utilisation de son contenu sont assujettis aux conditions présentées dans le site
LISEZ CES CONDITIONS ATTENTIVEMENT AVANT D’UTILISER CE SITE WEB.
NRC Publications Record / Notice d'Archives des publications de CNRC: https://nrc-publications.canada.ca/eng/view/object/?id=48545ba8-d88e-48ac-bce0-0af38413725b https://publications-cnrc.canada.ca/fra/voir/objet/?id=48545ba8-d88e-48ac-bce0-0af38413725b
Full-scale fire tests for cables in plenums
Lougheed, G.D.; McCartney, C.;
Kanabus-Kaminska, M.
NRCC-47360
A version of this document is published in / Une version de ce document se trouve dans :
ASHRAE Transactions, v. 110, pt. 1, 2004, pp. 652-665
FULL-SCALE FIRE TESTS FOR CABLES IN PLENUMS G.D. Lougheed, C. McCartney and M. Kannabus-Kaminska National Research Council
ABSTRACT
In a joint research project involving ASHRAE and the National Research Council Canada (RP 1108), the effect of fires involving communication cable installed in air-handling plenums was investigated. The project included surveys in North American office buildings to determine the type and quantities of cable in return air plenum and fire scenarios that could potentially ignite the cables. It also included fire tests performed at three scales: small, medium and full. The bench-scale tests were conducted using a cone calorimeter. In addition, medium-scale tests were conducted using a modified standard room fire test facility. Tests conducted in this facility were used to determine the behaviour of communications cable with exposure to air heated to 200, 325 and 450°C as well as direct flame impingement. Finally, a series of full-scale fire tests were conducted in a full-scale facility set-up specifically for this project. Tests in this facility were used to determine the behaviour of communication cables in plenums with fully-developed fires in the compartment below the plenum. In this paper, data from the tests are used to investigate the potential effect of fires involving cables in plenum spaces on the hazard to building occupants in compartments contaminated by smoke distributed through a building HVAC system.
FULL-SCALE FIRE TESTS FOR CABLES IN PLENUMS G.D. Lougheed, C. McCartney and M. Kannabus-Kaminska National Research Council
INTRODUCTION
The use of ceiling voids for unducted return ventilation air is an increasingly common practice in modern commercial buildings (Clarke et al 1993). It is also common practice to route communication cables through hidden voids in buildings. In those cases in which the void space is also used as part of the normal HVAC system, there is the potential, in the case of a cable fire, to spread heat and smoke to inhabited parts of the building.
With the rapid increase in computer-based information technology, there is a
corresponding rise in the demand for cabling to support it. It is estimated that computer usage is increasing at a rate of 20% per year and Local Area Networks (LAN) are recabled
approximately every 3 years (Fardell 1998). This new cabling may be installed over multiple layers of older cables potentially resulting in high fuel-load in concealed spaces.
The potential increase in cable loads in plenums resulting from the increased use of computers and re-cabling of LAN networks has raised concerns in the regulatory community (Clarke and Gewain 2000). Specific concerns regarding the potential impact on life safety of exposed LAN cables installed in above ceiling return air plenums resulted in ASHRAE initiating a research project with the National Research Council Canada.
The project on cable fires in plenums (RP-1108) included fire tests performed at three scales: small, medium and full. The bench-scale tests using both new and used
communication cables were conducted using a cone calorimeter. These tests were used to select representative cables for the medium and full-scale tests. Medium-scale tests were conducted using a modified standard room fire test facility. Tests conducted in this facility were used to determine the behaviour of communications cable under a range of simulated fire conditions that could occur in non-ducted air handling ceiling plenums. Finally, a series of full-scale fire tests were conducted in a full-full-scale facility set-up specifically for this project. Tests in this facility were used to determine the behaviour of communication cables in plenums with fully-developed fires in the compartment below the plenum.
In this paper, the results of the bench, medium and full-scale fire tests are used to investigate the potential effect of fires involving cables in plenum spaces on the hazard to building occupants in a target compartment contaminated by smoke distributed through a building HVAC system.
CONE CALORIMETER TESTS
There is a broad range of data communication cables available in the North American market. Bench scale tests were conducted using a cone calorimeter to provide an initial evaluation of the fire performance of representative cables.
The bench scale tests were conducted using the ASTM E 1354 cone calorimeter (ASTM 1997) with a heat flux of 50 kW/m2. Specimen mass loss and smoke production was recorded. Any gases produced were sampled and analyzed using standard gas analyzers for O2, CO and CO2 to determine the heat release rate. In addition, the combustion gases were analyzed using an FTIR spectrometer to measure other combustion by-products including HF and HCl.
For the cone tests, the cable was cut into 100 mm lengths. These cable lengths were placed side by side on a metal wire mesh in the cone calorimeter holder. The ends of the cables were unsealed.
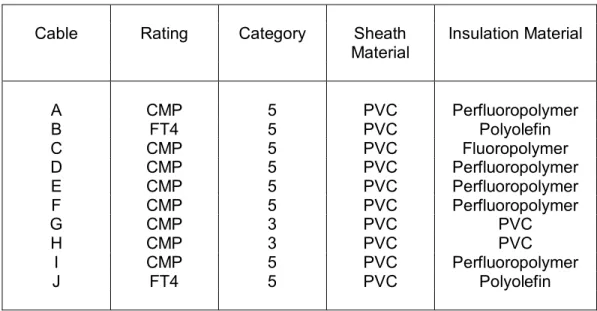
Ten cable types were purchased on the open market. The characteristics of the cables are summarized in Table 1. Each cable is referenced by a letter designation.
Table 1. Characteristics of new communication cables.
Cable Rating Category Sheath
Material Insulation Material A CMP 5 PVC Perfluoropolymer B FT4 5 PVC Polyolefin C CMP 5 PVC Fluoropolymer D CMP 5 PVC Perfluoropolymer E CMP 5 PVC Perfluoropolymer F CMP 5 PVC Perfluoropolymer G CMP 3 PVC PVC H CMP 3 PVC PVC I CMP 5 PVC Perfluoropolymer J FT4 5 PVC Polyolefin
Tests were also conducted with previously used cables removed from buildings during refurbishment. The results for these cables were comparable to those for the new cables (Lougheed, Kanabus-Kaminska and McCartney 2004a). For this paper, the results for only the new cables are used for the hazard analysis discussed in the next section of the paper.
The cables were selected from the major North American manufacturers to represent a cross-section of cable types and ratings presently used in office buildings. The cables tested included 8 that were labeled as CMP and thus meeting the requirements for use in air handling plenums in the US and some jurisdictions in Canada. In addition, two cables were labeled as FT4 meeting the requirements for the remaining jurisdictions in Canada.
The information on the sheathing and insulation materials provided in Table 1 is based on the test results. Specifically, the FTIR measurements provided information on the production of various gases that would typically be produced by PVC, fluoropolymer and perfluoropolymer based materials.
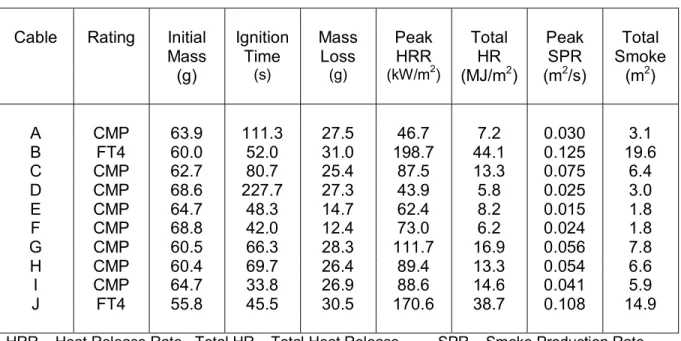
A summary of the cone calorimeter results for each cable is provided in Table 2. The results provided in the table are the average of three tests.
Table 2. Summary cone calorimeter results with 50 kW/m2 exposure for new cables.
Cable Rating Initial Mass Ignition Time Mass Loss Peak HRR Total HR Peak SPR Total Smoke (g) (s) (g) (kW/m2) (MJ/m2 ) (m2/s) (m2) A CMP 63.9 111.3 27.5 46.7 7.2 0.030 3.1 B FT4 60.0 52.0 31.0 198.7 44.1 0.125 19.6 C CMP 62.7 80.7 25.4 87.5 13.3 0.075 6.4 D CMP 68.6 227.7 27.3 43.9 5.8 0.025 3.0 E CMP 64.7 48.3 14.7 62.4 8.2 0.015 1.8 F CMP 68.8 42.0 12.4 73.0 6.2 0.024 1.8 G CMP 60.5 66.3 28.3 111.7 16.9 0.056 7.8 H CMP 60.4 69.7 26.4 89.4 13.3 0.054 6.6 I CMP 64.7 33.8 26.9 88.6 14.6 0.041 5.9 J FT4 55.8 45.5 30.5 170.6 38.7 0.108 14.9
HRR – Heat Release Rate Total HR – Total Heat Release SPR – Smoke Production Rate
The test results (Table 2) indicate that there is a wide variation in the performance of the ten communication cables. However, based on total heat output, the communication cables can be grouped as follows:
• Group 1 (Cables A, D, E, F) had total heat outputs of 5.8 – 8.2 MJ/m2. All the cables in this group used perfluoropolymer materials as the cable insulation.
• Group 2 (Cables C, G, H and I) had total heat outputs of 13.3 – 16.9 MJ/m2
. The cables in this group used a variety of materials for the cable insulation including PVC (Cables G and H), fluoropolymer (Cable C) and perfluoropolymer (Cable I).
• Group 3 (Cables B and J) had total heat outputs of 38.7 – 44.1 MJ/m2
. These were the two FT4 cables that used polyolefin materials for the insulation.
The lowest total heat outputs were for the Group 1 cables and the Group 3 cables had the highest heat outputs.
The smoke production rates for the cables were measured using a He-Ne laser based system. As with the heat release rates, the smoke release rate results were similar for the cables within a Group. There was, however, a difference in the amount of smoke produced by the cables in the different groups. The total smoke produced by the cables in Group 1 was 1.8-3.1 m2 compared with 5.9-7.8 m2 for the cables in Group 2 and 14.9-19.6 m2 for those in Group 3 (Table 2).
Gas samples were extracted from the exhaust duct for analysis using an FTIR
spectrometer. The FTIR was calibrated with gas standards for CO2, CO, HCl, HF and COF2.
Using these calibrations, the FTIR spectra were analyzed to provide time-dependent measurements for the gas concentrations produced in the tests.
Figure 1 shows the heat release rate, smoke production and gas species results for the tests with Cable D. For the communication cables, three acid gases (HCl, HF and COF2) were
found in addition to CO and CO2 that are produced when carbon based materials are burned. HCl was measured in the tests for all ten cables. For most cables, the HCl was from the PVC used as the sheathing material. However, for Cables G and H, PVC was used as the insulation material and higher HCl concentrations were measured for these cables.
Time (s) 0 100 200 300 400 500 G a s co nc ent ra ti on ( p p m ) 0 200 400 600 800 1000 1200 He at r e le as e r a te ( k W /m 2 ) 0 50 100 150 200 S m o k e pr od uc ti o n ra te ( m 2 /s) 0.00 0.02 0.04 0.06 0.08 0.10 0.12 0.14 0.16 HCl HF CO COF2 HRR SPR
Figure 1. Cone calorimeter results for Cable D.
HF was measured for those cables that used flouropolymer or perflouropolymer
materials as the insulation material. This included Cables A, C, D, E, F and I (Table 1). No HF was measured for the other four cables that used polyolefin or PVC as the insulation material.
COF2 was measured for those cables that used a perflouropolymer as the insulation material. These were Cables A, D, E, F and I.
The cone calorimeter tests were conducted in the open with ambient levels of oxygen in the combustion air. For most materials, CO production is limited under such conditions. However, CO was produced in the tests with the communication cables.
The FTIR results were used to determine the total yields of CO2, CO, HCl, HF and COF2
produced in the tests. A mass balance calculation was carried out and indicated that 75-90% of the mass loss was accounted for by these five gases (Lougheed, Kanabus-Kaminska and McCartney 2004a). The mass balance calculation does not include the mass loss as soot, H2O, volatile organic compounds (acrolein, benzene, toluene, etc.) and other minor components.
HAZARD COMPARISON USING BENCH SCALE DATA
The potential impact of the various gases and smoke is dependent on the volume into which they are distributed (Babrauskas 2000). For the analysis in this section of the paper, a volume of 15 m3
was selected. This is the approximate volume of air that flows through the cone calorimeter exhaust system in 600 s. This volume is also representative of a small room with dimensions of 2 m by 3 m by 2.5 m in height.
One evaluation of the toxic fire hazard can be determined using the Fracitional Effective Dose (FED) principle (Babrauskas 2000, Purser 2002, Klote and Milke 2002). This approach assumes that the toxic effects are linearly additive. The expression used for the present calculations was: 750 ] [ 2000 ] [ 3700 ] [ 3000 ] [CO HCl HF COF2 FED= + + + (1)
where the terms in brackets denote the individual gas concentrations (ppm) and the denominators represent the LC50 values for the same gases. The LC50 concentrations are assumed 30-min concentrations for man (Babrauskas 1997, Klote and Milke 2002). A FED of 1 is the level that is lethal for the average occupant. The FED values calculated for the new communication cables using Equation 1 are provided in Table 3.
As shown in Figure 1, the gas species were produced at different times during the test. The hazard calculation in this section assume that the total mass of all the gas species and smoke are mixed together in the selected volume. The calculation using Equation 1 provides an estimate of the relative hazard of the smoke produced from the cables based on the
hypothetical volume and the selected criteria.
Table 3. Calculated FED, FEC and visibility for new communication cables.
Cable FED FEC Visibility Visibility
K = 8 K = 3 (m) (m) A 0.207 0.495 38.7 14.5 B 0.121 0.252 6.1 2.3 C 0.149 0.336 18.8 7.0 D 0.215 0.553 40.0 15.0 E 0.098 0.234 66.7 25.0 F 0.229 0.556 66.7 25.0 G 0.116 0.350 15.4 5.8 H 0.133 0.328 18.2 6.8 I 0.200 0.392 20.3 7.6 J 0.072 0.117 8.1 3.0
The FED values for the new communication cables were similar for the three groups of cables tested. Group 1 cables had FED values in the range of 0.098-0.229 compared with 0.116-0.200 and 0.072-0.121 for Group 2 and 3 cables, respectively. However, Cable E in Group 1 had better performance under the test conditions and had a relatively low FED
compared to the other cables in this group. As a general trend, the lowest FED values were for the Group 3 cables and the highest for the Group 1 cables.
The work by Jin (1976) and others showed that the presence of irritant gases could have a substantial effect on the ability of people to safely evacuate. The effects of irritant gases in
terms of sensory/upper respiratory and, to some extent pulmonary irritation can be assessed using the Fractional Effective Concentration (FEC) concept (Purser 2002). The expression used for the present calculations was:
190 ] [ 900 ] [ 900 ] [HCl HF COF2 FEC= + + (2)
where the terms in brackets denote the individual gas concentrations (ppm) and the denominators represent the irritant gas concentrations (ppm) that are expected to cause
incapacitation in half the population (Purser 2002). The concentrations used in the denominator for HCl and HF are from Purser (2002). The analogous concentration for COF2 is a hypothetical value determined by reducing the LC50 value by a factor of approximately 4 (Babrauskas 1997). A FEC of 1 is assumed to be the level at which the average occupant would be incapacitated by the irritant gases. The FEC values calculated for the new communication cables are provided in Table 3.
The FEC values were similar for the three groups of cables (Group 1 with 0.234-0.556; Group 2 with 0.328- 0.392; and Group 3 with 0.117-0.252). As with the FED values, Cable E had a relatively low FEC value compared with the other cables in Group 1 (0.234 versus 0.5). Otherwise, the general trend was for Group 1 to have the highest FEC value and Group 3 the lowest.
A FED of 1 is the level lethal to the average occupant and a FEC of 1 is the level at which the irritant gases would incapacitate the average occupant. In the context of fire
scenarios, it is generally recommended that a threshold criteria of 0.3 be used (Purser 2002). At this level, it is expected that approximately 11.4% of the population will be susceptible to the exposure.
The FED values for the smoke produced from the communication cables were 0.07 - 0.23. As such, the gas mixture in the hypothetical room would not affect most of the population for a 30-min exposure. However, the FEC values were 0.12 - 0.56. The irritant gases in the smoke produced from the communication cables with higher FEC values could incapacitate some building occupants.
The other concern with smoke is the effect on visibility. Assuming all the smoke produced during the test is accumulated in the 15 m3 volume used for the FED and FEC analysis, the visibility can be calculated using the relation (Klote and Milke 2002):
f m
m
K
S
δ
303
.
2
=
(3) where S = visibility, m;K = proportionality constant (8 for illuminated signs and 3 for reflective signs or building components in reflected light);
δm = mass optical density, m2/g;
(The mass optical density is determined using a log base-10 calculation for the smoke parameters where as the results were determined using base-e
calculations. To calculate the mass optical density, the total smoke results in Table 2 must be divided by 2.303.)
mf = the fuel mass loss divided by the volume, g/m3.
Using the data in Table 2, the visibility in the hypothetical room can be estimated using Equation 3. The results are provided in Table 3. For K=8, the visibility ranges from 6.1 m to 66.7 m. Since the calculated visibility is inversely proportional to the total smoke produced during the test, the visibility results varies with the cable groups as follows: the lowest calculated visibility is for the Group 3 cables and the highest for the Group 1 cables.
The following comments can be made based on the hazard calculations in this section: 1. There is a variation in the potential effect of the smoke from the communication cables on
visibility. The smoke produced by the Group 3 cables would have more effect on visibility than the other two cable groups.
2. Using Equation 1 (FED), the smoke from the Group 1 cables is more likely to be lethal to the building occupants.
3. Using Equation 2 (FEC), the smoke from the Group 1 cables has more potential to incapacitate a building occupant trying to evacuate.
4. The FEC values are higher than the FED values under the assumed conditions. As such, the smoke produced from the communication cables has more potential to limit the ability of occupants to evacuate rather than cause fatalities.
The models for assessing the effects of the gases produced from the communication cables were based on the potential that the smoke would produce fatalities (FED) in a 30-min exposure or that the irritant gases would result in incapacitation (FEC). The incapacitation level can be used to represent the condition where self-evacuation is very difficult or impossible. This may be a conservative criterion for smoke management design analysis (Klote and Milke 2002). There have also been suggestions (Purser 2002) that a lower concentration based on the
prediction that the smoke would impair escape in half the population be used in the irritant gas model to determine a fractional irritant concentration (FIC). For this analysis, HCl and HF concentrations of 200 ppm would be used in Equation 2 (Purser 2002).
MEDIUM-SCALE TESTS
Medium-scale tests were conducted using a modified standard ISO 9705 room fire test facility (ISO 1993). This facility consisted of a small non-combustible room with a single doorway and a high-capacity hood and duct system to collect the combustion gases. A full description of the test arrangement and procedures are provided in Lougheed et al (2002) and Lougheed, Kanabus-Kaminska and McCartney (2004a).
For the cable tests, propane burners were used to produce repeatable fires, which generated a specified temperature at the specimen location in calibration tests without cables. Cable specimens using Cables B, C and D were installed in realistic configurations just below the ceiling of the test facility. They were tested over a range of temperature conditions (200°C, 325°C and 450°C) as well as with direct fire exposure. The heat output of the propane burners was 200 – 325 kW depending on the temperature exposure (Lougheed et al 2002). This is typical of the larger fire size used in room scale tests (ISO 1989). The test duration was
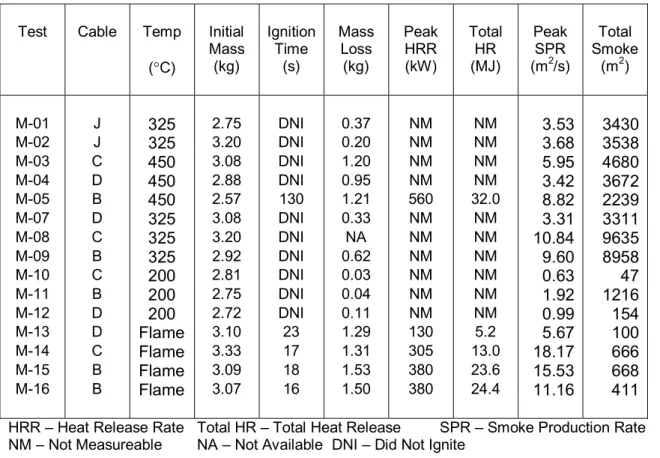
between 15 and 30 min with the longer exposures typically used for the tests at lower temperatures. The results of the tests are summarized in Table 4.
Table 4. Summary medium scale test results.
Test Cable Temp Initial Mass Ignition Time Mass Loss Peak HRR Total HR Peak SPR Total Smoke (°C) (kg) (s) (kg) (kW) (MJ) (m2/s) (m2) M-01 J 325 2.75 DNI 0.37 NM NM 3.53 3430 M-02 J 325 3.20 DNI 0.20 NM NM 3.68 3538 M-03 C 450 3.08 DNI 1.20 NM NM 5.95 4680 M-04 D 450 2.88 DNI 0.95 NM NM 3.42 3672 M-05 B 450 2.57 130 1.21 560 32.0 8.82 2239 M-07 D 325 3.08 DNI 0.33 NM NM 3.31 3311 M-08 C 325 3.20 DNI NA NM NM 10.84 9635 M-09 B 325 2.92 DNI 0.62 NM NM 9.60 8958 M-10 C 200 2.81 DNI 0.03 NM NM 0.63 47 M-11 B 200 2.75 DNI 0.04 NM NM 1.92 1216 M-12 D 200 2.72 DNI 0.11 NM NM 0.99 154 M-13 D Flame 3.10 23 1.29 130 5.2 5.67 100 M-14 C Flame 3.33 17 1.31 305 13.0 18.17 666 M-15 B Flame 3.09 18 1.53 380 23.6 15.53 668 M-16 B Flame 3.07 16 1.50 380 24.4 11.16 411
HRR – Heat Release Rate Total HR – Total Heat Release SPR – Smoke Production Rate NM – Not Measureable NA – Not Available DNI – Did Not Ignite
One objective of the medium scale tests was to determine the behaviour of the
communication cables under a range of simulated fire conditions. In particular, the tests were designed to investigate the thermal degradation of the cables under a range of thermal
conditions that could occur for a fire in the occupied area of an office building. In this case, the hot gases would enter the ceiling void space exposing the communication cable.
Figure 2 shows the smoke production rates for the four tests with Cable C. The
continuous smoke production with 325°C and 450°C exposures is of particular note. The total smoke produced under these conditions was up to an order of magnitude higher than that measured with flame impingement.
The yield data for CO, HCl, HF and COF2 were also determined. As with the
evaluations using the cone calorimeter data, it was assumed that all the smoke produced during the medium scale tests was accumulated in a hypothetical room. For the medium scale tests, the room volume was 750 m3. This is 50 times the volume used for the cone calorimeter evaluations. The scaling was based on the total length of cables used in the two tests (approximately 100 m in the medium scale and 2 m in the cone tests).
Time (s) 0 200 400 600 800 1000 1200 1400 S m ok e Pr od uc ti o n R a te (m 2 /s) 0 5 10 15 20 Test M-10 - 200ºC Test M-08 - 325ºC Test M-03 - 450ºC Test M-14 - 450ºC
Figure 2. Smoke production for medium scale tests with Cable C.
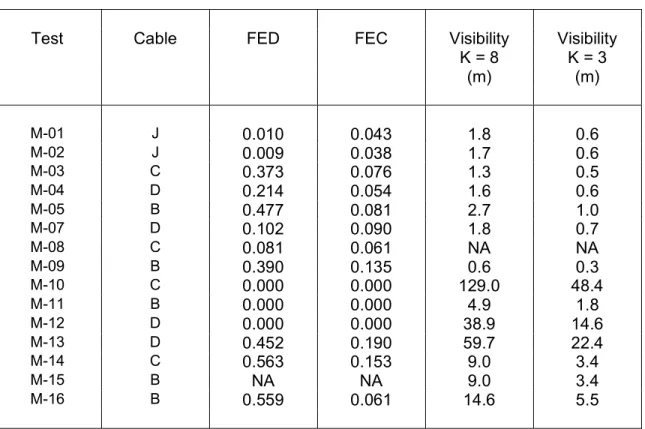
Using the measured yields of gas species and smoke, the mass concentrations in the room were determined and Equations 1 and 2 were used to estimate the FED and FEC values (Table 5).
Table 5. Calculated FED, FEC and visibility for medium-scale tests.
Test Cable FED FEC Visibility Visibility
K = 8 K = 3 (m) (m) M-01 J 0.010 0.043 1.8 0.6 M-02 J 0.009 0.038 1.7 0.6 M-03 C 0.373 0.076 1.3 0.5 M-04 D 0.214 0.054 1.6 0.6 M-05 B 0.477 0.081 2.7 1.0 M-07 D 0.102 0.090 1.8 0.7 M-08 C 0.081 0.061 NA NA M-09 B 0.390 0.135 0.6 0.3 M-10 C 0.000 0.000 129.0 48.4 M-11 B 0.000 0.000 4.9 1.8 M-12 D 0.000 0.000 38.9 14.6 M-13 D 0.452 0.190 59.7 22.4 M-14 C 0.563 0.153 9.0 3.4 M-15 B NA NA 9.0 3.4 M-16 B 0.559 0.061 14.6 5.5
For the tests with flame impingement (Tests M-13 – M-16), the FED were approximately 0.5 compared with 0.12 – 0.2 for the cone calorimeter tests. The FEC values were 0.06-0.19
compared with 0.25 – 0.55 for the bench scale tests. The increase in the FED value was the result of high CO production with these tests. The HCl yields were lower than in the bench scale tests resulting in lower FEC values.
Figure 3. Plan view of the full-scale test arrangement.
With the flame impingement tests, the ignition and burning of the cables was completed in <200 s. During this period, the environment in which the combustion occurred had high concentrations of CO and CO2 as well as low oxygen concentrations. The FTIR spectra indicated that low molecular weight halo-carbons were produced in these tests. These results indicate that the combustion reaction was affected by the environment in which it occurred. The
resulting decrease in yields of HCl and HF resulted in a decrease in FEC values. However, the increased yield of CO resulted in an increase in the FED.
The effect of irritant gases using Equation 2 is based on the yields of HCl, HF and COF2. However, some of the halo-carbons produced in the tests would have irritant effects. As such, the FEC values in Table 5 for the flame impingement tests are low values.
Equation 3 was used to estimate the effect of the smoke produced during the tests on visibility in the hypothetical room. The results of the calculations are provided in Table 5.
With the medium scale tests, Cable D typically had lower smoke production than the other two cables for all the test scenarios. This is consistent with the cone results. However, for several test scenarios the results for Cables B and D were comparable. In the cone tests, the FT 4 cable did not perform as well as the CMP rated cable.
FULL-SCALE TESTS
A full-scale test set-up was used to assess cable specimens. The large-scale facility consisted of a burn room, a target room, and a connecting corridor (Figure 3). The facility simulates a section of an office building comprised of individual offices.
The primary tests were with the CMP cable identified as Cable C in the cone calorimeter and medium scale tests. Based on the bench scale tests, this cable was typical of the Group 2 cables. This Group of cables had the highest heat outputs and smoke production for CMP rated cables. A limited number of tests were conducted with an FT4 rated cable (Cable B) to provide information regarding the difference in performance between the CMP and FT4 rated cables. In addition, tests were also conducted with used CMP rated cables. The test parameters are summarized in Table 6.
Test Facility
The fire compartment was approximately 2.7 m by 3.6 m in area; the target room was approximately 2.8 m by 4.2 m in area. The fire compartment was connected to the corridor via a 0.9 m wide by 2.1 m high opening. The corridor was 1.2 m wide and had a total length of approximately 17.2 m with 10.3 m in the section that connected to the fire compartment.
The total height of the facility was 3.7 m. A suspended ceiling using commercial ceiling tiles and steel t-bar supports was installed at the 2.7 m height in the fire compartment and the corridor to form a plenum area. Openings were cut in the ceiling tiles to simulate return air vents. The fifteen openings in the corridor ceiling tiles were 89 mm by 241 mm and were spaced at 1220 mm intervals along centreline of the corridor. The total area of the openings were comparable to that used for HVAC return air vents in a corridor of the length used in the test facility.
For tests conducted with cables installed only in the corridor plenum, the fire
compartment plenum was isolated from the corridor plenum. For tests with cables located in the plenum space above the fire compartment, an opening was located in the suspended ceiling
near the back of the room. Also for these tests, the fire compartment plenum was connected through a 1.2 m by 1 m opening to the corridor plenum.
Table 6 Test parameters for large scale tests.
Test Cable Exposure Cable Quantity Cable Mass
(kW) (# x m) (kg) L-01 None 100,200,400 0x0 0 L-02 C 400,600,800 30x7.56 6.6 L-03 C 400,600,800 30x7.56 6.5 L-04 Old CMP* 1000 50x7.56 11.8 L-05 Old CMP* 1000 50x7.56 11.5 L-06 C 1000 100x3.96 11.7 L-07 B 1000 100x3.96 11.5 L-08 C 1000 100x3.96 12.0 L-09 C 1000 100x12.19 37.5 L-10 B 1000 100x12.19 35.6 L-11 B 500 100x3.96 11.5 L-12 C 500,1200 100x3.96 12.0 L-13 C 1200 100x3.96 24.1 L-14 Old CMP* 1200 200x12.19 76.6 L-15 Old CMP* 1200 29.9
A 0.9 m wide by 2.1 m high door connected the corridor to the target room. This door remained closed during all tests. There was also a 1.2 m wide by 0.7 m high opening between the corridor plenum and the target room. This opening was centered with the door connecting the corridor and target room.
A 0.9 m wide by 2.1 m high doorway connected the target room to the exterior of the facility. An exhaust hood system was mounted above this doorway. The fan was operated at low capacity with a flow rate of approximately 3 m3/s for all tests.
A plastic extension was mounted to the exhaust hood with openings to the target room and the facility exterior. The opening to the target room was the full size of the exit doorway. The opening to the facility exterior was sized to maintain approximately one third of the total exhaust airflow from the target room.
Ten small supply fans were located at the 458 mm height along the corridor. Each fan had a capacity of 0.085 m3/s. These fans simulated the supply airflow that would be provided through ten offices connected to the corridor with 4 air changes per hour.
The test facility simulated a section of an office building comprised of individual offices connected by a corridor. During a test, products of combustion moved from the fire
compartment and corridor plenums into the target room where their effect on tenability could be assessed. Gas analysis equipment including standard CO, CO2 and O2 gas analyzers and two FTIRs were used to measure gas specie concentrations in the corridor plenum, the target room
and the exhaust duct. A complete description of the instrumentation used for the tests is provided in Lougheed, McCartney and Kanabus-Kaminska (2004b).
During a test, products of combustion moved from the burn room and corridor plenums into the target room where their effect on tenability were determined
The fire source for the full-scale tests was a propane burner system. The flow rate was measured to provide the required heat release rates in the 500 – 1200 kW range depending on the test scenario. The temperatures measured in the fire compartment for a typical test at 1000 kW is shown in Figure 4. The temperatures in the fire compartment over the 600 – 1000 s test duration were comparable to those used in standard fire resistance tests for building
materials (ASTM 1998). Time (s) 0 250 500 750 1000 1250 1500 T em per at ur e ( °C ) 0 100 200 300 400 500 600 700 800 200 mm below slab 950 mm below slab 30 mm below ceiling 330 mm below ceiling 630 mm below ceiling 930 mm below ceiling ASTM E119
Figure 4. Temperatures in the fire compartment for Test L-07.
Fire Scenarios
Three test scenarios were used for the full-scale fire tests with cables: 1. Cables located in the corridor plenum.
2. Cables located in the plenum above the fire compartment.
3. Cables located in the plenum above the fire compartment and in the corridor.
In all scenarios, a fire source in the fire compartment simulating an office fire was assumed. The use of a fire scenario with initial fire located in the occupied area was based on a review of fire statistics, building surveys and previous full-scale fire test programs (Lougheed, McCartney and Kanabus-Kaminska 2004b).
The test parameters for the full-scale tests are summarized in Table 6. For this paper, the results of selected full-scale fire tests are used to investigate the potential additional effect on occupants of the target room as a result of the communication cables located in the plenum space. The hazard assessment methodology is outlined in the following section.
Hazard Assessment
During a test, products of combustion moved from the burn room and corridor plenums into the target room where measurements were made using gas analysis equipment (standard gas analyzers and an FTIR). As a result, with the full-scale tests, time-dependent
measurements of the gas species in a room are available unlike with the bench-scale and medium scale tests. This data was used in the hazard assessment models in Purser (2002) to determine the potential impact of the smoke on life safety in the target room.
Purser (2002) developed a model to calculate a fractional incapacitating dose for exposures to a smoke environment. A similar equation based on Purser’s model is provided in Klote and Milke (2002). For the analysis in this paper, the following equation was used to determine incapacitation: i n i i i iir i ICO IN
F
FLD
VCO
t
F
=
∑
+
×
∆
=]
)
[(
1 , 2 , , (4) where30
10
2925
.
8
4 1.036, , i CO i ICOC
F
−×
=
(5)87000
114000
, , , i HF i HCL i irrC
C
FLD
=
+
(6) = 5 exp , , 2 2i CO i C VCO (7)∆ti = the exposure time interval i (min)
CCO,i = the concentration of CO (ppm); CHCl,i = the concentration of HCl (ppm); CHF,i = the concentration of HF (ppm); CCO2,i = the concentration of CO2 (%).
Using Equation 4, the potential for incapacitation by CO, HCl and HF present in the smoke produced in the full-scale tests was determined. The VCO2 parameter is a multiplication factor
for CO2-induced hyperventilation. The denominator in Equation 5 is the COHb concentration at incapacitation for light acitivity. The denominators in Equation 6 are the exposure doses (ppm.min) predicted to be lethal to half the population for HCl and HF (Purser 2002). The oxygen levels in the target room were not measured and low oxygen hypoxia was not included in the calculation.
In addition to the calculation for incapacitation by the gas species using Equation 4, two irritant gas models were used. These were as follows:
900
900
, ,i HFi HCl iC
C
FEC
=
+
(8) and200
200
, ,i HFi HCl iC
C
FIC
=
+
(9)The denominators used in Equation 8 for the calculation for the fractional effective concentration (FEC) for the irritant gases are the concentrations (ppm) for HCl and HF predicted to cause incapacitation in half the population (Purser 2002). The denominators used in Equation 9 are the concentrations (ppm) for HCl and HF that are predicted to impair escape in half the population.
Purser (2002) also provides a method for estimating the fractional effective concentration for smoke that is predicted to result in visual obscuration affecting escape attempts. The equation used in the analysis in this paper was as follows;
2 . 0 , i i smoke m OD FEC = (10) where i
m
OD
= the measured smoke optical density (OD/m).
The denominator is the tenability limit for smoke obscuration. The value 0.2 corresponds to a visibility of approximately 2-3 m and is typically used for small enclosures with a value of 0.08 corresponding to a visibility of 10 m used for large enclosures.
The smoke measurements in the full-scale tests were taken in the duct after the smoke was diluted with ambient air from the main facility. Based on CO and CO2 measurements in the room and in the duct the smoke was diluted by a factor of 3.5.
Baseline Test
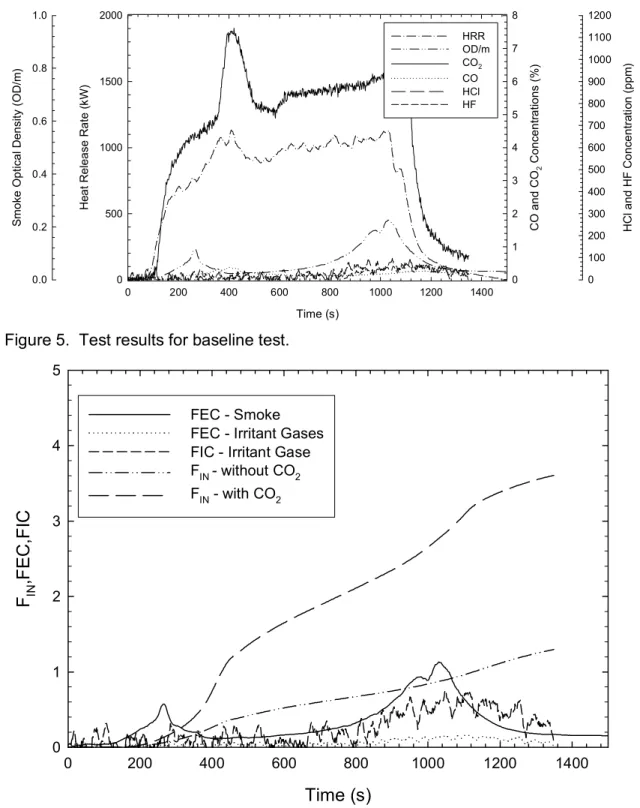
Baseline tests were conducted without cables in the plenum area. Figure 5 shows the results for a test with the propane burner operating initially at 1000 kW starting at 0 s and subsequently increased to 1200 kW at 700 s. The heat release rate was determined using the oxygen depletion method based on gas measurements in the exhaust duct. The heat release rate curve was shifted in time by 55 s from the start of the test to correspond to the
measurements in the target room. All other measurements are based on the start of the test. The heat release rate measurement shows an initial growth in the heat release rate even though a steady state propane burner fire was used in the test. This growth stage coincides
with the time required to fill the test facility with smoke. Since the fire source was approximately steady state, the smoke filling rate can be approximated using an exponential rise to a
maximum with the time constant proportional to
V /
&
V
where V& is the smoke flow rate out of the fire compartment and V is the volume of the facility filled with smoke (Lougheed, McCartney and Kanabus-Kaminska 2004b). Time (s) 0 200 400 600 800 1000 1200 1400 H e at R e leas e R a te ( k W ) 0 500 1000 1500 2000 S m ok e Opti c a l D ens it y (OD /m ) 0.0 0.2 0.4 0.6 0.8 1.0 C O and C O2 C onc entr ati ons (% ) 0 1 2 3 4 5 6 7 8 H C l and H F C onc entra ti o n (ppm ) 0 100 200 300 400 500 600 700 800 900 1000 1100 1200 HRR OD/m CO2 CO HCl HFFigure 5. Test results for baseline test.
Time (s) 0 200 400 600 800 1000 1200 1400 F IN ,F E C ,F IC 0 1 2 3 4 5 FEC - Smoke FEC - Irritant Gases FIC - Irritant Gase
FIN - without CO2
FIN - with CO2
The other measurements shown in Figure 5 include the gas species concentrations (CO, CO2, HCl and HF) in the target room measured using an FTIR and the smoke optical density in the exhaust duct. These results provide baseline conditions for the tests with the cables. The increase in CO2 and heat release rate between 300 and 500 s was due to the effect of the fire on new ceiling tiles used for the suspended ceiling in the fire compartment.
With the propane burner fire, there was no measured HCl or HF during the 1000 kW stage. The quantities shown in the plot is due to noise in the measurement and a shift in the baseline with the extended time duration. The smoke optical density was low (approximately 0.02 OD/m) during the 1000 kW stage. There was an increase in smoke production with the increase in heat release rate at 800 s. The carbon dioxide concentrations (4-6%) were
consistent with the levels expected for the fire size. The CO levels were in the 0.1-0.2% range and were primarily due to the incomplete combustion of the propane in the underventilated conditions. Limited amounts of CO were produced from the materials used to construct the test facility. The hazard parameters for the baseline test are shown in Figure 6.
Cables Corridor Plenum
Tests L-01 to L-05 were used to investigate the effects of a fire in a compartment simulating an office area on cables in a corridor plenum. In these tests, the fire compartment plenum and the corridor plenum were not connected and the smoke from the fire entered the corridor plenum through openings in the suspended ceiling in the corridor.
Time (s) 0 200 400 600 800 1000 1200 1400 He a t Re le a s e R a te ( k W ) 0 200 400 600 800 1000 1200 1400 S m ok e Opti c a l D e ns it y ( O D /m) 0.0 0.5 1.0 1.5 2.0 C O and C O2 C o nc e n tr ati ons ( % ) 0 2 4 6 8 10 H C l and H F C onc entr a ti on ( ppm ) 0 200 400 600 800 1000 HRR OD/m CO2 CO HCl HF
Figure 7. Results for Test L-05.
The results for Test L-05 with CMP rated cables are shown in Figures 7 and 8. The cables did not ignite in this test. During the initial 400 s of the test, the smoke and gas specie production was primarily from the propane burner fire. However, after 400 s, there was increased smoke, CO and CO2 produced with the interaction of the hot gases (300-400°C) in the corridor plenum with the cables. This resulted in increases in the smoke FEC and the gas
incapacitation parameters, FIN, to levels above the tenability limit of 1 (Figure 8). These results indicate that, even though the cables in the plenum are not ignited, they can affect the tenability in a target room. This is consistent with the results of the medium scale tests in which
substantial smoke production was measured in tests with the cables exposed to air heated to 325°C and 450°C (Figure 2).
Time (s)
0 200 400 600 800 1000 1200 1400F
IN,F
E
C
,F
IC
0 2 4 6 8 10 FEC - Smoke FEC - Irritant Gases FIC - Irritant Gase FIN - without CO2 FIN - with CO2Figure 8. Hazard parameters for Test L-05.
Cables in the Fire Compartment Plenum
Tests L-06 to L-08 investigated the effect of cable loads in the plenum space above the fire compartment. Tests L-06 and L-08 were with the CMP rated cable and Test L-07 was with FT 4 rated cable. With Test L-06, there was an involvement of the paper sheathing on gypsum board located in the plenum area resulting in additional heat and smoke production. The results of this test are discussed in the report (Lougheed, McCartney and Kanabus-Kaminska 2004b).
The results of Tests L-07 and L-08 are shown in Figures 9-12. A primary difference between the two tests was the time at which the cables were ignited. For Test 7 with the FT 4 rated cable, most of the combustion occurred during the main fire event. For Test 8 with the CMP rated cable, much of the combustion occurred during the decay phase. The high HF concentrations measured between 800 and 1000 s are of particular note (Figure 11).
The delay in the ignition of the cables in Test L-08 was attributed to the low oxygen levels in the plenum area. This phenomenon was noted in previous full-scale tests with
communication cables (Fardell et al 2000). A similar phenomenon was also noted with the FT 4 rated cables in Test L-10.
Time (s) 0 200 400 600 800 1000 1200 1400 H eat R e leas e R a te ( k W ) 0 200 400 600 800 1000 1200 1400 S m ok e Opti c a l D ens it y ( O D /m) 0.0 0.5 1.0 1.5 2.0 C O and C O2 C onc entr a ti ons ( % ) 0 2 4 6 8 10 H C l and H F C onc entr ati on ( ppm) 0 200 400 600 800 1000 HRR OD/m CO2 CO HCl HF
Figure 9. Results for Test L-07.
Time (s)
0 200 400 600 800 1000 1200 1400F
IN,F
E
C
,F
IC
0 2 4 6 8 10 FEC - Smoke FEC - Irritant Gases FIC - Irritant Gase FIN - without CO2 FIN - with CO2Figure 10. Hazard parameters for Test L-07.
The second difference between the two tests was the peak smoke optical densities. With the FT 4 cables, the smoke optical densities were approximately 0.6 OD/m for an extended
period of time (Figure 9). With the CMP rated cable, steady smoke levels of approximately 0.2 OD/m were measured (Figure 11). The 3 times increase in smoke levels with the FT 4 rated cable is consistent with the results of the cone calorimeter tests.
Time (s) 0 200 400 600 800 1000 1200 1400 H eat R e leas e R a te ( k W ) 0 200 400 600 800 1000 1200 1400 S m ok e Opti c a l D ens it y ( O D /m) 0.0 0.5 1.0 1.5 2.0 C O and C O2 C onc entr a ti ons ( % ) 0 1 2 3 4 5 6 7 8 H C l and H F C onc entr a ti on (p p m ) 0 100 200 300 400 500 600 700 800 900 1000 HRR OD/m CO2 CO HCl HF
Figure 11. Results for Test L-08.
Time (s)
0 200 400 600 800 1000 1200 1400F
IN,F
E
C
,F
IC
0 2 4 6 8 10 FEC - Smoke FEC - Irritant Gases FIC - Irritant Gase FIN - without CO2 FIN - with CO2The baseline levels with only the propane burner fire was approximately 0.02 OD/m. As such, there was a significant increase in the smoke optical density with the cables in the
plenum. However, it should be noted that the fire source used in these tests produced limited amounts of smoke relative to a fire with typical office materials. With the fire sizes used in these tests, the fires source alone would be expected to produce sufficient smoke to limit visibility in the target room. However, the cables in the plenums do provide additional smoke production that would increase the effect of the smoke.
For Test L-07, three tenability parameters (FEC smoke, FIC irritant gases and FIN
including CO2 effects) all exceed the tenability limit (1) at approximately 400 s. As noted above, the additional smoke production with the cables does produce an additional effect on visibility. Also, the increase in FIC for irritant gases indicates that there are sufficient irritant gas
concentrations in the smoke to further impede evacuation.
The FIN values were primarily due to the CO produced by the propane fire combined with the additional production with the cables in the plenums. The irritant gases had limited effects on this parameter (Lougheed, McCartney and Kanabus-Kaminska 2004b). With the cables in the plenums, the CO concentrations in the target room increased from approximately 0.2% to >0.5%. This increase combined with the effect of the carbon dioxide produced a rapid increase in the FIN values. As such, the additional production of CO with cable fires should be taken into consideration in a hazard analysis.
The high CO2 concentrations in the target room had a major effect on the FIN. This is
illustrated by the difference in FIN values calculated with and without CO2 contributions shown in Figures 10 and 12. With diluted smoke in which the CO2 factor was reduced to near 1, the FIN values would be comparable to the FEC for the irritant gases determined using Equation 8 (Figures 10 and 12). As such, in determining the potential for incapacitation of building occupants with a diluted smoke environment, the effects of both the CO and irritant gas concentrations in the smoke should be considered.
As noted previously, a major difference between Tests L-07 and L-08 was the delayed burning of the cable to the end of the propane burner fire. However, there was still sufficient increase in smoke production and CO concentrations in Test L-08 to result in the FEC for smoke and FIN with CO2 effects to exceed the tenability limit at approximately the same time (400 s) as Test L-07.
With Test L-08, there was a delay in the effects of the irritant gases (Figure 12). Although delayed to the end of the test, the FIC and FEC levels for the irritant gases were comparable to those measured in Test L-07. In a real office fire, this delay in the cable fire could result in the effect of the irritant gases from the cables being delayed until the decay phase of the fire in the office area. However, for smoke management in a high rise building in which one is dealing with extended evacuation times, the irritant gases produced from the cables could still have an effect.
Other Test Series
Additional large-scale fire tests were conducted to investigate the effect of other parameters. For Tests L-09 (CMP) and L-10 (FT 4), the cables were installed in both the fire compartment plenum and the corridor plenum. In both tests, the cable fire was delayed until the burners were shut-off and the cable fire only spread approximately 2 m into the corridor. As
such, the amount of cable involved in the fire was comparable to that for Tests L-07 and L-08 discussed in the previous section. The overall test dynamics and effect on the conditions in the target room were similar to those discussed for Test L-08.
Tests L-14 and L-15 investigated the effects of heavier cable loads with a 1200 kW fire source. With these tests, the HCl and HF concentrations measured in the target room were considerably lower (<200 ppm) than those measured in the other full-scale tests (Lougheed, McCartney and Kanabus-Kaminska 2004b). This was most likely due to the low oxygen concentrations in the plenum area combined with other factors. The FTIR spectra for these tests indicated that substantial quantities of low molecular weight hydro- and halo- carbon molecules were produced. For example, the concentrations of the methane and acetylene in the target room were in the 600-900 ppm range compared with <200 ppm in other tests. These results indicate that, with the heavy cable loads, there was incomplete combustion. Although this did reduce the HCl and HF concentrations, it does not necessarily reduce the hazard. In this case, a full evaluation of the hazard would require an evaluation of the effects of the low molecular weight halo-carbons.
CONCLUSIONS
In this paper, data from bench-scale, medium-scale and full-scale tests were used to investigate the potential affect of fires involving cables in plenum spaces on the hazard to building occupants in compartments contaminated by smoke distributed through a building HVAC system. The results indicate that the cables can result in an increased hazard in a target room. Some of the factors that can affect tenability include:
1. There was an increase in smoke production with the involvement of the cables in the fire. This increased smoke can occur even if the cables are not ignited but are exposed to a high temperature environment. In the large-scale tests, the smoke from the cables was sufficient to limit visibility. The tenability limit for visibility generally occurred before other tenability criteria were exceeded.
2. There was an increase in CO concentrations. In some cases, CO production from the cables was comparable to that from the fire in the occupied space resulting in a significant effect on tenability.
3. Irritant gases (HCl, HF and COF2) were produced from the cables. Under some conditions, the concentrations may be sufficient to result in incapacitation (FEC > 0.3) for some of the occupants. However, the calculated fractional irritant concentrations (FIC) indicated that effect of the irritant gases on the ability of occupants to evacuate would be of more concern. 4. There was reduced production of HCl and HF in tests with high cable loads and low oxygen
atmospheres. Based on the models used in this paper to determine the effects of irritant gases, this indicated a reduction in the hazard. However, FTIR results indicated that low molecular weight hydro- and halo- carbons were produced in these cases that could effect tenability.
The hazard assessments for the full-scale fire tests are based on the smoke levels and concentrations of gas species in the target room. However, there was a continuous flow of smoke through the door opening in the target room at approximately 1 m3/s. As such, the smoke produced in the fire would effect the tenability in a considerably larger volume.
The tests indicate that the smoke produced from the CMP and FT4 cables in plenums when exposed to fire could reduce visibility for occupants restricting their ability to evacuate. In
addition, the CMP and FT4 rated cables also produced irritant gases that could result in incapacitation or further restrict the ability of occupants to evacuate.
The results in this paper investigated only the contribution of smoke from the cables for non-sprinklered building fires. However, such a fire will produce smoke and other products of combustion, which could be as hazardous or more hazardous than the products of combustion from the communication cables.
REFERENCES
ASTM. 1997. E1354-97, Standard Test Method for Heat and Visible Smoke Release Rates for Materials and Products, West Conshohocken, PA: American Society for Testing and Materials.
ASTM. 1998. E119-98, Standard Test Methods for Fire Tests of Building Construction Materials, West Conshohocken, PA: American Society for Testing and Materials. Babrauskas, V. 1997. Toxicity for the Primary Gases Found in Fires, Fire Science and
Technology Inc. http://www.doctorfire.com/toxicity.html.
Babrauskas, V. 2000. Fire Safety Improvements in the Combustion Toxicity Area: Is There a Role for LC50 Tests?, Fire and Materials, Volume 24, p. 113-119.
Clarke, F., Hoover, J., Caudill, L., Fine, A., Parnell, A. and Butcher, G. 1993., Characterizing Fire Hazard of Unprotected Cables in Over-Ceiling Voids Used for Ventilation, Proceedings of Interflam '93, Oxford, UK, pp.259-264.
Clarke, F. and Gewain, R. 2000. International Limited Combustible Plenum Cable Fire Test Project, Quincy, MA: National Fire Protection Research Foundation.
Fardell, P. 1998. Assessing the hidden hazard, Fire Prevention, Vol. 308, April, pp. 30-31. Fardell, P., Colwell, R. and Chitty, R. 2000. Study of Cable Insulation Fires in Hidden Voids, PiT Research Programme CI 38/19/131 (cc0985), Garston, UK: Building Research
Establishment.
Jin, T. 1976. Visibility through Fire Smoke – Part 5, Allowable Smoke Density for Escape from Fire, Report No. 42, Fire Research Institute of Japan.
Klote, J.H. and Milke, J.A. 2002. Principles of Smoke Management, Atlanta, GA: American Society of Heating Refrigeration and Air-conditioning Engineers.
Lougheed, G.D., McCartney, C. and Kanabus-Kaminska, M. 2002. Initial investigations on plenum cable fires, ASHRAE Transactions, 108, (Pt. 1), pp. 712-723.
Lougheed, G.D., Kanabus-Kaminska, M. and McCartney, C. 2004a. Cable Fires in Plenums: Small and Medium Scale Tests, Ottawa, ON: National Research Council Canada.
Lougheed, G.D., McCartney, C. and Kanabus-Kaminska, M. 2004b. Cable Fires in Plenums: Full-Scale Fire Tests, Ottawa, ON: National Research Council Canada.
NFPA. 2000. NFPA 92B, Guide for Smoke Management in Malls, Atria, and Large Areas. Quincy, MA: National Fire Protection Association.
Purser, D. 2002. Toxicity Assessment of Combustion Products, The SFPE Handbook of Fire Protection Engineering, Quincy, MA: National Fire Protection Association.