An Architectural Selection Framework for
Data Fusion in Sensor Platforms
byAtif R. Mirza
B.Eng (Honors), Mechanical Engineering The University of Edinburgh, 1998
SUBMITTED TO THE SYSTEM DESIGN AND MANAGEMENT PROGRAM IN PARTIAL FULFILLMENT OF THE REQUIREMENTS FOR THE DEGREE OF
MASTER OF SCIENCE IN ENGINEERING AND MANAGEMENT AT THE
MASSACHUSETTS INSTITUTE OF TECHNOLOGY
C
SEPTEMBEI 2006
@2006 Atif Mirza. All rights reserved
The author hereby grants to MIT the permission to reproduce and to distribute publicly paper and electronic copies of this thesis document in whole or in part.
Signature of Author_____ ________
__
/
/
Atif MirzaSystem Design and Management Program Certified
by
Olivier de Weck Associate Professor of Aeronautics & Astronautics and Engineering Systems
Certified by.
%t1 ^ lck Hale Director, System Design and Management Program
An Architectural Selection Framework for
Data Fusion in Sensor Platforms
by Atif R. Mirza
Submitted to the System Design and Management Program in Partial Fulfillment of the Requirements for the Degree of
Master of Science in Engineering and Management
ABSTRACT
The role of data fusion in sensor platforms is becoming increasingly important in various domains of science, technology and business. Fusion pertains to the merging or
integration of information towards an enhanced level of awareness. This thesis provides a canonical overview of several major fusion architectures developed from the remote sensing and defense community. Additionally, it provides an assessment of current sensors and their platforms, the influence of reliability measures, and the connection to fusion applications.
We present several types of architecture for managing multi-sensor data fusion,
specifically as they relate to the tracking-correlation function and blackboard processing representations in knowledge engineering. Object-Process Methods are used to model the information fusion process and supporting systems. Several mathematical techniques are shown to be useful in the fusion of numerical properties, sensor data updating and the implementation of unique detection probabilities.
Finally, we discuss the importance of fusion to the concept and operation of the Semantic Web, which promises new ways to exploit the synergy of multi-sensor data platforms. This requires the synthesis of fusion with ontology models for knowledge representation. We discuss the importance of fusion as a reuse process in ontological engineering, and review key lifecycle models in ontology development. The evolutionary approach to ontology development is considered the most useful and adaptable to the complexities of semantic networks. Several potential applications for data fusion are screened and ranked according to the Joint Directors of Laboratories (JDL) process model for
information fusion. Based on these predetermined criteria, the case of medical diagnostic imaging was found to offer the most promising applications for fusion, on which future product platforms can be built.
Thesis Supervisor: Olivier de Weck
Acknowledgements
I would like to thank my supervisor, Professor Olivier de Weck, for his support and guidance throughout the writing of this thesis. I also wish to thank Pat Hale, the staff of the LFM-SDM Offices and my colleagues in the System Design and Management Program for making my studies at MIT such an enriching learning experience. Finally I am grateful to my family for their support and encouragement throughout all my
Table of Contents
Acknowledgem ents... 3 Table of Contents ... 4 List of Figures...5 List of Tables ... 6 Nom enclature ... 7 CHAPTER 1: INTRODUCTION ... 91.1 Data Fusion Defined ... 9
1.2 Literature Review ... 16
1.3 How to Think about Data Fusion ... 29
1.4 Thesis Objectives... 33
CHAPTER 2: SENSORS AND SENSOR PLATFORMS ... 34
2.1 Sensor Categories ... 34
2.2 Single Sensor Systems ... 34
2.3 M ulti-Sensor Systems... 36
2.4 Active versus Passive Sensors... 39
2.5 Sensor Platforms...41
CHAPTER 3: OVERVIEW OF FUSION ALGORITHMS & METHODS ... 43
3.1 Fusion of Numerical Properties: The Kalman Approach ... 43
3.2 Bayesian M ethods...45
3.3 Voting Fusion... 50
CHAPTER 4: MODEL OF A C4ISR SYSTEM...54
4.1 Scenario Profile ... 54
4.2 System Concept ... 55
4.3 M ission-level Decomposition ... 56
4.4 Object-Process M odeling of the ASW M ission ... 57
4.5 Integration ... 60
CHAPTER 5: FUSION AND THE SEMANTIC WEB ... 63
5.1 M otivation ... 63
5.2 Ontologies and the Semantic W eb... 64
5.3 The Ontological Lifecycle... 66
5.4 Fusion as a Reuse Process... 68
5.5 Parallelism and Other Taxonomies...72
CHAPTER 6: SYSTEM ENGINEERING FOR DATA FUSION...76
6.1 Implementation Challenges... 76
6.2 Process Selection: Comparing Fusion Levels ... 81
6.3 Tracker-Correlator Architectures ... 84 6.4 Hierarchical Architectures ... 89 6.5 Applications ... 91 CHAPTER 7: CONCLUSIONS... 95 REFERENCES... 97 APPENDIX ... 101
List of Figures
Figure 1-1 Image superposition from 3 data sources ... 10
Figure 1-2 The Sensor-to-Signal Value Chain...12
Figure 1-3 D F C ycles Span... 14
Figure 1-4 O m nibus M odel... 18
Figure 1-5 Data Fusion Systems Engineering Process... 21
Figure 1-6 Fusion Improvement of State Vector ... 23
Figure 1-7 Sensor Network in a Civil Structure ... 24
Figure 1-8 Architecture Tasks in Product Development ... 26
Figure 1-9 A Context for Data Fusion...30
Figure 2-1 A sensor system ... 35
Figure 2-2 Multiple Sensor Versus Single Sensor Performance ... 37
Figure 2-3 Identification probability convergence... 38
Figure 2-4 (a) Wireless reconfigurable platform ... 41
Figure 2-4 (b) Truck-mounted ground based phased array ... 41
Figure 3-1 Influence D iagram ... 46
Figure 3-2 (a) D etection M odes... 50
Figure 3-2 (b) Confidence Intervals ... 50
Figure 3-3 Nested Confidence Levels ... 52
Figure 4-1 Ocean Surveillance scenario for a C4ISR system ... 54
Figure 4-2 Inference Hierarchies: Specific and Generic models ... 55
Figure 4-3 The Place of Sensors in ASW...56
Figure 4-4 Function H ierarchy... 57
Figure 4-5 Attribute representation in OPM...58
Figure 4-6 Network Integration of Smart Sensors ... 61
Figure 5-1 Lifecycle Development Models ... 66
Figure 5-2 OWL Ontology for C41SR Mission... 68
Figure 5-3 Relational links in OPM ... 69
Figure 5-4 Object-Process Diagram for Information Fusion... 71
Figure 5-5 Class-based Ontology for Identity Classification Algorithms...73
Figure 5-6 Classes in the OWL Ontology ... 74
Figure 5-7 Semantic Network Example ... 75
Figure 6-1 EIA/IS 632 System Lifecycle Standards ... 76
Figure 6-2 DoD C4ISR Segment Funding (2004)...77
Figure 6-3 Perceptual Reasoning Machine for Cognition and Situation Awareness...79
Figure 6-4 IR Sensor, Functional Decomposition ... 80
Figure 6-5 Centralized Fusion Architecture ... 84
Figure 6-6 Decentralized Fusion Architecture...85
Figure 6-7 Hybrid Fusion Architecture ... 87
List of Tables
Table 1-I Representation M odels and their Objectives ... 10
Table 1-2 Function Hierarchy ... 12
Table 1-3 Dasarathy M odel ... 17
Table 1-4 Hierarchical Classification Scheme... 25
Table 1-5 Sensor Fusion Challenges ... 32
Table 5-1 Target Discrimination Attributes ... 65
Table 6-1 Comparison of Various Fusion Levels ... 83
Nomenclature
ACDS: Advanced Combat Direction System AESA: Active Electronically-Steered Array Al: Artificial Intelligence
ASW: Antisubmarine Warfare ATR: Automatic Target Recognition COS: Class of Supply
CCART: Cargo Category Allocation Rates Table
C41SR: Command, Control, Communications, Computers Intelligence, Surveillance and Reconaissance DARPA: Defense Advanced Research Projects Agency EIA/IS: Electronic Industries Association / Interim Standard EM: Electro-Magnetic
EO: Electro-Optical
ESM: Electronic Support Measures FOV: Field of View
GPS: Global Positioning System HMM: Hidden Markov Model IFFN: Identify-Friend-Foe-Neutral IFOV: Instantaneous Field of View INS: Inertial Navigation System IR: Infrared
ISS: International Space Station JDL: Joint Director of Laboratories
KBS: Knowledge-Based Systems MMW: Millimeter Wave
MW: Microwave
NATO: North Atlantic Treaty Organization NMR: Nuclear Magnetic Resonance OPD: Object Process Diagram
OPM: Object Process Methodology PRM: Perceptual Reasoning Machine
RF: Radio Frequency
SAR: Synthetic Aperture Radar
SE: Systems Engineering
SRL: Sense and Respond Logistics
SWL: Semantic Web Language T&E: Test and Evaluation
UAV: Unmanned Aerial Vehicle URI: Universal Resource Identifier
UV: Ultraviolet
CHAPTER 1: INTRODUCTION
1.1 Data Fusion Defined
Data fusion is interpreted widely depending on the applications, technologies and communities of interest. It refers in a broad sense to the processing and distribution of data from two or more sources to obtain a property of an environment or object.
Common sensor devices include video cameras, range finders, tactile sensors and sonar. Environments may include oceanic or terrestrial surfaces, airborne or ground-based combat zones, warehouse facilities and web-based retail (e.g. Fig.1-1). The list of stakeholders grows as new forms of sensors are developed and applied to data-rich environments. The following definitions are culled from the remote sensing community, where fusion concepts and nomenclature have been matured over several decades.
"Image fusion is the combination of two or more different images to form a new image by using a certain algorithm" [Pohl and Van Genderen, 1998]
"...techniques combine data from multiple sensors, and related information from associated databases, to achieve improved accuracy and more specific inferences than could be achieved by the use of a single sensor alone "[Hall and Llinas,
1990]
"...a multilevel, multifaceted process dealing with the automatic detection, association, correlation, estimation, and combination of data and information from multiple sources" [US Department of Defense, 1991]
In recent years, fusion has been extended beyond the process-centered view, to reflect a more holistic methodology for information management. For instance, Buchroithner and Wald (1998) advanced the following definition:
"Data Fusion is a formalframework in which are expressed means and tools for the alliance of data originating from different sources. It aims at obtaining
information of greater quality; the exact definition of 'greater quality' will depend upon the application."
Figure 1-1 Data fusion example: Image Superposition from 3 data sources Overview of Data Fusion Models
Models are used to represent specific patterns of behavior or form (Maier and Rechtin,
2002). They capture the diverse, and often conflicting, architectural views of a product
or process. Different models can help bring specific problems to bear in complex system
engineering and architecting. In Table 1-1, these views are related to notions of
stakeholder value and system success. Many of these views can then be fitted to some
level of quantitative or qualitative model, which might help guide policy or manage
assets in interrelated political, technical or economic systems.
Perspective or View Description
Purpose / objective What the client wants
Form What the system is
Behavioral or Functional What the system does
Performance objective / requirements How effectively the system does it
Data The information retained in the system and
its interrelationships
Managerial The process by which the system is constructed and managed
Representation Models. Various representation models have been developed to help illustrate, on both behavioral and predictive terms, the commonly accepted stages of data fusion. The focus of this work will be on the form, functional and data models needed to implement state-of-the-art fusion systems. Performance-related or technology policy issues will not be investigated in depth in this research.
Purpose and Function Models. An inference, according to Webster's dictionary, is defined as a deduction made on the basis of a set of hypotheses. The Joint Directors of Laboratories (JDL) published a model in 1992 that extends conventional single-source
methods to a multi-level, multi-source inference hierarchy. It is the most widely used method for categorizing data fusion functionality in the US. In 1998, the JDL model was revised to provide a framework for investment in automation, among other things.
Fusion objectives can be expressed by the system problem statement:
"To align, associate, predict and infer... [in order] to produce identity estimates and situational refinements.. .in support of a diverse mission environment which operates on processed and referenced sensor data."
In later sections, various concept fragments in the JDL model, such as threat assessment, will be reinterpreted and evolved to serve commercial requirements for data fusion needs.
local computer Temperature Light Moisture Magnetic Field S N Weight Tilt -Chemical reader c e code
Electromiagnetic Return Signal
Universal Identifier (UI)
with
Sensors
Figure 1-2 The Sensor-to-Signal Value Chain.
The data fusion functions are defined according to the hierarchy in Table 1-2 (Hall, 2002) Level 0 Sub-Object Data Association and Estimation: pixel/signal level data association
and characterization
Level I Object Refinement: observation-to-track association, continuous state estimation
(e.g. kinematics), discrete state estimation (e.g. target type & ID), prediction
(Kalman filter)
Level 2 Situation Refinement: object clustering and relational analysis, to include force
structure and cross force relations, communications, physical context, etc.
Level 3 Impact Assessment: [Threat Refinement]; threat intent estimation, [event
prediction], consequence prediction, susceptibility and vulnerability assessment
Level 4 Process Refinement: adaptive search & processing (element of resource
management)
In level 0, association addresses the problem of sorting and correlating observations into common groups. This grouping, by entity, makes it easier to characterize the
observations for refinement at the next stage. It also makes the determination, if any, of a relationship between source data and entity. An example algorithm used to perform association in Level 1, object refinement, adds the step of tracking to the cycle. Tracking refers to the estimation of position and velocity of the entity and can be implemented by
Kalman filters, Hidden Markov Models and dynamic Bayesian nets (Wald, 2002). Level 2 situation refinement fuses the spatial and temporal relationships between entities and forms an abstracted interpretation of patterns on the order of battle data. Finally, level 3 focuses on the prediction algorithms to infer intentions and perform threat assessment. Level 4 extends the adaptive search and processing steps to include regulation of data that is acquired. In other words new data is acquired in a way that is directly influenced by the processing and interpretation of data obtained at previous time steps. Level 4 is also known as the 'meta-manager' where decisions are represented and fused.
The object-process refinement cycle in Figure 1-3 maps to the representation models described in Table 1-1. It also approximates the holistic framework posited by Crawley (2005) for product and operator attributes.' However, while Crawley's framework focuses exclusively on the global architecture issues related to product attributes, the JDL model considers a more granular definition. This suggests two ways to approach fusion
analysis; one which tailors each activity to the available set of models (the
'model-An attribute, here, is meant to denote the form, function, needs, goals, and timing of a system. This is different from notion of attribute fusion, through which sensor data is translated into decisions.
centric' view), and another that captures all fusion activity into a single model (the 'system-generic' view). The model-centric view might be thought of in terms of the physical model based on the physical characteristics of the object (Hall, 1992), whereas the system-generic view might be considered in light of the monitoring system described by level 4.
where what when who why how how well
Level 0: Level 1: Level 2: Level 3: Level 4:
Association & Object Situation Threat Process
Estimation Refinement Refinement Refinement Refinement
DATA FUSION PROCESSING physical objects
individual organizations
events
specific aggregated
environment & enemy tactics
local global
enemy doctrine objectives & capability
local global
friendly vulnerabilities & mission
options needs friendly assets local global effectiveness battle theatre resource management local global
Figure 1-3 DF Cycles Span (Courtesy: Llinas, DF Working Group)
Form Models. Form is the ultimate object of design (Alexander, 1964). A form model is closely tied to the function model, and both are unified in an overarching system concept. Form represents a level of physical abstraction that accommodates the working principles of the system concept, which must allow for the execution of all functions (Crawley, 2005). In data fusion, a form model is directly related to domain-specific notions of
space and connectivity. That is, an electromechanical device which fuses data to deliver value adopts different form aspects than does a C4ISR defense system. Therefore,
diverse products need to be assessed at roughly the same architectural level and order of complexity to draw meaningful inferences from system concepts.
Data Models. The drive for increasing levels of automation in corporate and
governmental information systems has created a requirement for innovative data models. One of the functional objectives in data systems is to establish structure- and elicit
learning- from complex and disparate sources. Solutions are increasingly being manifested in computer database systems, but the principles of data modeling apply equally to paper-based methods. This work will attempt to expand the reference case models from remote sensing systems to other domains. Here, we can take lessons from commercial retailing operations, where companies such as Wal-Mart have invested in sophisticated data warehouses to manage their inventory using new technologies such as RFID (Cebrowski and Garstka, 1998). These self-synchronizing networks have emerged from the co-evolution of organization. This data becomes valuable when it extracts marketplace trends and gets coupled with real-time transaction information about local retail operations. The core elements of fusion, then, have already been successfully deployed in some commercial settings.
1.2 Literature Review
Origins
The concept of data fusion goes back to the defense research community of the 1980's. Specifically, three models were borne out of military applications in radar, missile and surveillance technologies. Much of the lexicon developed in the data fusion community is designed to support intelligence cycles (Bedworth and O'Brien, 2000). In the UK, the defense establishment considered this to be a process - comprised of collection, collation, evaluation and dissemination. Note that there is not a specific planning and direction phase, as articulated in the American cycle concept. A brief description of activities in the various phases is given below:
* Collection- Information from electronic or human sources is gathered and reported.
* Collation- Adjacent reports are combined or compressed for next stage fusion. * Evaluation- Intelligence is fused, either through some form of automation or via
human interpretation, to make informed decisions at the next stage.
* Dissemination- Distribution of intelligence reports to commanders for asset deployment.
The UK Intelligence Cycle organizes methods and tasks (data collection) toward some concrete deliverable (asset deployment), without prescribing tools. An even higher level of abstraction can be achieved with Boyd's four-phase action loop: Observe, Orient, Decide and Act (Boyd, 1987). Although semantically, this model is rooted in the military command process and is somewhat analogous to the JDL model, it introduces the notion of iteration and feedback. This distinguishes it from the JDL sequence, which is a linear
'bus' of information inflows and outflows. By adding a dimension of control, Boyd recasts fusion as a systems-theoretic problem that can be described by all three
mathematical formalisms: continuous time, sampled data and discrete event analysis. Random set measurement models extend single-sensor single target point-variate statistics to describe a variety of multi-sensor, multi-target scenarios. They do this by incorporating ambiguous evidence (natural language reports, rules) in multi-sensor and target estimation.
The Waterfall Model proposed by Bedworth (1994) was endorsed by the UK Technology Foresight Data Fusion Working Group. It focuses on lower-level sensing capabilities and divides the fusion levels more finely than others. Since there is no control loop, the
interactions to decision making are linear. The Dasarathy Model (1997) likens the five levels of fusion to an input-output paradigm. In Table 1-3, a feature refers to the property or target attribute of an object. Features can be mathematical attributes (measurements) or image attributes (color).
Input Output Notation Analogues
Data Data DAI-DAO Data-level fusion
Data Features DAI-FEO Feature selection
and feature extraction
Features Features FEI-FEO Feature-level fusion
Features Decisions FEI-DEO Pattern recognition
and pattern processing
Decisions Decisions DEI-DEO Decision-level
fusion
Table 1-3 Dasarathy Model
The data is injected to the input pipeline and returns output data at the first level. In subsequent levels, it feeds data and returns features, which in turn yield decisions. These processes correspond to the feature extraction, pattern recognition and decision
selection stages. The Omnibus Model (Bedworth and O'Brien, 1999) in Figure 1-4 attempts to unify the above views in a single, iterative decision loop. The primary
architectural merit of Omnibus is that it captures - in one graphic - the respective zooming by previous models.
Decision-Soft Decision making Hard Decision
Fusion Fusion
Context-orocessiny
U Decide
Pattern-Cotl
Feature processing Orientate
Fusion Feature- Resource
extraction Observe tasking
Signal processing Sensor DataSensor
Fusion Sensing Management
Figure 1-4 Omnibus Model
Current Research Agenda
System Engineering and Data Fusion. The research agenda in the Data Fusion Community is broad and deep. The problems can be seen as either classification-based,
relating to sensor deployment, placement, behavior and coordination in networks (Luo, 2002). The problems can also be stated as methodological, which take a decision-theoretic approach to resolving system trades. This view of data fusion would employ utility-oriented concepts that seek to quantify the value of information to stakeholders. It takes an analytic approach to problems via qualitative tools for reasoning abstractly about
the fusion process. Some of the quantitative research methods apply Bayesian statistics, Dempster-Schafer theory, Hough transforms and combinatoric set theory (Hall, 2002). Finally, beyond the logical and physical questions, there are real management and policy issues at stake, such as: how best to inject information fusion during various system development activities; how to create a secure, replicable base for applications, and what is the correct competitive space for fusion systems?
The Information Systems Office at the Defense Advanced Research Projects Agency (DARPA) allocates the issues according to operational and technical challenges. Key barriers to implementing fusion systems - the operational challenge- include data overload and interoperability. According to Flank (1998) over 80% of information is either never usefully processed or is deposited in some remote database and rendered obsolete. Real-time processing of information is then an important problem in the design of fusion systems. So too are the notions of sensor reliability and availability. This is also a technical challenge. Flank advocates performance metrics for characterizing and aggregating entity-level fusion. Speed and cost of algorithm development further drain management resources, for which Flank has suggested common fusion infrastructures to launch new products. He also cites the need to use emerging object-oriented modeling and wrapping techniques to make fusion 'engines' more interoperable. A diverse application context requires data structures that are robust to changes in semantic representations.
The systems engineering (SE) discipline focuses on the frameworks and tools related to design processes for multi-faceted products or services. It provides more than a set of methods to deal with complexity in product development. Rather, it offers strategic and tactical concepts for managing phases across a system's lifecycle. A generic lifecycle would include ideation and requirements planning, design-build, integration and test, maintenance and disposal. Specific design objectives render some processes more critical than others; the emphasis should be a function of relative maturity and
hardware/software content. The Data Fusion Engineering Method (Project Correlation, 1997) presents a successful heuristic application of system engineering to fusion design. The framework in Figure 1-5 divides the development task between functional
partitioning and point designs. Performance is evaluated at progressive levels of complexity from high- level architecture to detailed design.
Operational Test &
Evaluation Design Phases
1. Operational Architecture Design System Role
Requirements Functional Point Design Performance
Analysis Partitioning Evaluation
2. System Architecture Design Fusion Tree
Requirements Functional Point Design Performance
Analysis Partitioning Evaluation
3. Component Function Design Fusion Node
Requirements Functional Point Design Performance
Analysis Partitioning Evaluation
4. Detailed Design / Development Pattern App.
|Requirements Functional Point Design Performance
Analysis Partitioning Evaluation
Operational Test & Evaluation
Figure 1-5 Data Fusion Systems Engineering Process
Steinberg (2000) identified three systems engineering challenges in data fusion.
Firstly, how should uncertainty be modeled, both in sensory observations and in the
phenomenon which produce those observations? Secondly, how should systems
aggregate non-commensurate sensory data (i.e. imagery, text and signals)? Finally, how
should multiple observations (under single- and multi-source conditions) be correlated,
processed and maintained? Steinberg elaborates on the notion of data visibility with an
analogy to resource management. Both resource management and data fusion rely on a
estimation. As sensor design is pushed beyond conventional measures of estimation, so too will the expected impact of fusion data. It is thus critical that the synergies between data fusion and neighboring domains be leveraged.
At its core, data fusion is an information-theoretic process enabled through hardware and software products and systems. Subjects such as quality assurance and risk assessment are less developed in the information domain, relative to traditional hardware fields like aerospace or nuclear engineering. This provides a unique opportunity for the practitioner community to extend the Data Fusion knowledge base (and taxonomy) across all phases of system engineering. When held to similar notions of reliability and utility as
mechanical components, sensor data might codify a more holistic framework for specifying product requirements or mission objectives.
System Architecture and Sensor Networks. System architecture has broad
interpretations depending on the domain of interest. It is both an early phase in systems engineering, and an artifact of that process. Crawley (2005) provides the following definition:
"The embodiment of concept, and the allocation of physical/informational function to elements ofform, and definition of structural interfaces among
the elements and with the surrounding context."
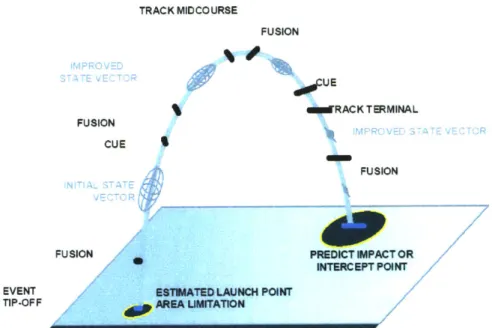
TRACK MIDCOURSE FUSION UE G RACKTERMINAL FUSION CUE FUSION
FUSION PREDICT IMPACT OR
INTERCEPT POINT
EVENT ESTUATED LAUNCH POINT
TIP-OFF AREA UMITATION
Figure 1-6 Fusion Improvement of State Vector, Launch to Intercept (Alberts et al., 2000)
Figure 1-6 demonstrates the increase in battle space awareness through progressive fusing of the state vector. The improvement is measured as an enlargement of intercept area from initial event tip-off.
Varshney (1997) elaborates on the system architecture issues related to distributed sensor networks. Sensor suites can be configured in parallel, so that multiple sensors make
observations concurrently. Likewise, they can be arranged in serial, or tandem,
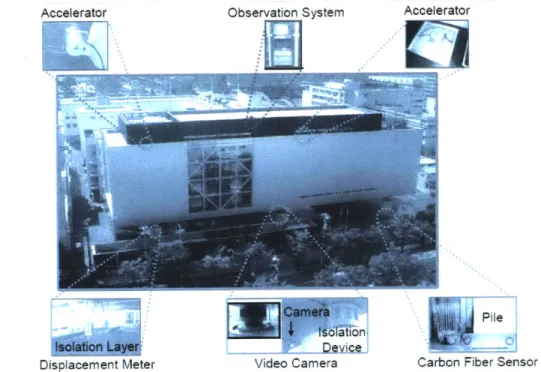
contributing sequential observations. The effects of spatial and temporal aggregation can drive the mission and performance outlook for a system. In the network of Figure 1-7, various sensors are strategically placed throughout the building to monitor structural health.
Accelerator Observation System Accelerator
Displacement Meter Video Camera Carbon Fiber Sensor
Figure 1-7 Sensor Network in a Civil Structure
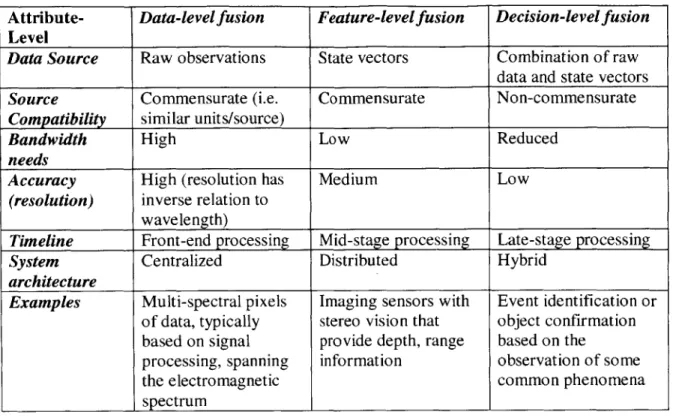
The level at which fusion occurs is another architectural checkpoint of interest to practitioners. It is widely accepted that data can be combined at three levels: data, feature, and decisions. The attributes and requirements of these three modes are summarized in the Hierarchical Classification Scheme of Table 1-4.
Attribute- Data-level fusion Feature-level fusion Decision-level fusion Level
Data Source Raw observations State vectors Combination of raw
data and state vectors
Source Commensurate (i.e. Commensurate Non-commensurate
Compatibility similar units/source)
Bandwidth High Low Reduced
needs
Accuracy High (resolution has Medium Low
(resolution) inverse relation to wavelength)
Timeline Front-end processing Mid-stage processing Late-stage processing
System Centralized Distributed Hybrid
architecture
Examples Multi-spectral pixels Imaging sensors with Event identification or of data, typically stereo vision that object confirmation based on signal provide depth, range based on the
processing, spanning information observation of some
the electromagnetic common phenomena
spectrum
Table 1-4 Hierarchical Classification Scheme
Table 1-4 assumes that the input/output (I/O) transform is restricted to a specific level. If, within a fusion process, the I/O is selected from non-commensurate sets of raw data and feature vectors, it results in a combinatorial explosion of outcomes. An example cited by Varshney is the data gathered by two human eyes; when processed, it returns depth perception (data in-feature-out fusion). Similarly, the pattern recognition process interpolates features and selects a decision (feature-in, decision-out fusion). Complex fusion processing is more likely to draw on these kinds of multi-source,
non-commensurate and differential I/O regimes.
System architecture is not limited to topology or processing. It also involves setting system goals, refining context, decomposing function, and planning for change. These deliverables have been cast in the Conceive-Design-Implement-Operate framework for
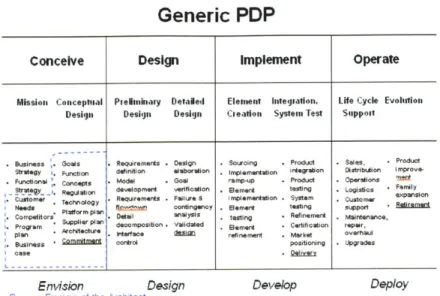
interpreting product development. Crawley (2005) groups architectural responsibility under the conception phase. See Figure 1-8 below.
Generic PDP
Conceive Design Implement Operate
Mission Conceptual Prelianinry Detaled Element integration. Life Cycle Evolution
Design Design Design Cieation System Test Support
Business ~.Goals .Requirements .Design .Souroing .Product .Saleas, .Product
Strategyr I Funcl on defintion elboaton Implementtion irtgralton Dstribtiion i
mprove-Functional Concps . Model . Goal ramp-up .Product . Operations MT&
StraQy_ -. Regul all on development verification . Blemerd testing . Logistics Farily Customer . Requirements . Failure & implementation . System . Customer expansion
Needs Tech ta ny n contingency . Eemert testing support Retirement
Compet s Platform pn DaIl analysis . tasting . Refinemert Mantenanoe, Pro. am .Sitfo-upl decomposition. Validated . Eeme Certification repair,
plan . ctecture . Interface de1iU refinement .Market overhaul
Business .Commitment control positioning . Upgrades
case . Delivery
Envision Design Develop Deploy
Primary Domain of the Architect
Figure 1-8 Architecture tasks in Product Development (Crawley, 2005)
The programmatic and business decisions made at this stage will significantly impact the evolution of the system. Robust architectures should leave the vision of the architect intact, well beyond his or her direct involvement with the project.
Finally, something should be said about architecting for multiple stakeholders and enterprises. This is relevant to the data fusion challenge and addressed by Jackson (2005). Architecture, he says, lends more than concept structure to a system. It is, rather, a fundamental ontology, or vocabulary of terms, which can be applied across domains.
Bridging the Platform-Network Divide. Information fusion is enabled by a variety of sensor technologies. Luo et al. (2002) classified these technologies according to operating principles:
* Mechanical parameter variation (e.g. pressure gauges, optical encoders) * Material parameter variation (e.g. resistance thermometers, strain gauges) * Direct signal generation (e.g. microphones, accelerometers, proximity
sensors (laser or eddy current))
* Ionization based (photo detectors, photomultipliers) * Quantum mechanical (magnetometer)
These technologies span a range of application areas, from structural health monitoring and medical diagnostics to supply chain management. As new applications are
discovered, traditional electro-mechanical sensors are being supplanted by embedded circuits and optical devices. Such miniaturization techniques can improve overall package density and increase performance, as well as lower power consumption. More
recently, many sensors are equipped with wireless transceivers, allowing them to be placed in new environments, or not having to be physically connected, thus forming so called wireless sensor networks (WSN). Finally, software tools have significantly enhanced controllability and communications between sensor hosts. Jackson (2005) discusses the importance of problem framing in both process and product development. He goes on to recommend that solutions for software be considered in implementation rather than structural terms.
The concept of product platforms presents some novel approaches to the design and integration challenges that arise in data fusion (Simpson, 2005). The current lack of information reuse, standardization and benchmarking motivates practitioners across industry to seek unified and controllable development techniques. Platforms help to bridge this gap through architecture and supply chain management. More importantly,
they can help position a firm for cost and scale efficiencies throughout the lifecycle. This is a pre-requisite for growth and sustainability of product lines.
The concept of product lines and families are relatively new to the software engineering domain (Weiss, 2005). The motivation for platform thinking in software systems is similar to that of hardware systems. In systems that undergo long durations/exposures, the involvement of multiple contractor organizations and budgetary restrictions justifies the use of platforms in order to develop "core assets." Weiss uses the example of the Exploration Initiative by NASA, where software-dominant platforms can be used in the development of large, spacecraft control software. At United Technologies Research Center, information platforms need the same rationalization, model-based analysis and evolution plan which influence hardware strategy (Bailey, 2005). The firm Design Continuum finds that platforms make it difficult to reach alignment on future
requirements, but they can nevertheless improve time-to-market, service and reliability (Merle, 2005). The up-front planning costs must be weighed against back-end delivery objectives in determining the extent to which a firm decides to platform its technology. The parallels only go so far, however; a fusion system will have radically different specifications and constraints, which interleave its function and architecture. Such constraints include the effects that disparate sensor location and information sources might have on system design. These constraints influence both how the system is decoupled and the extractable value from a platform strategy.
1.3 How to Think about Data Fusion
The problems associated with data fusion have been laid out. How should we think about the data fusion itself? Is it a product, a process, a system or a capability? The answer, of course, is all of the above. It is a function of the value attached to the information, capability or hardware which depends on data fusion.
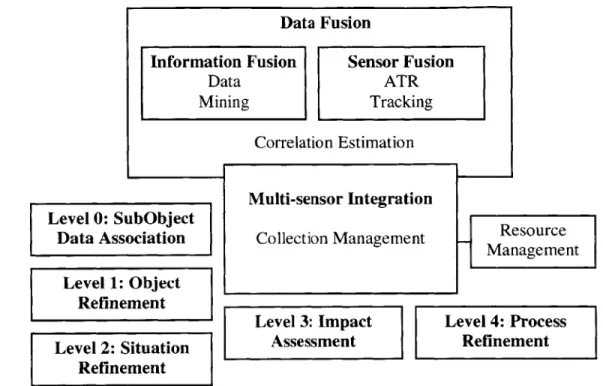
Figure 1-9 places data fusion within the greater context of system terminologies. It encompasses sensor fusion, with reference to defense applications; adjacent to this is a commercial (IT) equivalent, information fusion. Though multi-sensor integration overlaps with data fusion, it does not feature the Correlation and Estimation activity.
Similarly, resource management is an ancillary function extraneous to the whole system but includes collection (data) management. Though fusion-related processes are set in a
holistic context, the diagram is not an adequate semantic decomposition. Nor does it convey the spectrum of capability and infrastructure required to support product-systems. Such a framework is necessary for integrating models with applications. They will be developed in later chapters.
Data Fusion
Information Fusion Sensor Fusion
Data ATR Mining Tracking Correlation Estimation Level 3: Impact Assessment Resource Management Level 4: Process Refinement
Figure 1-9 A Context for Data Fusion (adapted from Bowman et al., 1998)
For the system architect, there are significant multi-disciplinary issues which need to be brought together under a single and robust fusion framework. While fusion techniques have been employed since the development of radar and associated technology, the concepts of detection, estimation and monitoring have taken hold in other sensory domains. It is a multi-disciplinary specialty, drawing on the sciences of pattern and feature recognition, artificial intelligence, operations research and signal/image
processing. And it is largely user-driven; depending on system stakeholders for concept refinement and implementation. As the demand for fusion applications broadens, there is an increased need to better evolve and integrate system design into complex network and
Level 0: SubObject Data Association Multi-sensor Integration Collection Management Level 1: Object Refinement Level 2: Situation Refinement
platform architectures. This challenge can be met if the data fusion community continues to develop the field, formally, as a scientific or engineering field of inquiry.
Commercial Transfer. An important challenge which must be addressed is how best to transfer innovative DF technologies to the commercial realm. The success of data fusion processes in civilian and defense C4ISR systems has promising applications for medical diagnostics equipment, failure detection systems, condition-based maintenance and supply chain management- using RFID and rule-based analytics- among others. The community is currently trying to construct a generic taxonomy which can extend fusion methods beyond its defense systems or earth science applications bias. The need to establish such a lexicon of data fusion terms, measurements and performance models is widely accepted among numerous national and international stakeholders. This is evidenced by the establishment of Data Fusion working groups, both in government and
academia which have been collaborating for several years. The relation of ontology working groups toward the development of comprehensive Semantic Web services will be discussed in Chapter 5.
In Table 1-5, Wald (1999) presents various views on the key design and implementation issues related to sensor fusion.
Topological (Design) Processing (Implementation) Spatial distribution of sensors How to fuse the data
Communications network Select performance measures
Bandwidth Determine relevance of data to objectives Analytic Redundancy Artificial creation of signals based on
synthesis of other partially correlated sensor signals
Global Architecture Select fusion methods and architectures Table 1-5 Sensor Fusion Challenges
Steve Flank (1998) of the Information Systems Office views Data Fusion as a set of strategy-oriented goals. These can be divided between operational and technical objectives:
Operational Goals
* Reduce information overload
" Overcome barriers to interoperability
" Improve speed, cost, and reusability of development
Technical Goals
" Context and Performance Characterization " Intelligent Fusion Strategist
" Fusion Engine Encapsulation
Composing a Solution. Developing the frameworks and taxonomy for complex fusion design is a critical task for the system architect. As data environments become more complex and interconnected, the role of the architect is to manage the ambiguity and interaction of fusion and related-systems. These challenges are no longer the purview of electrical or mechanical engineers, because their effects touch almost every conceivable domain of innovation. Consequently, holistic solutions will synthesize all factors in direct and indirect fields. Other benefits include the expansion of industrial capacity
(factory automation), and defense capability (intelligence and surveillance). This thesis is therefore motivated on a number of different levels, including business, organizational, technical and societal. It will not address the sensor characterizations relating to various applications, such as sensitivity, voltage and current levels, linearity, impedances, gain, offset and drift. Rather, this thesis will address sensor applications in the 'macro' (in the large), investigating design and development challenges in the integration and
implementation of data fusion technology onto sensor networks and platforms.
1.4 Thesis Objectives
In summary, this thesis seeks to address the global issues related to fusion design, and the guidelines for selecting a specific architecture given an implementation task. The objectives are defined as follows:
" To review current models of data fusion which are actively utilized in various scientific/engineering communities (Chapter 1)
" To relate the concept of fusion to the operation of different types of sensors and sensor platforms (Chapter 2)
* To provide a brief overview of current fusion algorithms and methods (Chapter 3)
* To present basic fusion processes as they occur in a C4ISR system (Chapter 4) * To model an information fusion ontology using Object-Process Methodology
and to discuss its relevance to the Semantic web (Chapter 5)
* To elaborate a set of fusion engineering and management architectures in support of complex system design (Chapter 6)
CHAPTER 2: SENSORS AND SENSOR PLATFORMS
2.1 Sensor Categories
The value of data fusion lies in the breadth of sensor categories available to the designer. The traditional applications normally cull these sensors from the electromagnetic
spectrum. For instance, in data fusion through remote sensing, electro-magnetic energy reflected or emitted from objects is measured and reported. However the energy from
acoustic, ultrasonic, magnetic and seismic waves all offer potentially rich sources of information on which to design fusion system architectures.
2.2 Single Sensor Systems
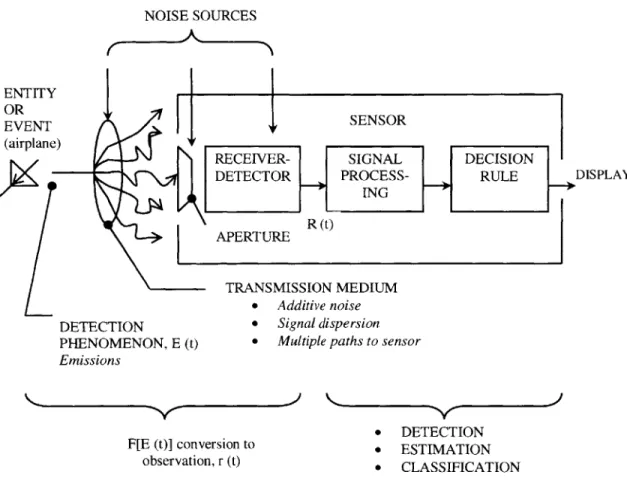
A sensor is comprised of a transducer which converts energy entering an aperture into lower frequencies from which targets and background information may be discerned through a data processor. Digital sensors, actuators and low power RF radios all help to enable the functionality of a single sensor system (NSF, Directorate for Computer and information Science and Engineering) through integration of a single chip in a
processor's memory. Figure 2-1 illustrates the basic components of a typical sensor system. Examples of sensor apertures include antennas (for RF energy), optics (for IR-UV-visible light energy) and microphones/hydrophones (for acoustical energy).
NOISE SOURCES
ENTITY
OR SE SO
EVENT ,, SENSOR
(airplane)
RECEIVER- SIGNAL DECISION
DETECTOR PROCESS- RULE DISPLAY
ING
R (t) APERTURE
TRANSMISSION MEDIUM 0 Additive noise
DETECTION 0 Signal dispersion
PHENOMENON, E (t) 0 Multiple paths to sensor Emissions
0 DETECTION F[E (t)] conversion to * ESTIMATION
observation, r (t) 0 CLASSIFICATION
Figure 2-1 A sensor system (adapted from Waltz and Lfinas, 1990)
There are significant limitations due to single sensors that should be mentioned. For instance, weather, clutter and noise may interfere with the recognition of an object by a single sensor system. A key determinant to the success of a single sensor system is the orientation of the mission, and whether there are sufficient data processing resources that are localized in each sensor (Klein, 1999).
2.3 Multi-Sensor Systems
Multi-sensor systems offer numerous advantages over single sensors when it comes to the fundamental tasks of utilizing and delivering information toward a specific objective. For instance, Landsat- 1, the first earth observation satellite launched in 1972, was a historical program designed to obtain information on agricultural and forestry resources, geology and mineral resources, hydrology, pollution, oceanography and marine resources, among other objectives. The system acquired visible light and near infrared earth photos, as well as radiometric Earth images, through a multi-sensor vidicon and multi-spectral scanner. The data was processed and stored in wide-band video tape recorders which offered
'near-global' coverage capability2 .The combination of microwave, millimeter wave, infrared and visible sensors has also been used in daily weather forecasting.
Furthermore, the collection of ground-based and aerial sensor data has been useful for characterizing the targets which are being imaged by these sensors.
The relative performance of multiple sensors over single sensor systems can be illustrated through the graph in Figure 2-2, below, on detection probability. If performance is measured over some nominal signal-to-noise ratio, the profile shows the improvement of a tri-sensor suite (with MMW and IR sensors) over a single millimeter wave sensor. When the system false alarm rejection is divided equally among three sensors, there is a
marked increase in false alarm probability 102 (versus 10-6 for a single sensor system).
More importantly, the voting fusion algorithm used here combines the signal processing in series and parallel combinations that increases the detection probability for both
nominal and suppressed target signature levels. When detection probability is the priority, the tradeoff in false alarm sets versus detection probability clearly favors the multiple sensor system- 63% compared to 27% for the reduced-signature target. False alarm sets indicate that the measurement is unreal and to be ignored.
Tri-sensor suite 85% to 63%
Pfa = 10-2
MMW Radar as
the only sensor 70% to 27% 6 Pfa =10~6 Suppressed
4-
Nominal I I 4 8 12 Signal-to-Noise Ratio 16Figure 2-2 Multiple sensor versus single sensor performance with suppressed target signatures (adapted from Klein, 1999)
In addition to the improved detection performance noted above, multiple sensors offer: Improved system reliability through redundant sensor suites
Increased dimensionality of the measurement space Enhanced spatial and temporal coverage
Enhanced confidence about the measurement sets.
However, one major challenge when measuring the same object or phenomenon with multiple sensors at the same time is that of calibration. In large scale sensor networks, manual, single sensor calibration does not work. Complexities from scaling, limited
Detection Probability (%) 95 -90 -50 -10 -1.0 -0.5 -0.1
-access to sensors in the field and sensor drift require alternative measures to be utilized. Each sensor has its own calibration and the multiple sensors may not agree. This problem has been resolved through a process of collaborative calibration that systematically corrects errors (biases) in sensor readings. One scheme proposed
(Bychkovsky et al, 2003) relies on redundancy in measurements due to over-deployment of sensor assets. This scheme first derives functions relating to the output discrepancies
of neighboring sensors, and then uses a heuristic method to address pair-wise inconsistencies in the network.
"Y.theut zi-pnozi Mcwledse
i~r -~:kacwlede
4
Itffri=o Number
Figure 2-3 Identification probability convergence
Finally, another way to interpret the detection-false alarm tradeoff is through target identification "correctness." Figure 2-3 (Kadar, 200 1) shows that correct target ID is improved with a priori knowledge, both in terms of the detection probability as well as the number of iterations required for detection. The monotonic increase in probability to
1 for the correct ID, and to 0 for the incorrect ID, is known as ID convergence.
2.4 Active versus Passive Sensors
Sensors are often classified as either active or passive depending on their signal conditioning. An active sensor requires external sources of excitation, while passive sensors generate their own electrical output (without requiring external voltages or currents). The need then, for external active circuitry to produce electrical output signals from the sensor determine whether, structurally, a sensor should be classified as active or passive.
In the microwave spectrum, these definitions take on a slightly different meaning. Active microwave sensors provide their own source of radiation to illuminate a target, as in RADAR imaging. They use radio waves to detect objects and determine their position, range, or shape. Active sensors tend to provide more information than passive sensors, at the cost of increased power consumption and interference when other active sensors are in operation and easier detectability of the sensor. For instance, active MMW radars operate in mono-static and bi-static configurations. In the former, the transmitter and receiver are collocated on the same platform so that the receiver processes energy that is backscattered from objects in the FOV. In the bi-static mode, the transmitter and receiver are spatially disconnected, reducing the type and versatility of applications.
Passive microwave sensors record energy emitted by the atmosphere or surface, reflected by the surface or transmitted from the subsurface. Another example of a purely passive sensor is an electro-optical sensor, which in military applications can offer stealthy (non-detectable) operation. Since passive sensors depend on naturally occurring energy, they are limited in the location and timing of their operation. For instance, the
amount of solar radiation at polar latitudes is insufficient for visible light sensors (during the polar night), and limits the use of passive detectors to low latitudes. The Thematic Mapper on Landsat satellites is an important exception to this design limitation, as it taps into seven different sensor bands. These bands are sensitive to numerous ranges of the electromagnetic spectrum, from the visible to thermal infrared portions of the spectrum. The Landsat is therefore launched at strategic times to ensure that the satellite will make passes during optimal periods of solar radiation (sun-synchronous orbits).
2.5 Sensor Platforms
A sensor platform is a vehicle or system used to carry the sensor. Example platforms are shown in Figure 2-4 (a-b). Typical sensor platforms in the C4ISR arena include satellites and aircraft (manned or unmanned), but can also include balloon kits for low-level
surveillance (remote sensing), ladder trucks and a host of other mobile or stationary devices. The fundamental selection factor is the altitude that determines the ground
resolution in turn sets the IFOV (Instantaneous field of view) of the sensor on board.
T
Figure 2-4 (a) Wireless reconfigurable Figure 2-4 (b) Truck mount
Platform at Dartmouth ground-based phased array
Ground-based sensors offer some cost advantages in terms of maintenance and operation compared to aerial platforms. They can be placed on structures in buildings, towers or on board terrain vehicles. The complexity and maintenance of the ground-based sensor is dependent on the design involved. For instance, highly complex phased array antennas are ground-based sensors with thousands of apertures array elements, see Figure 2-4 (b). The advent of AESA (Active Electronically Steered Arrays) has replaced the need for
mechanical turntables that require maintenance of bearings, hydraulics and auxiliary components.
Aerial platforms are used to elevate the sensor above the earth's surface for better coverage. Cameras mounted on aircraft constitute a type of aerial sensor that is used to monitor land use practice, locate fires and produce high resolution mapping of remote or inaccessible regions. Airborne scanning devices are becoming generally available, and can record radiation over a wider spectral range than photographic devices. They also offer the advantage of providing data in multi-channel digital format (Harrison and Jupp, 2000). They are considered easier to reuse than satellite or air platforms whose design objective might be based on remote data and image sensing. An exception to this category is the Unmanned Aerial Vehicle (UAV) which has shown to be a considerably less expensive platform for communications, intelligence and surveillance information gathering.
CHAPTER 3: OVERVIEW OF FUSION ALGORITHMS &
METHODS
3.1 Fusion of Numerical Properties: The Kalman Approach
4State representation of a model is an important element in the fusion of numerical properties. In 1960, R.E. Kalman's "New Approach to Linear Filtering and Prediction Problems" laid forth the groundwork for fusion of numerical properties.
The state of a system is represented by the dynamic world model, M(t), whose list of primitives describe a state at time t.
M(t) {PI(t), P2(t), ..., Pm(t)}
Each primitive Pi in the system model above is identified by unique identifier, or label, as well as a confidence factor.
P(t)= {ID. X(t), CF(t)} Where,
P(t) is the local descriptor of the world model M(t);
ID is the label by which the primitive may be identified andrecalled;
Xt) is a state estimate; and CF(t) is the confidence factor.
We add an element of random noise to the observation Y(t), denoted by N(t).
The actual world state is estimable from the collection of the set of primitives of N properties,
k(t
= X i (t). . X ),)... in~t)
Incorporating uncertainty into this model can be represented by the expected deviation between the estimated and true vector. It is approximated with the covariance matrix between the estimated and actual system state:
Ct)=. E [X(t) - X)]X(t) -X(t)}] T}
The key result from Kalman's work is the development of the weighting matrix known as the Kalman gain, defined using the prediction uncertainty, C*y (t).
K(t) := C*x(t YHxT [ C*y(t) - Cy(t)] -l
Where,
HxT is matrix transformation of the coordinate space of the estimated state X(t).
Hx is an observation process that projects onto the world an observation vector Y(t). This relative weighting between the prediction and observation leads to the ability to update the estimated properties and derivatives via the difference between predicted and
observed properties.
3.2 Bayesian Methods
In this section5, we present Bayesian methods for data fusion. Whereas the Kalman
approach to data fusion focuses on the updating of properties, Bayesian methods focus on updating probabilities.
The Bayesian form is derived from the conditional probability of the intersection of two events.
P (BC I A) = p (C I AB) p (BIA)
This can be rewritten as,
P (CIAB) = p (BCIA) / p (BIA).
When C is interpreted as a set of mutually exclusive and collectively exhaustive set of outcomes, we can derive the following,
P(CIjAB) = p (B CA) p (Ci JA)
Z P( B
I
CjA) p (Cj IA)Where,
p (Ci
IA)
is an a priori (or prior) probability of Ci, based upon the state of information A;p (Ci |AB) is the a posteriori (or posterior) probability of Ci, given the data B and the prior state A;
p (B
I
Ci A) is the likelihood function, which is the likelihood of observing the data B given Ci and the prior state of information.jj P( B
I
CjA) p (Cj JA) is the pre-posterior or probability of the data occurring given the state of prior information, conditioned on all possible outcomes of Cj.An influence diagram for Bayesian identification fusion is presented in Figure 3-1. Various sensor reports are converted in a given time period to likelihood functions. We adapt an example (Waltz and Llinas, 1990) regarding IFFN and ESM sensors.
Sensor Type ID Joint
Report Given Sensor
Report Report RAID RAID/ Joint Report "A" "B"/T "4B"1"B Previous Period Posterior Current Period Posterior :_ _ _ _ Type N
Figure 3-1 Influence Diagram
The interrogation chain requires that sensor response be represented in the form of some sort of hypothesis or declaration, for later probabilistic combining. The IFFN sensor responds with a "Friend" declaration, PIFFN (Data
I
FRD) when it receives a validresponse to its query. Similarly, the electronic support measure would make a positive identification based on the type of aircraft it detects PESM (data
I
Tk). This results in the following equations:PIFFN (data
I
T) = PIFFN (dataI
FRD) -p (FRDI T) + PIWFN (dataI
FOE) -p (FOEI
Tk) + PIrN (data NEU) -p (NEUI Tk)When there is no neutrality measure, then we can eliminate the final term.
PIFFN (data
I
T) = PIN (dataI
FRD) -p (FRDI
T)+ PI1 N (data not FRD) - p (not FRD
I
Tk)Now that we have derived the type ID given report, the joint sensor report can be
computed. This example concerns non-commensurate sensors, i.e. they rely on different phenomena (IFFN and ESM). Therefore, the probabilities are considered independent and the joint likelihood values are:
P (data
I
Tk) =H
pi (data IT)For all k, or types of aircraft.
We can confirm this result numerically as follows: PIFFN (data
I
Tk = PIFFN (dataI
FRD) - p (FRDI
Tk)+ PIFFN (data FOE) - p (FOE
I
Tk) + PIFFN (dataI
NEU) -p (NEUI
Tk)PI1 N (data | FRD) = 0.6 PIFFN (data
I
FOE) = 0.2PI1 N (data | NEU) = 0
PESM (data FRD) = 0.3
PESM (data F FRD) = 0.4 PESM (data F FRD) = 0
To calculate the likelihoods based on type of aircraft Tk , we can multiply the above likelihoods by the binary probabilities of p (FRD
I
Tk) =1, p (FOEI
Tk) =0 and p (NEUI
Tk) = 0. Thus, when there is no neutrality measure, for a scenario in which only one sidehas a given type of aircraft,
PI1 N (data Ik) PIFFN (data
I
FRD) -p (FRDI
Tk)+ PI1 N (data
I
not FRD) - p (not FRDI
Tk)PIFFN (data ITk) =(0.6) x ()+(0.2) x (0) = 0.6
PESM (data I Tk) = (0.3) x (1) + (0.4) x (0) = 0.3
and
So that the joint likelihoods are
P (data