HAL Id: hal-01310716
https://hal.sorbonne-universite.fr/hal-01310716
Submitted on 3 May 2016
HAL is a multi-disciplinary open access
archive for the deposit and dissemination of
sci-entific research documents, whether they are
pub-lished or not. The documents may come from
teaching and research institutions in France or
abroad, or from public or private research centers.
L’archive ouverte pluridisciplinaire HAL, est
destinée au dépôt et à la diffusion de documents
scientifiques de niveau recherche, publiés ou non,
émanant des établissements d’enseignement et de
recherche français ou étrangers, des laboratoires
publics ou privés.
Distributed under a Creative Commons Attribution| 4.0 International License
Classification algorithms with multi-modal data fusion
could accurately distinguish neuromyelitis optica from
multiple sclerosis
Arman Eshaghi, Sadjad Riyahi-Alam, Roghayyeh Saeedi, Tina Roostaei,
Arash Nazeri, Aida Aghsaei, Rozita Doosti, Habib Ganjgahi, Benedetta
Bodini, Ali Shakourirad, et al.
To cite this version:
Arman Eshaghi, Sadjad Riyahi-Alam, Roghayyeh Saeedi, Tina Roostaei, Arash Nazeri, et al..
Classifi-cation algorithms with multi-modal data fusion could accurately distinguish neuromyelitis optica from
multiple sclerosis. Neuroimage-Clinical, Elsevier, 2015, 7, pp.306-314. �10.1016/j.nicl.2015.01.001�.
�hal-01310716�
Classi
fication algorithms with multi-modal data fusion could accurately
distinguish neuromyelitis optica from multiple sclerosis
Arman Eshaghi
a,b, Sadjad Riyahi-Alam
a, Roghayyeh Saeedi
a, Tina Roostaei
a,c, Arash Nazeri
a,c, Aida Aghsaei
a,
Rozita Doosti
a, Habib Ganjgahi
d, Benedetta Bodini
e, Ali Shakourirad
f,g, Manijeh Pakravan
b, Hossein Ghana
3ati
b,
Kavous Firouznia
b, Mojtaba Zarei
d, Amir Reza Azimi
a, Mohammad Ali Sahraian
a,f,g,⁎
aMS Research Center, Neuroscience Institute, Tehran University of Medical Sciences, Tehran, Iran
bAdvanced Diagnostic and Interventional Radiology Research Center (ADIR), Tehran University of Medical Sciences, Tehran, Iran c
Interdisciplinary Neuroscience Research Program, Tehran University of Medical Sciences, Tehran, Iran
d
National Brain Mapping Center, Department of Neurology, Shahid Beheshti University of Medical Sciences, Tehran, Iran
eCentre de Recherche de l3Institut du Cerveau et de la Moelle Pinire, Universitat Pierre et Marie Curie, Inserm, Paris U975, France f
Department of Radiology, Sina Hospital, Tehran University of Medical Sciences, Tehran, Iran
g
Iranian Center of Neurological Research, Neuroscience Institute, University of Medical Sciences, Tehran, Iran
a b s t r a c t
a r t i c l e i n f o
Article history:
Received 28 October 2014
Received in revised form 13 December 2014 Accepted 3 January 2015
Available online 9 January 2015 Keywords: Multiple sclerosis Neuromyelitis optica Differential diagnosis Computational diagnosis Multi-modal imaging
Neuromyelitis optica (NMO) exhibits substantial similarities to multiple sclerosis (MS) in clinical manifestations and imaging results and has long been considered a variant of MS. With the advent of a specific biomarker in NMO, known as anti-aquaporin 4, this assumption has changed; however, the differential diagnosis remains challenging and it is still not clear whether a combination of neuroimaging and clinical data could be used to aid clinical decision-making. Computer-aided diagnosis is a rapidly evolving process that holds great promise to facilitate objective differential diagnoses of disorders that show similar presentations. In this study, we aimed to use a powerful method for multi-modal data fusion, known as a multi-kernel learning and performed automatic diagnosis of subjects. We included 30 patients with NMO, 25 patients with MS and 35 healthy volun-teers and performed multi-modal imaging with T1-weighted high resolution scans, diffusion tensor imaging (DTI) and resting-state functional MRI (fMRI). In addition, subjects underwent clinical examinations and cogni-tive assessments. We included 18 a priori predictors from neuroimaging, clinical and cognicogni-tive measures in the initial model. We used 10-fold cross-validation to learn the importance of each modality, train andfinally test the model performance. The mean accuracy in differentiating between MS and NMO was 88%, where visible white matter lesion load, normal appearing white matter (DTI) and functional connectivity had the most impor-tant contributions to thefinal classification. In a multi-class classification problem we distinguished between all of 3 groups (MS, NMO and healthy controls) with an average accuracy of 84%. In this classification, visible white matter lesion load, functional connectivity, and cognitive scores were the 3 most important modalities. Our work provides preliminary evidence that computational tools can be used to help make an objective differential diag-nosis of NMO and MS.
© 2015 The Authors. Published by Elsevier Inc. This is an open access article under the CC BY-NC-ND license (http://creativecommons.org/licenses/by-nc-nd/4.0/).
1. Introduction
Neuromyelitis optica (NMO) is a demyelinating disorder with man-ifestations similar to those of multiple sclerosis (MS). The two condi-tions are so similar that NMO has long been considered a variant of MS rather than a separate disease (Lennon et al., 2004).
Anti-aquaporin-4 (AQP4) is an antibody recently discovered in serum sam-ples that can be used to distinguish MS from NMO (Lennon et al., 2004). However, differentiating NMO from MS may still pose difficult challenges for clinical decision-making (Jarius and Wildemann, 2010;
Wingerchuk et al., 2006) because an ideal anti-AQP4 assay requires the newer techniques (e.g., cell-based) and samples from a patient over time rather than a single serum sample drawn during an NMO clinical attack (Jarius and Wildemann, 2010). Thus, a subset of patients remains seronegative. Consequently, recent efforts have fo-cused on better characterizing the differential features of NMO (Sato et al., 2014).
* Correspondence to: Multiple Sclerosis Research Center, Neuroscience Institute, Tehran University of Medical Sciences, Tehran 1136746911, Iran. Tel: +98 21 66348572; fax: +98 21 66348570.
E-mail address:[email protected](M.A. Sahraian).
http://dx.doi.org/10.1016/j.nicl.2015.01.001
2213-1582/© 2015 The Authors. Published by Elsevier Inc. This is an open access article under the CC BY-NC-ND license (http://creativecommons.org/licenses/by-nc-nd/4.0/).
Contents lists available atScienceDirect
NeuroImage: Clinical
These efforts parallel the advancement of magnetic resonance imag-ing (MRI) and computational tools, which are drawimag-ing increasimag-ing inter-est among other candidate biomarkers. Potential imaging biomarkers might include lesion morphology in ultra-highfield MRI (Sinnecker et al., 2012), gray matter damage (Calabrese et al., 2012;Rocca et al., 2004), normal-appearing white matter (Pichiecchio et al., 2012), and resting-state functional MRI (fMRI) (Liu et al., 2011). Moreover, another distinguishing feature could be cognitive functioning, which is affected in both MS and NMO by various underlying pathomechanisms (Calabrese et al., 2012;Saji et al., 2013). However, previous studies have focused on a limited set of measures, and a unified model that combines imaging, cognitive and clinical data is still lacking. Similar au-tomatic diagnostic models have been successfully used to evaluate Alzheimer3s disease and traumatic brain injury (Klöppel et al., 2008;
Lui et al., 2014), and it would be interesting to apply them to patients with two similar demyelinating disorders.
Although information from multiple sources has a great promise for application in clinical settings, their interpretation is not easy. A new method that has addressed this problem is multiple-kernel learn-ing (Sonnenburg et al., 2006;Zhang et al., 2011). Kernels provide func-tions that transform data into another mathematical space in which separation of subjects may be easier, and when they are combined, weights associated with each kernel could also be learned. This ap-proach provides an intuitive interpretation for the importance of each source of information (Sonnenburg et al., 2006). So far previous works in MS have used single kernel methods (Bendfeldt et al., 2012;
Hackmack et al., 2012;Weygandt et al., 2011) on a limited number of MRI modalities.
Here, we aimed to develop a unifying model that incorporates clini-cal, imaging and cognitive measures to predict the diagnosis of each subject. First, we selected a priori measures that are potentially affected during MS or NMO (Table 1). Next, we used a multi-kernel classifier to investigate the importance of each modality and calculated the accuracy of discrimination between MS and NMO with cross-validation. We hy-pothesized that multi-modal classification would achieve high accuracy in differentiating MS from NMO. To further validate our approach, we implemented the same procedure to differentiate patients with each of these disorders from healthy controls, and in a multi-class classi fica-tion problem, we differentiated between all three groups of patients with MS, NMO and healthy controls.
2. Materials and methods 2.1. Settings and participants
A total of 35 healthy controls, 30 patients with NMO, and 25 patients with relapsing–remitting MS were included in this study (Weier et al., 2014). All patients were recruited at Sina MS Research Center, Sina Hos-pital, Tehran, Iran between 2009 and 2012. We included patients based on previously acknowledged criteria: MS diagnosis according to the McDonald criteria, which were revised in 2005 (Polman et al., 2005), and NMO diagnosis according to Wingerchuk3s criteria, which were re-vised in 2006 (Wingerchuk et al., 2006). Exclusion criteria included (1) clinical attacks within 6 weeks of study initiation, (2) IV methyl-prednisolone administration during the prior 6 weeks, (3) pregnancy and (4) neurological or psychiatric disorders other than MS or NMO. Among the 30 patients with NMO, 56% (17/30) were positive for anti-aquaporin-4 using indirect immunofluorescence (reference laboratory:
http://www.bioscientia.de, Ingelheim, Germany), whereas all patients with MS were negative. Healthy controls, patients with MS and patients with NMO were matched according to age, gender, and educational level. All patients underwent a full neurological assessment and were scored on the Expanded Disability Status Scale (EDSS) (Wingerchuk et al., 2006) in addition to the 9-hole peg and 25-foot walk tests (Cohen et al., 2001). All subjects signed written consent forms in accor-dance with the Declaration of Helsinki (WMA, 2000). The study
protocol was approved by the Ethical Committee at Tehran University of Medical Sciences.
2.2. Cognitive assessment
A neuropsychologist assessed all subjects according to our standard protocol (Eshaghi et al., 2012). Based on our previous study, we chose the two most sensitive cognitive tests identified in Iranian MS patients, namely the Symbol Digit Modality Test (SDMT) and the California Ver-bal Learning Test version 2 (CVLT-II) (Eshaghi et al., 2012). Test admin-istration and scoring are described inTable 1. All subjects underwent cognitive assessment 1 week prior to MRI scanning. None of the patients experienced any clinical relapses during this period.
2.3. MRI protocol
Scanning was performed using a 3 T Siemens Trio scanner (Erlangen, Germany) with a standard 12-channel head coil. A unique protocol was used for all participants that included axial FLAIR (TR/TE = 9000/93 ms, slice thickness = 3 mm, FOV = 220 mm, TI = 2500 ms), axial T2 (TR/TE = 4000/91 ms, slice thickness = 3 mm, 42 slices), 3D magnetization-prepared rapid acquisition with gradient echo (3D-MPRAGE, TR/TE = 2530/3.44 ms, 1 mm isotropic voxel size, TI = 1100 ms, FOV = 256 mm), and axial DTI (single-shot diffusion-weighted EPI, b = 1000 s, 30 directions with 2 averages, TR/TE = 12,000/90 ms, 1.7 × 1.7 × 2 mm voxel size, 68 slices with no gap, 4 diffusion runs without diffusion weighting (b = 0/s)). Functional MRI images were obtained during a resting state for 7.5 min using a T2*-weighted EPI sequence with whole-brain coverage (TR/TE = 2200/30 ms, 40 interleaved slices with thickness = 3 mm and no gap, voxel size isotropic 3 mm with 200 volumes). During fMRI acquisition, subjects were asked to keep their eyes closed and to avoid thinking of anything in particular.
2.4. Image analysis
We used a hypothesis-based approach to select certain measures that are known to be affected by MS or NMO, which are shown inTable 1. Ac-cordingly, we calculated the following measures from the MRI data: 1) average cortical thickness in regions defined according to the Desikan–Killiany atlas (Desikan et al., 2006) (T1-weighted images), 2) av-erage of deep gray matter nuclei volumes (T1-weighted images), 3) T1 hypointense lesion load 4) T2/FLAIR lesion volume, 5) corticospinal tract fractional anisotropy (FA) (DTI), 6) optic radiation FA (DTI), 7) cor-pus callosum FA (DTI), 8) sensorimotor network connectivity (fMRI), 9) default mode network connectivity (fMRI), 10) visual network con-nectivity (fMRI), and 11) cross-sectional upper cervical cord area (T1). Evidence supporting the selection of each measure is provided inTable 1. 2.4.1. Lesion segmentation: visible white matter lesions
We segmented hyperintense lesions on FLAIR sequences with the le-sion segmentation toolbox in SPM8 (Schmidt et al., 2012). Lesion binary maps were then manually verified using T2-weighted images and edited. We then used thefinal white matter (WM) binary lesion maps to calculate the lesion load andfill hypointense lesions in T1 -weighted images with the mean intensity of normal-appearing white matter (Popescu et al., 2014). Separately, we manually segmented T1 hypointense lesions on the unprocessed T1-weighted images using Jim software and calculated the lesion volume for each subject. 2.4.2. Cortical thickness analysis
We analyzed the cortical thickness and subcortical volumes of lesion-filled 3D-MPRAGE images using FreeSurfer 5.10 as described by Fischl et al. (Dale et al., 1999). Thefinal results were manually con-firmed for each subject, then the pipeline was performed again in 22 subjects to achieve satisfactory segmentation. The average thickness of
Table 1
Measures that were used a priori to construct disease prediction models. Measures (predictors) and
modalities
Description Previous evidence in MS Previous evidence in NMO Method used for calculation Modality: gray matter
Cortical thickness Average of cortical thickness (in millimeters) from cortical regions in the Desikan-Killiany atlasa
.
Gray matter is affected from the early stages by
demyelination, axonal loss and neuronal degenerationb
.
Gray matter is affected to a much lesser extent than in MS. Damage is secondary to astrocyte loss with less demyelinationc
.
FreeSurfer software: thickness between white matter surface and pial surface.
Deep gray matter (DGM) Average volumes of the thalamus, pallidum, caudate and globus pallidus (in cubic millimeters, both hemispheres).
DGM nuclei (specifically the thalamus) are affected from the early stages. Damage may be secondary to axonal loss in other regions or primarily due to iron accumulation or demyelinationb
.
Nuclei are also affected, possibly to a lesser extent than in MSc
.
Volumetric pipeline of subcortical segmentation in FreeSurfer.
Modality: visible WM lesions
T2/FLAIR lesion load Average of visible white matter lesion volume (cubic millimeters).
Visible lesions are the basis for a diagnosis of MS.
A pattern that is distinct from that of MS in the
hypothalamus and brain stem, or sometimes a pattern similar to that observed in MSd
.
Jim software and SPM8:FLAIR lesion mask was calculated automatically (see text). Next, it was manually edited while comparing to T2 images. T1 lesion load Average of hypointense lesion
volume (cubic millimeters).
T1 hypointense lesions could be better correlated with disability than T2 lesionse
.
Could be seen in destructive lesionf
.
Jim software: Hypointense lesions were manually marked and segmented by an expert neurologist
Modality: DTI
Corpus callosum fractional anisotropy (normal-appearing white matter only)
Average of fractional anisotropy (FA) along the corticospinal tract, localized according to the Jülich histological atlas after exclusion of the visible lesion mask (Fig. 1D).
A hallmark of MS; decreased white matter integrity is easily detectable in this areag
.
May be affected secondary to non-specific white matter lesionsg
.
FSL software: binary mask of the corpus callosum was warped to the subjects3 native space; the visible white matter lesion mask was subtracted; and the mean average of FA was calculated.
Corticospinal tract FA (normal-appearing white matter only)
Average of FA along the corticospinal tract, localized according to the Jülich histological atlas after exclusion of the visible lesion mask (Fig. 1D).
Presents a loss of integrity, which is associated with disability and clinical progressionh
.
May present damage secondary to myelitisi.
FSL software: as described above, except with the corticospinal binary mask (bilateral).
Optic radiation
(normal-appearing white matter only)
Average of FA along the bilateral optic radiation tract (reference atlas: Jülich histological atlas) after exclusion of the visible lesion mask (Fig. 1D).
Damaged in MS, secondary to trans-synaptic degeneration in the optic nerve and Wallerian degeneration due to local lesionsg
.
DTI studies have revealed a loss of integrity in patients with NMO with distinct pathogenic processes compared with those of MSh
. FSL software: as described above. Modality: fMRI Sensorimotor network connectivity
Average of Z-scores in the net-work identified using group in-dependent component analysis (ICA) in healthy controls (Fig. 1B).
Presents aberrant connectivity, which may be due to compensatory mechanisms or maladaptive plasticityi.
Only a handful of studies are available; may show aberrant connectivityj.
FSL software: independent components analysis (ICA) separates signals into underlying sources. Next, a dual-regression approach was used to extract functional connectivity values (Z-scores). Default mode network
connectivity
Average of Z-scores in the net-work identified using group ICA in healthy controls (Fig. 1C).
Presents abnormal connectivity even in patients with clinically isolated syndrome and is known to be affected in other neurological or psychiatric disordersi
.
A few studies have shown changes compared to healthy controlsj.
FSL software: the same method used for the sensorimotor network.
Visual network Average of Z-scores in the visual network identified using group ICA.
Visual network supports a “basic” function and failed to show any change in a previous study, it will be used here as a control networki.
– Same method used for previous two networks.
Upper cervical cord cross-sectional area
Average cross-sectional area from foramen magnum to C2.
Presents volume loss and is associated with disabilityg
.
Primarily affected during NMO.
Jim software: semiautomatic reconstruction of the spinal cord, followed by calculation of the average cross-sectional area (square millimeters). Modality: clinical scores
EDSS EDSS score, assessed by the neurologist providing care.
Used as an outcome measure in MS clinical trials.
Originally developed for MS, but also applied to NMO.
Neurological examination (ranging from 0–10). 9-Hole peg test Part of the multiple sclerosis
functional composite (MSFC). Tests upper motor disability and cerebellar functions.
Associated with motor performance and cerebellar coordination.
Could be more impaired in NMO due to more devastating attacks.
Average of two trials with dominant and non-dominant hand in seconds.
Table 1 (continued) Measures (predictors) and
modalities
Description Previous evidence in MS Previous evidence in NMO Method used for calculation 25-Foot walk test Part of the multiple sclerosis
functional composite (MSFC).
Associated with motor performance and cerebellar coordination.
Could be impaired in NMO secondary to more severe attacks.
Average of two trials in which patients walk a 25-foot distance as quickly as possible, measured in seconds. Low-contrast (2.5%) visual test Sloan low-contrast letter acuity
is a standardized measure suggested in addition to the MSFC.
This test has been extensively validated in MS trials and specifically relates to optic neuritis and general optic nerve damage in MSk
.
Validated in NMO and associated with retinal axonal and neuronal lossk
.
Binocular testing: the total number of correct letters was counted and reported.
Modality: cognitive scores Symbol Digit Modality Test
(SDMT)
Evaluates information processing and working memory domains: 10 abstract symbols are paired with numbers ranging from 1 to 10. The subject is given 90 s to pair new symbols with the correct number.
The most sensitive test able to detect cognitive impairment associated with MS in the Iranian populationl
.
Also affected in NMO due to cortical degenerationm
.
Neuropsychological battery administered by a neuropsychologist: the total number of symbols correctly paired with the corresponding numbers in 90 sl
. California Verbal Learning Test
(CVLT) version 2
Evaluates short- and long-term verbal memory: a list of 10 words that are read to the subject 5 times; the subject then recalls the words, and the response is recorded. After 20 min, the subject is asked to recall the words.
The second most sensitive cognitive test in the Iranian population and used to detect MS-related cognitive weaknessl
.
Verbal memory is also affected in NMOm
.
Neuropsychological battery administered by a neuropsychologist: the total number of correct words over thefirst 5 trials is defined as the“total learning score.” The total number of recalled words after 20 min is defined as the “delayed recall score.”
a Dale et al. (1999). b Geurts et al. (2012). c Popescu et al. (2010). d Kim et al. (2012). e Giorgio et al. (2014). f Filippi et al. (1999). g Wegner (2013). h
von Glehn et al. (2014).
i Roosendaal et al. (2010). j Liu et al. (2011). k
Balcer and Frohman (2010).
l
Eshaghi et al. (2012).
m
Saji et al. (2013).
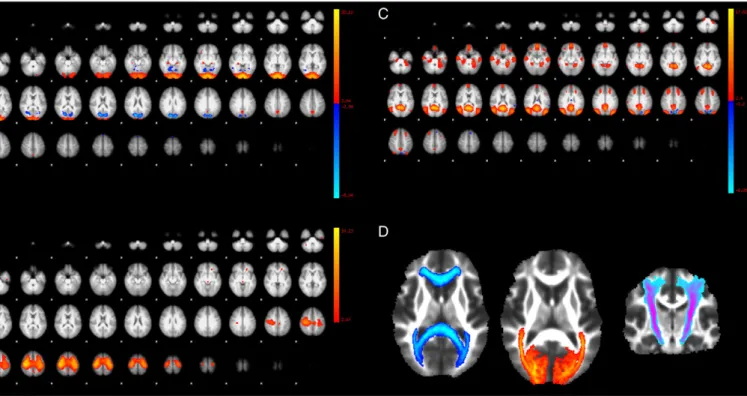
Fig. 1. (A, B and C) show selected independent component analysis maps from resting-state networks of healthy controls that correspond to the (A) visual, (B) sensorimotor, and (C) default mode networks. (D) shows Jülich histological probability masks of (from left to right) the corpus callosum, optic radiation and corticospinal tracts.
all cortical parcellations and the average volumes of the thalamus, cau-date nucleus, putamen and globus pallidus were calculated for each subject.
2.4.3. DTI analysis: normal-appearing WM
We used FSL 4.1.9 to post-process diffusion-weighted volumes. Diffusion-weighted images were registered to the image without diffu-sion weighting (b0) using affine transformations to minimize distortion due to motion and eddy currents and then brain-extracted using the Brain Extraction Tool (BET) (Smith, 2002). Fractional anisotropy (FA) images were generated using FMRIB3s diffusion toolbox (FDT). We non-linearly aligned all FA images with the FMRIB58 template as the common registration target. The corpus callosum, bilateral optic radia-tions, and corticospinal tracts were masked in the common template using the Jülich probabilistic histological atlas in FSL (Toga et al., 2006), and these binary masks were inverse-warped to each subject3s native space (Fig. 1). Next, we subtracted the visible WM lesion masks acquired from the lesion segmentation step above, from the ROI defined by the atlas. Accordingly, only normal-appearing WM voxels remained in the pathway of each defined tract. Finally, the FA average of each mask was extracted for all subjects.
2.4.4. Resting-state fMRI analysis
We employed a group independent component analysis and a dual regression approach to study functional network connectivity in MS and NMO patients and in healthy subjects using FSL (Beckmann et al., 2005; Filippini et al., 2009). The pre-statistics processing of fMRI images consisted of removing thefirst 5 volumes from each time-series, brain extraction, motion correction, slice timing correction for interleaved ac-quisition, high-passfiltering with a frequency cut-off of 100 s, spatial smoothing using a Gaussian kernel of full-width at half-maximum (5 mm), and transformation to an MNI-152 standard template. To iden-tify resting-state networks, we performed independent component analysis on scans acquired from healthy controls with automatic dimen-sionality estimation, which revealed 53 spatio-temporal components (Beckmann et al., 2009). Of these, we selected 3 components (the de-fault mode, sensorimotor and visual networks, see below for maxima coordinates) based on cross-correlation with a previous meta-analytical template of resting-state networks (available online at
http://www.fmrib.ox.ac.uk/analysis/brainmap+rsns/) and visual neu-roanatomical correspondence (Smith et al., 2009) (Fig. 1A, B and C).
Next, we used a dual regression approach for all subjects (both pa-tients and controls) to identify spatial maps and corresponding timecourses for each component. At thefirst stage, group-level spatial maps were used as a set of spatial regressors to determine the temporal dynamics of the components at the subject level. Next, these timecourses were variance-normalized to allow comparison of the shape and amplitude of resting-state networks. At the second stage, the timecourses were used as temporal regressors to determine spatial maps at the subject level. Finally, a region-of-interest analysis was per-formed on the resulting maps to extract the functional connectivity from each subject. For this step, we used reference network coordinates from the reference maps. The peak of the independent component anal-ysis calculated on healthy subjects for the default mode (X =−0.2, Y =−55.4, Z = 14.5, in mm, MNI space), sensorimotor (right: X = 33.4, Y =−16.3, Z = 53.7; left: X = −29.6, Y = −17.8, Z = 57) and vi-sual networks (X = 0.9, Y =−93.8, Z = –4) was used to define the cen-ter of a 10-mm spherical mask in MNI152 space. The mean functional connectivity values (z-scores) with respective resting-state networks were calculated for each subject.
2.4.5. Upper cord cross-sectional area calculation
We used a semi-automatic method in the Jim software to calculate the average cord cross-sectional area from the foramen-magnum to C2 on 3D-MPRAGE scans as described elsewhere (Horsfield et al., 2010).
2.5. Statistical analysis 2.5.1. Descriptive statistics
The mean age, disease duration, and years of education along with the median and range of the EDSS score were calculated. We also calcu-lated the correlation coefficient among each pair of measures. 2.5.2. Predictive modeling: training and cross-validation
We used the Caret package inside R version 3.1.1 (Kuhn and Johnson, 2013) and the Shogun toolbox version 3.2.0 inside C++. We included all 18 variables (Table 1) in a support vector machine (SVM). The SVM is a standard model to investigate variables with binary (e.g., MS and NMO) or multi-class outcomes (e.g., MS, HCs and NMO) (Guyon et al., 2002;Klöppel et al., 2012). The SVM is a kernel-based method, has been extensively validated as a diagnostic model for neuro-imaging (Klöppel et al., 2008;Stonnington et al., 2010), and can handle heterogenous data from multiple sources with a combination of kernels (Sonnenburg et al., 2006). Similar toZhang et al. (2011)we use one ker-nel for each modality, combine them, learn each kerker-nel3s weight during training, andfinally classify patients in the test set. Modality is referred to each source of information, that is one for clinical scores, one for cog-nitive scores, and 5 for imaging (Fig. 2).
We distinguished between groups with two approaches: 1) binary classification with 3 different models: NMO vs MS, healthy control (HC) vs MS, and HC vs NMO, and 2) multi-class classification (one-vs-rest method): we distinguished between MS and both patients with NMO or HCs using multiple one-vs-rest models (Rifkin and Klautau, 2004). When comparing patients to HCs, we excluded measures that were unavailable for healthy volunteers (EDSS and low-contrast test score). Ten-fold cross validation was used to partition data into 10 chunks, each of which were used once for testing and the remaining 9 were used to train the classifiers and to calculate the kernel weights. We report the average accuracy of the classifier over 10 folds. For sim-plicity and ease of interpretation, we used linear kernels in all SVMs in this study, except for multi-class classification where we used polyno-mial and Gaussian kernels.
3. Results
3.1. Clinical and demographic characteristics
The mean age of patients with NMO was 33.58 years, with a mean disease duration of 6.07 years and a median EDSS score of 3 (detailed demographic measures are shown inTable 2). The disease-modifying drugs used by patients with NMO consisted of the following: azathio-prine in 18 patients, mycophenolate mofetil in 5 patients, mitoxantrone in 1 patient, cyclophosphamide in 1 patient, methotrexate in 1 patient and oral prednisolone in 1 patient; the remaining patients did not re-ceive any medications. Patients with MS rere-ceived the following disease-modifying drugs: 17 patients receivedβ-interferon, 2 received azathioprine and 1 received mitoxantrone; the remaining patients did not receive medication.
3.2. Descriptive statistics
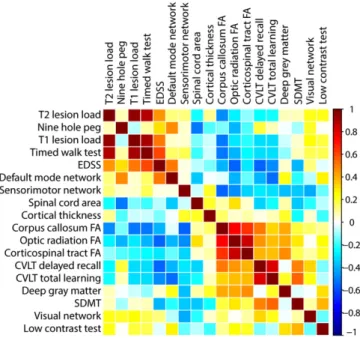
Fig. 3shows the median and 75th percentile of the imaging (A) and clinical (B) predictors in boxplots.Fig. 4shows the correlation maps among all variables.
3.3. Importance of each modality and prediction of diagnosis 3.3.1. MS and NMO
Mean accuracy of this model was 88 % with a standard deviation (SD) of 11. The important modalities (Fig. 2andTable 3) according to their kernel weights were: 1) visible WM lesion load, 2) DTI, 3) fMRI, 4) cognitive scores, 5) gray matter measures, 6) spinal cord area, and 7) clinical scores. Among patients with seronegative NMO, 83% and
patients with seropositive NMO, 88% were correctly classified over all test sets (pN 0.05 for equality of proportions). When only using the most important modality (visible WM lesion load) the average accuracy was 74%.
3.3.2. MS and HC
The mean accuracy was 91% with an SD of 8. Important modalities were: 1) visible WM lesion load, 2) DTI, 3) clinical scores, 4) fMRI, 5) cognitive scores, 6) gray matter measures, and 7) spinal cord area. When only using the most important modality, the average accuracy was 76%.
3.3.3. NMO and HC
The mean accuracy was 78% with an SD of 12. Important modalities were: 1) clinical scores, 2) cognitive scores, 3) fMRI, 4) DTI, 5) gray mat-ter measures, 6) spinal cord area, and 7) visible WM lesion load. When using only the most important modality (clinical scores) the average ac-curacy was 71%.
3.3.4. Multi-class classification: classification of MS, NMO and HCs in a sin-gle model
The mean accuracy (±SD) was 84% with an SD of 8. Important mo-dalities for multi-label classification were: 1) visible WM lesions 2) fMRI 3) cognitive scores 4) DTI. Other modalities received 0 weights in the combined kernel. When using the most important modality (visible WM lesion load) the average accuracy was 74%.
4. Discussion
The main purpose of this study was to integrate clinical, imaging and cognitive measures to automatically distinguish patients with MS from those with NMO.
We combined kernels to unify heterogenous data from multiple sources, and to distinguish MS from NMO. We further extended our model to multi-class algorithms, where we classified MS, NMO and HCs in a single model with a high accuracy (84%). When looking at each pair of groups, the accuracy of the model was 88% to distinguish MS and NMO patients, 91% between HCs and patients with MS, and 78% between HCs and patients with NMO. The most important modalities, according to their kernel weights, revealed that when distinguishing the NMO and MS groups differential changes were most-ly found in WM measures (visible WM lesion load and normal appearing white matter integrity), followed by the resting-state fMRI connectivity and cognitive functioning. To the best of our knowledge this is thefirst study to classify two similar demyelinating disorders with multi-modal data fusion.
There is an increasing interest in the neuroimaging community to use computational and diagnostic models. They have been previously used to evaluate Alzheimer3s disease, traumatic brain injury, and stroke, showing performance that is comparable to that of human experts (Klöppel et al., 2008;Lui et al., 2014;Thompson et al., 2014;Zhang et al., 2011). Our study gives preliminary evidence for the utility of com-putational tools in differentiating MS and NMO, the results of which could have important implications for developing future clinical decision-making algorithms.
Multivariate data-fusion methods can identify complex patterns of neuroanatomical changes (Sui et al., 2014). When distinguishing be-tween the NMO and MS groups, the visible WM lesion load (T1 and T2 lesion load) and normal-appearing WM integrity (DTI) were the most important features, showing a consistent damage in the MS group among different measures. The next important modality was resting-state functional connectivity, which consisted of connectivities of default-mode, sensorimotor and visual networks. When looking at indi-vidual measures inFig. 3A, the sensorimotor and default-mode net-works show more variability between groups than the visual network. The visual network is responsible for a“basic” function that is not ex-pected to differ between groups, which increases our confidence that
Fig. 2. Diagram of multimodal data fusion, learning kernel weights and cross-validation.
Table 2 Demographic characteristics. Measures Groups HCa NMOb MSc Mean age ± SD 31.94 ± 9.07 33.58 ± 10.1 32.85 ± 8.49 Mean disease duration ± SD – 6.07 ± 3.29 8.04 ± 7.04 Gender ratio (female:male) 31:4 26:4 22:3 Mean years of education ± SD 13.4 ± 2.92 12.41 ± 3.58 12.96 ± 3.56
a Healthy control. b Neuromyelitis optica. c Multiple sclerosis.
Fig. 3. Boxplots show the median and 75th percentile for each variable extracted from (A) imaging or (B) clinical and cognitive assessments. Functional connectivity values are normalized (mean = 0, and SD = 1.5). 2 A. Es h a gh i et a l. / N eu ro Im ag e: C lin ic al 7 (2 0 15 ) 3 0 6– 31 4
the differences between other networks are meaningful, as was shown in a previous study (Roosendaal et al., 2010). We observed a consistent damage in WM and GM in patients with MS in comparison with the NMO patients and HCs. In patients with NMO, this coincided with an in-creased sensorimotor network connectivity and may indicate that more subtle motor system damage in the brains of patients with NMO is asso-ciated with an increased connectivity in the sensorimotor network, pos-sibly due to compensatory effects (Fig. 3A) (Pantano et al., 2002). Interestingly, when comparing DMN connectivity in each group of pa-tients with that of healthy controls, a subtle decrease in DMN connectiv-ity in NMO but not MS patients was associated with sustained cognitive functioning (Fig. 3A and Fig. 4). Thisfinding is consistent with previous studies, indicating the role of DMN suppression in supporting externally oriented cognitive functioning (Anticevic et al., 2012). Thesefindings show that multivariate pattern classification using an SVM can integrate complex brain changes to support clinical diagnoses.
Multi-class classification better reflects a dilemma in routine clinical practice, when more than one differential diagnosis are considered (Klöppel et al., 2012). Our model reached excellent accuracy (84%) to distinguish between all three groups. Visible WM lesions, fMRI, cogni-tive scores and DTI received high weights while other modalities re-ceived 0 weights. A classification based on only visible white matter lesions showed an accuracy of 74%, which highlights the importance of more advanced modalities in difficult classification problems. Future
studies should include other common differential diagnoses of MS, such as CNS vasculitis in a multi-class classification problem.
It is also important to acknowledge several limitations of our study. First, this is a single-center classification study that can only provide preliminary results and does not ensure between-cohort generalization. Future studies will incorporate our data with data from other centers to evaluate the robustness of the model. Second, we found similar perfor-mance in distinguishing seronegative and seropositive NMO patients (83% vs 88%) from patients with MS, however, an ideal situation would be to recruit enough patients to train a model on seropositive pa-tients with NMO and then test new papa-tients with seronegative NMO, the results of which could support the clinical diagnosis when the serum assay remains negative. The third limitation is that our gold stan-dard for classification remains a diagnosis made by an expert neurolo-gist based on the acknowledged criteria, and we could not exclude the possibility of mislabeling due to imperfect diagnostic criteria for MS and NMO. Without solving this issue, perfect classification is impossible. This limitation might be overcome by longer follow-up of patients and employing frequent diagnostic procedures (e.g., multiple serum sam-ples for anti-aquaporin-4 over time).
In conclusion, our workflow produces accurate models for differen-tiating patients with NMO from those with MS and from healthy volun-teers. The combination of imaging with clinical and cognitive measures provides further improvement of the accuracy and could disentangle complex changes across several modalities. This work provides proof-of-concept evidence for the premise of computational models that aid in the objective differential diagnosis of MS and NMO. In future, multi-modal data-fusion could be used to predict disability outcomes in MS using a similar method to this work.
Conflicts of interest
The authors have no conflicts to disclose. Acknowledgments
The authors are grateful to all of the patients and healthy controls who volunteered to take part in this study. This study was supported by grants from Tehran University of Medical Sciences and Cinnagen. Dr Eshaghi has received Du Pre Grant and McDonald Fellowship from Multiple Sclerosis International Federation (MSIF,http://www.msif. org).
References
Anticevic, A., Cole, M.W., Murray, J.D., Corlett, P.R., Wang, X.J., Krystal, J.H., 2012. The role of default network deactivation in cognition and disease. Trends Cogn. Sci. 16 (12), 584–592.http://dx.doi.org/10.1016/j.tics.2012.10.00823142417.
Balcer, L.J., Frohman, E.M., 2010.Evaluating loss of visual function in multiple sclerosis as measured by low-contrast letter acuity. Neurology 74 (Suppl. 3), S16–S23.
Beckmann, C.F., DeLuca, M., Devlin, J.T., Smith, S.M., 2005. Investigations into resting-state connectivity using independent component analysis. Philos. Trans. R. Soc. Lond. B Biol. Sci. 360 (1457), 1001–1013.http://dx.doi.org/10.1098/rstb.2005.163416087444. Fig. 4. Between predictor correlations for imaging, cognitive and clinical parameters in
pa-tients. Each row and column represent a predictor (Table 1), and each rectangle represents the correlation coefficient between the corresponding variables on the x and y axes.
Table 3
Importance ranking of significant modalities.
Binary classification Multi-class classification Modality rank MS vs NMO
(relative kernel weight)a
MS vs HC
(relative kernel weight)
NMO vs HC
(relative kernel weight)
MS vs NMO vs HC (relative kernel weight) 1 Visible WM lesion load (0.20) Visible WM lesion load (0.49) Clinical scores (0.41) Visible WM lesion load (0.38) 2 DTI (0.18) DTI (0.16) Cognitive scores (0.18) fMRI (0.31)
3 fMRI (0.17) Clinical scores (0.13) fMRI (0.16) Cognitive scores (0.16) 4 Cognitive scores (0.16) fMRI (0.10) DTI (0.13) DTI (0.14)
5 Gray matter measures (0.15) Cognitive scores (0.08) Gray matter measures (0.10) – 6 Spinal cord area (0.06) Gray matter measures (0.05) Spinal cord area (0.002) – 7 Clinical scores (0.08) Spinal cord area (0.004) Visible WM lesion load (b0.0001) –
a
Multi-kernel learning combines different kernels and gives each of them a weight. Linear combination of each kernel and their weights will be used for the combined kernel. Here, relative weight is defined as the normalized weight that is given to each kernel, and is averaged for each modality over all 10 folds.
Beckmann, C.F., Mackay, C.E., Filippini, N., Smith, S.M., 2009.Group comparison of resting-state FMRI data using multi-subject ICA and dual regression. Organization of Human Brain Mapping Congress.
Bendfeldt, K., Klöppel, S., Nichols, T.E., Smieskova, R., Kuster, P., Traud, S., Mueller-Lenke, N., Naegelin, Y., Kappos, L., Radue, E.W., Borgwardt, S.J., 2012. Multivariate pattern classification of gray matter pathology in multiple sclerosis. Neuroimage 60 (1), 400–408.http://dx.doi.org/10.1016/j.neuroimage.2011.12.07022245259.
Calabrese, M., Oh, M.S., Favaretto, A., Rinaldi, F., Poretto, V., Alessio, S., Lee, B.C., Yu, K.H., Ma, H.I., Perini, P., Gallo, P., 2012. No MRI evidence of cortical lesions in neuromyelitis optica. Neurology 79 (16), 1671–1676.http://dx.doi.org/10.1212/ WNL.0b013e31826e9a9622993282.
Cohen, J.A., Cutter, G.R., Fischer, J.S., Goodman, A.D., Heidenreich, F.R., Jak, A.J., Kniker, J.E., Kooijmans, M.F., Lull, J.M., Sandrock, A.W., Simon, J.H., Simonian, N.A., Whitaker, J.N., 2001. Use of the multiple sclerosis functional composite as an outcome measure in a phase 3 clinical trial. Arch. Neurol. 58 (6), 961–967.http://dx.doi.org/10.1001/ archneur.58.6.96111405811.
Dale, A.M., Fischl, B., Sereno, M.I., 1999. Cortical surface-based analysis. I. Segmentation and surface reconstruction. Neuroimage 9 (2), 179–194.http://dx.doi.org/10.1006/ nimg.1998.03959931268.
Desikan, R.S., Ségonne, F., Fischl, B., Quinn, B.T., Dickerson, B.C., Blacker, D., Buckner, R.L., Dale, A.M., Maguire, R.P., Hyman, B.T., Albert, M.S., Killiany, R.J., 2006. An automated labeling system for subdividing the human cerebral cortex on MRI scans into gyral based regions of interest. Neuroimage 31 (3), 968–980.http://dx.doi.org/10.1016/j. neuroimage.2006.01.02116530430.
Eshaghi, A., Riyahi-Alam, S., Roostaei, T., Haeri, G., Aghsaei, A., Aidi, M.R., Pouretemad, H.R., Zarei, M., Farhang, S., Saeedi, R., Nazeri, A., Ganjgahi, H., Etesam, F., Azimi, A.R., Benedict, R.H., Sahraian, M.A., 2012. Validity and reliability of a Persian translation of the minimal assessment of cognitive function in multiple sclerosis (MACFIMS). Clin. Neuropsychol. 26 (6), 975–984.http://dx.doi.org/10.1080/13854046.2012. 69491222681459.
Filippi, M., Rocca, M.A., Moiola, L., Martinelli, V., Ghezzi, A., Capra, R., Salvi, F., Comi, G., 1999. MRI and magnetization transfer imaging changes in the brain and cervical cord of patients with Devic3s neuromyelitis optica. Neurol. 53 (8), 1705–1710.
http://dx.doi.org/10.1212/WNL.53.8.170510563616.
Geurts, J.J., Calabrese, M., Fisher, E., Rudick, R.A., 2012. Measurement and clinical effect of grey matter pathology in multiple sclerosis. Lancet Neurol. 11 (12), 1082–1092.
http://dx.doi.org/10.1016/S1474-4422(12)70230-223153407.
Giorgio, A., Stromillo, M.L., Bartolozzi, M.L., Rossi, F., Battaglini, M., De Leucio, A., Guidi, L., Maritato, P., Portaccio, E., Sormani, M.P., Amato, M.P., De Stefano, N., 2014. Relevance of hypointense brain MRI lesions for long-term worsening of clinical disability in re-lapsing multiple sclerosis. Mult. Scler. 20 (2), 214–219.http://dx.doi.org/10.1177/ 135245851349449023877971.
Guyon, I., Weston, J., Barnhill, S., Vapnik, V., 2002. Gene selection for cancer classification using support vector machines. Mach. Learn. 46 (1/3), 389–422.http://dx.doi.org/10. 1023/A:1012487302797.
Hackmack, K., Paul, F., Weygandt, M., Allefeld, C., Haynes, J.D., Alzheimer3s Disease Neuroimaging Initiative, 2012. Multi-scale classification of disease using structural MRI and wavelet transform. Neuroimage 62 (1), 48–58.http://dx.doi.org/10.1016/j. neuroimage.2012.05.02222609452.
Horsfield, M.A., Sala, S., Neema, M., Absinta, M., Bakshi, A., Sormani, M.P., Rocca, M.A., Bakshi, R., Filippi, M., 2010. Rapid semi-automatic segmentation of the spinal cord from magnetic resonance images: application in multiple sclerosis. Neuroimage 50 (2), 446–455.http://dx.doi.org/10.1016/j.neuroimage.2009.12.12120060481. Jarius, S., Wildemann, B., 2010. AQP4 antibodies in neuromyelitis optica: diagnostic and
pathogenetic relevance. Nat. Rev. Neurol. 6 (7), 383–392.http://dx.doi.org/10.1038/ nrneurol.2010.7220639914.
Kim, W., Kim, S.H., Huh, S.Y., Kim, H.J., 2012. Brain abnormalities in neuromyelitis optica spectrum disorder. Mult. Scler. Int. 2012, 735486.http://dx.doi.org/10.1155/2012/ 73548623259063.
Klöppel, S., Abdulkadir, A., Jack Jr., C.R., Koutsouleris, N., Mourão-Miranda, J., Vemuri, P., 2012. Diagnostic neuroimaging across diseases. Neuroimage 61 (2), 457–463.
http://dx.doi.org/10.1016/j.neuroimage.2011.11.00222094642.
Klöppel, S., Stonnington, C.M., Chu, C., Draganski, B., Scahill, R.I., Rohrer, J.D., Fox, N.C., Jack Jr., C.R., Ashburner, J., Frackowiak, R.S., 2008. Automatic classification of MR scans in Alzheimer3s disease. Brain 131 (3), 681–689. http://dx.doi.org/10.1093/brain/ awm31918202106.
Kuhn, M., Johnson, K., 2013.Applied Predictive Modeling. Springer.
Lennon, V.A., Wingerchuk, D.M., Kryzer, T.J., Pittock, S.J., Lucchinetti, C.F., Fujihara, K., Nakashima, I., Weinshenker, B.G., 2004. A serum autoantibody marker of neuromyeli-tis optica: distinction from multiple sclerosis. Lancet 364 (9451), 2106–2112.http:// dx.doi.org/10.1016/S0140-6736(04)17551-X15589308.
Liu, Y., Liang, P., Duan, Y., Jia, X., Wang, F., Yu, C., Qin, W., Dong, H., Ye, J., Li, K., 2011. Ab-normal baseline brain activity in patients with neuromyelitis optica: a resting-state fMRI study. Eur. J. Radiol. 80 (2), 407–411.http://dx.doi.org/10.1016/j.ejrad.2010. 05.00220605694.
Lui, Y.W., Xue, Y., Kenul, D., Ge, Y., Grossman, R.I., Wang, Y., 2014. Classification algorithms using multiple MRI features in mild traumatic brain injury. Neurology 83 (14), 1235–1240.http://dx.doi.org/10.1212/WNL.000000000000083425171930. Pantano, P., Mainero, C., Iannetti, G.D., Caramia, F., Di Legge, S., Piattella, M.C., Pozzilli, C.,
Bozzao, L., Lenzi, G.L., 2002. Contribution of corticospinal tract damage to cortical motor reorganization after a single clinical attack of multiple sclerosis. Neuroimage 17 (4), 1837–1843.http://dx.doi.org/10.1006/nimg.2002.131312498757.
Pichiecchio, A., Tavazzi, E., Poloni, G., Ponzio, M., Palesi, F., Pasin, M., Piccolo, L., Tosello, D., Romani, A., Bergamaschi, R., Piccolo, G., Bastianello, S., 2012. Advanced magnetic res-onance imaging of neuromyelitis optica: a multiparametric approach. Mult. Scler. 18 (6), 817–824.http://dx.doi.org/10.1177/135245851143107222183930.
Polman, C.H., Reingold, S.C., Edan, G., Filippi, M., Hartung, H.P., Kappos, L., Lublin, F.D., Metz, L.M., McFarland, H.F., O3Connor, P.W., Sandberg-Wollheim, M., Thompson, A.J., Weinshenker, B.G., Wolinsky, J.S., 2005. Diagnostic criteria for multiple sclerosis: 2005 revisions to the“McDonald criteria”. Ann. Neurol. 58 (6), 840–846.http://dx. doi.org/10.1002/ana.2070316283615.
Popescu, B.F., Parisi, J.E., Cabrera-Gómez, J.A., Newell, K., Mandler, R.N., Pittock, S.J., Lennon, V.A., Weinshenker, B.G., Lucchinetti, C.F., 2010. Absence of cortical demyelin-ation in neuromyelitis optica. Neurology 75 (23), 2103–2109.http://dx.doi.org/10. 1212/WNL.0b013e318200d80c21135384.
Popescu, V., Ran, N.C., Barkhof, F., Chard, D.T., Wheeler-Kingshott, C.A., Vrenken, H., 2014. Accurate GM atrophy quantification in MS using lesion-filling with co-registered 2D lesion masks. Neuroimage Clin. 4, 366–373.http://dx.doi.org/10.1016/j.nicl.2014.01. 00424567908.
Rifkin, R., Klautau, A., 2004.In defense of one-vs-all classification. J. Mach. Learn. Res. 5, 101–141.
Rocca, M.A., Agosta, F., Mezzapesa, D.M., Martinelli, V., Salvi, F., Ghezzi, A., Bergamaschi, R., Comi, G., Filippi, M., 2004. Magnetization transfer and diffusion tensor MRI show gray matter damage in neuromyelitis optica. Neurology 62 (3), 476–478.http://dx.doi. org/10.1212/01.WNL.0000106946.08741.4114872036.
Roosendaal, S.D., Schoonheim, M.M., Hulst, H.E., Sanz-Arigita, E.J., Smith, S.M., Geurts, J.J., Barkhof, F., 2010. Resting state networks change in clinically isolated syndrome. Brain 133 (6), 1612–1621.http://dx.doi.org/10.1093/brain/awq05820356855.
Saji, E., Arakawa, M., Yanagawa, K., Toyoshima, Y., Yokoseki, A., Okamoto, K., Otsuki, M., Akazawa, K., Kakita, A., Takahashi, H., Nishizawa, M., Kawachi, I., 2013. Cognitive im-pairment and cortical degeneration in neuromyelitis optica. Ann. Neurol. 73 (1), 65–76.http://dx.doi.org/10.1002/ana.2372123378324.
Sato, D.K., Callegaro, D., Lana-Peixoto, M.A., Waters, P.J., de Haidar Jorge, F.M., Takahashi, T., Nakashima, I., Apostolos-Pereira, S.L., Talim, N., Simm, R.F., Lino, A.M., Misu, T., Leite, M.I., Aoki, M., Fujihara, K., 2014. Distinction between MOG antibody-positive and AQP4 antibody-positive NMO spectrum disorders. Neurology 82 (6), 474–481.
http://dx.doi.org/10.1212/WNL.000000000000010124415568.
Schmidt, P., Gaser, C., Arsic, M., Buck, D., Förschler, A., Berthele, A., Hoshi, M., Ilg, R., Schmid, V.J., Zimmer, C., Hemmer, B., Mühlau, M., 2012. An automated tool for detec-tion of FLAIR-hyperintense white-matter lesions in multiple sclerosis. Neuroimage 59 (4), 3774–3783.http://dx.doi.org/10.1016/j.neuroimage.2011.11.03222119648. Sinnecker, T., Dörr, J., Pfueller, C.F., Harms, L., Ruprecht, K., Jarius, S., Brück, W., Niendorf, T.,
Wuerfel, J., Paul, F., 2012. Distinct lesion morphology at 7-T MRI differentiates neuro-myelitis optica from multiple sclerosis. Neurology 79 (7), 708–714.http://dx.doi.org/ 10.1212/WNL.0b013e3182648bc822855861.
Smith, S.M., 2002. Fast robust automated brain extraction. Hum. Brain Mapp. 17 (3), 143–155.http://dx.doi.org/10.1002/hbm.1006212391568.
Smith, S.M., Fox, P.T., Miller, K.L., Glahn, D.C., Fox, P.M., Mackay, C.E., Filippini, N., Watkins, K.E., Toro, R., Laird, A.R., Beckmann, C.F., 2009. Correspondence of the brain3s func-tional architecture during activation and rest. Proc. Natl. Acad. Sci. U S A 106 (31), 13040–13045.http://dx.doi.org/10.1073/pnas.090526710619620724.
Sonnenburg, S., Rätsch, G., Schäfer, C., Schölkopf, B., 2006.Large scale multiple kernel learning. J. Mach. Learn. Res. 7, 1531–1565.
Stonnington, C.M., Chu, C., Klöppel, S., Jack Jr., C.R., Ashburner, J., Frackowiak, R.S., Alzheimer3s Disease Neuroimaging Initiative, 2010. Predicting clinical scores from magnetic resonance scans in Alzheimer3s disease. Neuroimage 51 (4), 1405–1413.
http://dx.doi.org/10.1016/j.neuroimage.2010.03.05120347044.
Sui, J., Huster, R., Yu, Q., Segall, J.M., Calhoun, V.D., 2014. Function-structure associations of the brain: evidence from multimodal connectivity and covariance studies. Neuroimage 102P1, 11–23. http://dx.doi.org/10.1016/j.neuroimage.2013.09. 04424084066.
Thompson, D.D., Murray, G.D., Sudlow, C.L., Dennis, M., Whiteley, W.N., 2014. Comparison of statistical and clinical predictions of functional outcome after ischemic stroke. PLOS One 9 (10), e110189.http://dx.doi.org/10.1371/journal.pone.011018925299053. Toga, A.W., Thompson, P.M., Mori, S., Amunts, K., Zilles, K., 2006. Towards multimodal
atlases of the human brain. Nat. Rev. Neurosci. 7 (12), 952–966.http://dx.doi.org/ 10.1038/nrn201217115077.
Von Glehn, F., Jarius, S., Cavalcanti Lira, R.P., Alves Ferreira, M.C., von Glehn, F.H., Costa E Castro, S.M., Beltramini, G.C., Bergo, F.P., Farias, A.S., Brandão, C.O., Wildemann, B., Damasceno, B.P., Cendes, F., Santos, L.M., Yasuda, C.L., 2014. Structural brain abnor-malities are related to retinal nervefiber layer thinning and disease duration in neu-romyelitis optica spectrum disorders. Mult. Scler.http://dx.doi.org/10.1177/ 135245851351983824477120.
Wegner, C., 2013. Recent insights into the pathology of multiple sclerosis and neuromy-elitis optica. Clin. Neurol. Neurosurg. 115 (Suppl. 1), S38–S41.http://dx.doi.org/10. 1016/j.clineuro.2013.09.01924321153.
Weier, K., Eshaghi, A., Magon, S., Andelova, M., Radue, E.W., Kappos, L., Azimi, A.R., Sahraian, M.A., Sprenger, T., 2014. The role of cerebellar abnormalities in neuromyeli-tis optica— a comparison with multiple sclerosis and healthy controls. Mult. Scler.
http://dx.doi.org/10.1177/135245851455405125480863.
Weygandt, M., Hackmack, K., Pfüller, C., Bellmann-Strobl, J., Paul, F., Zipp, F., Haynes, J.D., 2011. MRI pattern recognition in multiple sclerosis normal-appearing brain areas. PLOS One 6 (6), e21138.http://dx.doi.org/10.1371/journal.pone.002113821695053. Wingerchuk, D.M., Lennon, V.A., Pittock, S.J., Lucchinetti, C.F., Weinshenker, B.G., 2006.
Re-vised diagnostic criteria for neuromyelitis optica. Neurology 66 (10), 1485–1489.
http://dx.doi.org/10.1212/01.wnl.0000216139.44259.7416717206.
WMA, 2000.Declaration of Helsinki, Ethical Principles for Medical Research Involving Human Subjects 52nd WMA General Assembly, Edinburgh, Scotland.
Zhang, D., Wang, Y., Zhou, L., Yuan, H., Shen, D., Alzheimer3s Disease Neuroimaging Initiative, 2011. Multimodal classification of Alzheimer3s disease and mild cognitive impairment. Neuroimage 55 (3), 856–867.http://dx.doi.org/10.1016/j.neuroimage. 2011.01.00821236349.