HAL Id: hal-00297945
https://hal.archives-ouvertes.fr/hal-00297945
Submitted on 27 Nov 2007HAL is a multi-disciplinary open access
archive for the deposit and dissemination of sci-entific research documents, whether they are pub-lished or not. The documents may come from teaching and research institutions in France or abroad, or from public or private research centers.
L’archive ouverte pluridisciplinaire HAL, est destinée au dépôt et à la diffusion de documents scientifiques de niveau recherche, publiés ou non, émanant des établissements d’enseignement et de recherche français ou étrangers, des laboratoires publics ou privés.
Primary production during nutrient-induced blooms at
elevated CO2 concentrations
J. K. Egge, T. F. Thingstad, A. Engel, R. G. J. Bellerby, U. Riebesell
To cite this version:
J. K. Egge, T. F. Thingstad, A. Engel, R. G. J. Bellerby, U. Riebesell. Primary production dur-ing nutrient-induced blooms at elevated CO2 concentrations. Biogeosciences Discussions, European Geosciences Union, 2007, 4 (6), pp.4385-4410. �hal-00297945�
BGD
4, 4385–4410, 2007 Primary productionat at elevated CO2 concentrations J. K. Egge et al. Title Page Abstract Introduction Conclusions References Tables Figures ◭ ◮ ◭ ◮ Back CloseFull Screen / Esc
Printer-friendly Version Interactive Discussion
EGU Biogeosciences Discuss., 4, 4385–4410, 2007
www.biogeosciences-discuss.net/4/4385/2007/ © Author(s) 2007. This work is licensed
under a Creative Commons License.
Biogeosciences Discussions
Biogeosciences Discussions is the access reviewed discussion forum of Biogeosciences
Primary production during
nutrient-induced blooms at elevated CO
2
concentrations
J. K. Egge1, T. F. Thingstad1, A. Engel2, R. G. J. Bellerby3, and U. Riebesell4
1
Department of Biology, University of Bergen, 5020 Bergen, Norway
2
Alfred Wegener Institute (AWI) for Marine and Polar Research, Am Handelshafen 12, 27570 Bremerhaven, Germany
3
Bjerknes Centre for Climate Research, Univ. of Bergen, All ´egaten 55, 5007 Bergen, Norway
4
Leibniz Institut f ¨ur Meereswissenschaften, IFM-GEOMAR, Kiel, Germany
Received: 14 November 2007 – Accepted: 14 November 2007 – Published: 27 November 2007
BGD
4, 4385–4410, 2007 Primary productionat at elevated CO2 concentrations J. K. Egge et al. Title Page Abstract Introduction Conclusions References Tables Figures ◭ ◮ ◭ ◮ Back CloseFull Screen / Esc
Printer-friendly Version Interactive Discussion
EGU
Abstract
Mesocosms experiments (PeECE II and PeECE III) were carried out in 9 transparent mesocosms. Prior to the experimental period, the seawater carbonate system was manipulated to achieve three different levels of CO2. At the onset of the
experimen-tal period, nutrients were added to all mesocosms in order to initiate phytoplankton
5
blooms. Rates of primary production were measured by in-situ incubations using14 C-incorporation and oxygen production/consumption. Particulate primary production by
14
C was also size fractionated and compared with phytoplankton species composition. Nutrient supply increased the primary production rates, and a net autotrophic phase with14C-fixation rates up to 4 times higher than initial was observed midway through
10
the 24 days experiment before net community production returned to near-zero and
14
C-fixation rates relaxed back to lower than initial. We found a trend in the14C-based measurements towards higher cumulative primary production at higher pCO2,
consis-tent with recently published results for DIC removal (Riebesell et al., 2007). There where found differences to the size fractionated primary production response to CO2
15
treatments. The plankton composition changes throughout the bloom, however, re-sulted in no significant response until the final phase of the experiment where phyto-plankton growth became nutrient limited, and phytophyto-plankton community changed from diatom to flagellate dominance. This opens for the two alternative hypotheses that such an effect is associated with mineral nutrient limited growth, and/or with phytoplankton
20
species composition. The lack of a clear net heterotrophic phase in the last part of the experiment supports the idea that a substantial part of production in the upper layer was not degraded locally, but either accumulated there or was exported vertically.
1 Introduction
In the upper photic zone where primary production is limited by mineral nutrients
25
BGD
4, 4385–4410, 2007 Primary productionat at elevated CO2 concentrations J. K. Egge et al. Title Page Abstract Introduction Conclusions References Tables Figures ◭ ◮ ◭ ◮ Back CloseFull Screen / Esc
Printer-friendly Version Interactive Discussion
EGU element, grossly described by the import-export and the regenerated cycles (Dugdale
and Goering, 1967). Onto this set of nutrient cycles, the C-cycle is linked via more or less flexible stoichiometric relationship in the different trophic levels and their interac-tions. Relatively small alterations in either element cycles or stoichiometric C:nutrient coupling may have consequences for the ocean’s C-cycle, particularly if the net result
5
is a change the C:limiting element ratio of the exported material, and/or in the quality of this matter in a manner affecting the relative depths at which C and limiting elements are released from sinking to non-sinking forms (Thingstad, 1993).
Increased atmospheric CO2 leads to both an increased pCO2 and a lowered pH
(Riebesell, 2004). It is an a priori possibility that both of these environmental changes
10
may affect either the cycling of the limiting element, and/or its stoichiometric coupling to C. In either case, this would be expected to lead to changes in the rate of fixation of C into organic material and in the processes producing and consuming oxygen.
CO2is often quoted as being a non-limiting factor for primary production in seawater (Raven and Jonston, 1991; Clark and Flynn, 2000) The RUBISCO enzyme has
how-15
ever a relatively low affinity for CO2 (Raven and Jonston, 1991) and this has led to a
discussion of the possibility that increased CO2-levels may stimulate primary C-fixation (Riebesell, 2004). Should this occur without a proportional change in the cycle of lim-iting elements, the consequence is a change in the stoichiometric relationships in the microbial food web. Based on measurements of removal of inorganic-C and nitrate, the
20
PeECE-experiments have shown such an effect (Riebesell et al., 2007).
The affinity for CO2 differs among phytoplankton species (Rost et al. 2003), and
some phytoplankton species are able to change their CO2supply by CO2-concentrating mechanisms (CCM) (Raven, 1991). The efficiency and regulation of CCM differs among phytoplankton species and functional groups. Changes in CO2availability might
25
therefore affect competition and succession of phytoplankton species (Burkhardt et al., 2001; Rost et al., 2003). A shift in dominance between Phaeocystis and diatoms has been observed in a natural plankton community where CO2 has been manipulated
pro-BGD
4, 4385–4410, 2007 Primary productionat at elevated CO2 concentrations J. K. Egge et al. Title Page Abstract Introduction Conclusions References Tables Figures ◭ ◮ ◭ ◮ Back CloseFull Screen / Esc
Printer-friendly Version Interactive Discussion
EGU duction, and the effect of increased CO2 on primary production has been investigated
theoretically as well as experimentally. Some papers report small, if any, effect (Clark and Flynn, 2000; Tortell et al., 2002) whereas other papers document increased pri-mary production with increasing CO2(Heine and Sand-Jensen, 1997; Schippers et al., 2004; Riebesell et al., 2007).
5
3 mesocosm experiments, in 2001, 2003 and 2005 have been carried out in the framework of the Pelagic Ecosystem CO2Enrichment study (PeECE). The aim of these experiments has been to study the effects of elevated levels of CO2 on the planktonic
community and on sea water chemistry (Delille et al., 2005; Engel et al., 2004, 2005; Rochell-Newall et al., 2004; Grossart et al., 2006). Blooms of the coccolithoporid
Emil-10
iania huxleyi and/or diatoms were initiated by nutrient addition, and the plankton
com-munity was monitored for about 3 weeks. Primary production has been measured during all PeECE experiments. No differences in primary production were observed in the 2001 experiment where CO2concentration in the mesocosms was manipulated to 180, 370 and 700 µatm (Delille et al., 2005). The same CO2concentrations were also
15
used in the 2003 experiment, but elevated to 350, 700 and 1050 µatm CO2 in 2005
(Schulz et al., 2007)
This paper reports primary production results from PeECE III, with a comparison of the corresponding data from(PeECE II conducted in 2003.14C and O2measurements
were used for estimating production in both experiments, but different techniques were
20
used for O2-detection (Winkler titration and optodes in PeECE II and PeECE III,
re-spectively). Primary production in size-fractions: 0.2–1, 1–5, 5–10 and >10 µm, was measured only during the 2005 experiment.
BGD
4, 4385–4410, 2007 Primary productionat at elevated CO2 concentrations J. K. Egge et al. Title Page Abstract Introduction Conclusions References Tables Figures ◭ ◮ ◭ ◮ Back CloseFull Screen / Esc
Printer-friendly Version Interactive Discussion
EGU
2 Materials and methods
2.1 Set up and sampling
The PeECE III mesocosm experiment was carried out at Marine Biological Station, University of Bergen, Norway between May 16 and June 10, 2005 (see Table 1)
9 mesocosms (volume 27 m3) made of polyethylene were filled with unfiltered,
5
nutrient-poor post-bloom water from the fjord, and manipulated to achieve 3 different levels of CO2in triplicate mesocosms. The levels of CO2at the start of the experimental
period were 350 µatm (1× CO2), 700 µatm (2× CO2) and 1050 µatm (3× CO2).
Nutri-ents, as nitrate and phosphate, were added to the mesocosms in order to achieve an increase in growth and biomass of osmotropic organisms. For further details
concern-10
ing the set-up of the experiment see Schulz et al. (2007). The PeECE II experiment was carried out between 4–24 May 2003, where CO2concentration in the nine mesocosms were adjusted to 190 µatm (glacial), 370 µatm (present) and 750 µatm (future) CO2,
in triplicates. While in 2005 low concentrations of silicate were available in the fjord water used to fill the mesocosm, allowing for an initial bloom of diatoms followed by
15
coccolithophore dominance, silicate was added in excess in 2003. For further details see Grossart et al. (2006).
2.2 14C Primary production
Primary production was measured using the 14C method, according to Steemann-Nielsen (1952) and Gargas (1975). Plastic bottles (76 ml) (NUNC Easyflask) spiked
20
with approximately 4 µCi were incubated in situ between 10:00 and 14:00 h. Dark up-take was measured bottles wrapped in aluminium foil. Bottles were incubated in the sea outside the mesocosms, at the irradiance level corresponding to middle dept of the upper layer of the mesocosms (see Schulz et al., 2007). The incubation depth was determined base on light profiles inside and outside the mesocosms. A Li-Cor Li
25
BGD
4, 4385–4410, 2007 Primary productionat at elevated CO2 concentrations J. K. Egge et al. Title Page Abstract Introduction Conclusions References Tables Figures ◭ ◮ ◭ ◮ Back CloseFull Screen / Esc
Printer-friendly Version Interactive Discussion
EGU Sensor was used both for profiling and logging. In 2005, triplicate incubation was made
from all 9 mesocosm, while in 2003 only two mesocosms per treatment were analysed. In addition to short time incubation, 24 h incubations were also conducted in 2005. For these incubations 118 mL glass bottles were used, and only one mesocosm per treatment was sampled, M2, M5 amd M8. These samples were either filtrated onto
5
Sartorius membrane filters or onto Nuclepore filters of 0.2, 1, 5 and 10 µm. After filtration were all filters treated with fuming HCl in order to remove inorganic14C. Scin-tillation solution (Ecosint O) was then added, and the samples were stored overnight before counted in a Packard Tri Carb Liquid Scintillation Analyser, model 1900 A. Cal-culations were done according to Gargas (1975). Daily primary production, based on
10
4 h incubation was calculated as function of incoming irradiance during incubation pe-riod (4 h) and total irradiance for the 24 h. Calculation of primary production was done according to Gargas (1975).
2.3 Oxygen and Oxygen production
In 2003 dissolved oxygen was determined based on the Winkler method using an
au-15
tomated titration (Titrino, Metrohm) and potentiomentric endpoint detection. Samples were collected from the mesocosms at 9.00 using a Ruthner water sampler and trans-ferred without air bubbles to 100 ml BOD bottles through a silicon tube. A total of 6 bottles were filled from each mesocosm. Two bottles were immediately fixed with 1 ml of manganese chloride solution and 1 ml of potassium iodate (0.003 M) and mixed.
An-20
other two bottles were placed in photoresistant plastic foil and incubated together with the remaining two bottles in the fjord at about 1m depth for 9 h. The samples were removed in the evening (∼19.00), fixed immediately, mixed well and stored for more than 12 but less than 24 h in the dark. After dissolving the precipitated with sulfuric acid (5 M) the iodine was titrated with 0.02 N thiosulfate solution. Calculation of the
25
oxygen concentration was performed after Dickson (1994).
In 2005, BOD bottles were incubated for 24 h and oxygen was measured using the OxyMini optode system (World Precision Instruments). The instrument was two-point
BGD
4, 4385–4410, 2007 Primary productionat at elevated CO2 concentrations J. K. Egge et al. Title Page Abstract Introduction Conclusions References Tables Figures ◭ ◮ ◭ ◮ Back CloseFull Screen / Esc
Printer-friendly Version Interactive Discussion
EGU calibrated according to the manual and used with automatic temperature
compensa-tion. Oxygen concentration was determined individually in each BOD bottle both before and after incubation.
3 Results
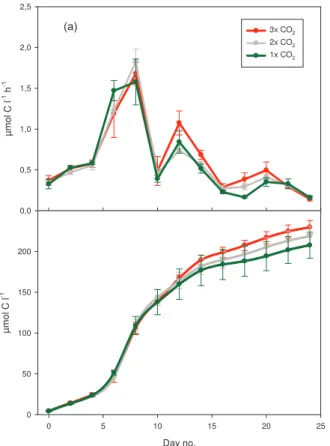
Initial particulate primary production rates, based on the14C method (4 h incubations),
5
ranged from 0.33 to 0.37 µmol C L−1h−1 in 2005 (Fig. 1). After addition of nutrients, a rapid production increase was observed in all treatments. Maximum rates were ob-served on day 8, ranging from 1.6 to 1.8 µmol C L−1h−1. Two weaker but distinct peaks
were observed on day 12 and day 20 before the production rates decreased to levels lower than initial. In the second half of the experiment there was a tendency of
increas-10
ing production with increasing CO2. Although not statistically significant, this trend is visible from ca. Day 10 in the cumulative production (Fig. 1b). In the PeECE II exper-iment in 2003, average primary production ranged from 0.28 to 0.52 µmol C L−1h−1. (Table 2) Present CO2 concentration (370 µatm) gave slightly higher production than past (190 µatm) and future (750 µatm), which also can be seen in gross production,
15
leaving no consistent increasing or decreasing trend with increasing CO2 (Table 2).
For comparison, average primary production during PeECE III was somewhat higher, ranging from 0.57 to 0.62 µmol C L−1h−1.
In 2005, the highest gross production, as measured by oxygen incubation, was ob-served on day 6 in 1× and 2× CO2, with 56 and 58 µmol O2 L−1d−1 respectively,
20
whereas the corresponding value, 58 µmol O2L−1d−1in 3× CO
2was observed a few
days later (Fig. 2). For all treatments, maximum net community production was ob-served on day 6, and after Day 10 no net production was obob-served in the system in any of the treatments. With this method, CO2did not have any clear effects, neither on timing nor or scaling of production or respiration.
25
While there was no detectable variation in primary production with CO2-level in the
com-BGD
4, 4385–4410, 2007 Primary productionat at elevated CO2 concentrations J. K. Egge et al. Title Page Abstract Introduction Conclusions References Tables Figures ◭ ◮ ◭ ◮ Back CloseFull Screen / Esc
Printer-friendly Version Interactive Discussion
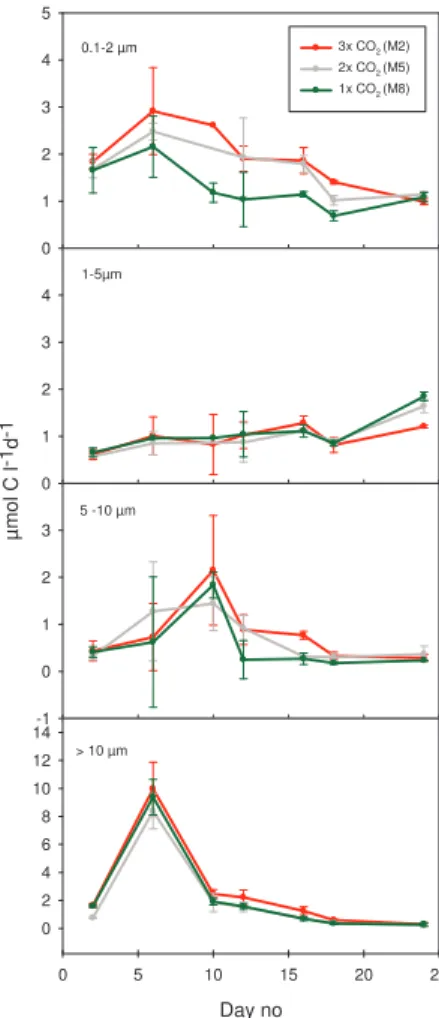
EGU position. In PeECE III (2005), we therefore decided to carry out fractionated primary
production. The fractions 0.2–1, 1–5, 5–10 and >10 µm contained on average 29, 18, 12 and 41%, respectively, of total primary production. All fractions showed an increase in production at the onset of the experiment, but during the first week production was dominated by organisms in the fraction >10 µm. On day 6, 70% of the total
produc-5
tion was found in this fraction, thereafter the contribution from the >10 µm fraction decreased rapidly (Fig. 3). A tendency of higher production, although not significant, was observed in 3×, followed by 1× and 2× (Fig. 4). Cumulative production indicated that the differences was more pronounced after day 6 (data not shown) A distinct, but much smaller peak was observed in the fraction 5–10 µm on day 10. Average
produc-10
tion in the fraction 5–10 µm was 0.9, 0.8 and 0.6 µmol C L−1d−1in 3×, 2× and 1× CO 2,
respectively (Fig. 4).
From day 6 onwards we observed a decreasing trend in production in the small-est fraction (0.2–1 µm). The production in fraction 1–5 µm increased somewhat in the same period (Fig. 3). This was particularly the case in 1× and 2× CO2, and on the
15
very last day of the experiment, production in 3× CO2 was significantly lower than in
the two other treatments (ANOVA, P <0.05). The largest differences between treat-ments were found in the smallest size fraction 0.2–1 µm, where average production for the whole experimental period was 1.3 µmol C L−1d−1in the 1× CO2treatment and
increased with increasing CO2to 1.7 and 2.1 µmol C L−1d−1in 2× and 3× CO
2
respec-20
tively (Fig. 4).
4 Discussion
4.1 Effects of CO2on total primary production
Based on in situ measurements of dissolved inorganic carbon, determined significantly higher carbon consumption at elevated CO2 (Riebesell et al., 2007; Bellerby et al.,
25
BGD
4, 4385–4410, 2007 Primary productionat at elevated CO2 concentrations J. K. Egge et al. Title Page Abstract Introduction Conclusions References Tables Figures ◭ ◮ ◭ ◮ Back CloseFull Screen / Esc
Printer-friendly Version Interactive Discussion
EGU approximately 40 µmol kg−1 higher carbon consumption at 3×CO2 relative to 1×CO2
treatments. Plotting our14C-data as cumulative production, we found (Fig. 1b) a some-what smaller but comparable (22 µmol-C L−1) difference in particulate primary
produc-tion. The14C-based results thus support the increase in C-fixation with increased CO2
-level proposed by Riebesell et al. (2007). The standard deviation (±18 µmol-C L−1) of
5
the14C-based difference in particulate primary production is, however, insufficient for the effect to be statistically significant based on these measurements alone. Higher primary production as a result of elevated CO2has also been reported by others (Hein
and Sand-Jensen, 1997; Schippers et al., 2004). On the other hand, Clark and Flynn (2000) found neither the rate nor the extent of primary productivity to be significantly
10
limited by DIC concentration.
Riebesell et al. (2007) also reported a difference in in-situ O2 concentrations
sup-porting the hypothesis of a net stimulatory effect of elevated CO2levels on C-fixation.
We could not detect a similar trend in our O2 light/dark-bottle measurements. Our
results also indicate a higher O2 production, in all treatments, relative to drawdown
15
of DIC (Riebesell et al., 2007). The reason for this apparent discrepancy between in situ measurements and incubated samples is unknown, but one may suspect dis-turbances of auto- and/or heterotrophic processes during the 24 h confinement in the 125 ml bottles used in O2 incubation. We also have an unexplained low ratio (ca 1:4) of particulate14C-fixation to gross oxygen production in our 24 h incubations. Using
20
a 15 h (sun rise to sun set) incubation, Gazeau et al. (2007) found a near 1:1 (mol C: mol O2) ratio between14C incubations and gross production. Theoretically, significant production of14C-DOC (not measured in this study) could help to balance the carbon fixation:O2-production stoichiometry in our measurements.
Production in the 0.2–1 µm size-fraction was relatively high (29% of total production),
25
and there is a tendency of increasing production in this size-fraction with increasing CO2. There was an increase in Synechococcus abundance in the last part of the
ex-periment (Paulino et al., 2007). Synechococcus cells are in the size-range from 0.8 to 1.5 µm (Johnson and Sieburt, 1979), and parts of the population may therefore have
BGD
4, 4385–4410, 2007 Primary productionat at elevated CO2 concentrations J. K. Egge et al. Title Page Abstract Introduction Conclusions References Tables Figures ◭ ◮ ◭ ◮ Back CloseFull Screen / Esc
Printer-friendly Version Interactive Discussion
EGU passed through 1 µm filters. The even smaller Prochlorophytes (<1 µm), known to
contribute to primary production at lower latitudes (Li, 1994; John et al., 2007), are not common in Norwegian coastal waters and were not observed during the experi-ment. 14C found in the 0.2–1 µm size-fraction may also be due to bacterial uptake of labelled carbon released from phytoplankton, an option suggested by Li et al. (1993).
5
The deviating trends observed for bacterial production (Allgaier et al., 20071) and14C uptake in this fraction do not lend immediate support for this. Nevertheless, bacterial activity could still explain the comparatively high rate of14C incorporation in the 0.2– 1 µm size-fraction, if uptake of14C-labeled DOC was accomplished by only a fraction of the bacterial community. Thus, neither the contribution of phytoplankton nor of
het-10
erotrophic bacteria to the radiolabel found in the 0.2–1 µm size-fraction can be ruled out based on these results. We note, however, that the highest primary production in this fraction was measured on Day 6, coinciding with the minimum in abundance of small organisms potentially passing a 1 µm filter (Paulino et al., 2007). An alternative possi-bility would be that14C-labelled organic material released from phytoplankton passed
15
the 1 µm filter but was (partly) retained on the 0.2 µm filters. An increasing production of TEP with increasing CO2 concentration has previously been shown (Engel, 2002; Engel et al., 2004; Rochelle-Newall et al., 2004). The CO2 effect may thus be linked
to the mechanism of carbon overproduction under nutrient limited conditions (Engel, 2002) in accordance with the impression one gets from Fig. 1b where all treatments
20
behave similarly until nutrients are depleted.
Our14C-based measurements did not include DO14C, allowing for the possibility of a conversion of the over-consumption of DIC into DOC by e.g. excretion or leakage from phytoplankton cells. Statistically significant CO2 treatment effects on the
concentra-tion of DOC, however, were not detected in any of the PeECE experiments
(Rochelle-25
Newall et al., 2004; Grossart et al., 2006; Schulz et al., 2007), and the Nuclepore filters
1
Allgaier, M., Riebesell, U., and Grossart, H. P.: Microbial response to enrichment in pCO2 and subsequent changes in phytoplankton and nutrient dynamics, Biogeoscienes Discuss., in preparation, 2007.
BGD
4, 4385–4410, 2007 Primary productionat at elevated CO2 concentrations J. K. Egge et al. Title Page Abstract Introduction Conclusions References Tables Figures ◭ ◮ ◭ ◮ Back CloseFull Screen / Esc
Printer-friendly Version Interactive Discussion
EGU used in this experiment are supposed to have low absorption of14C-DOC (Karl et al.,
1998).
Daily measured concentration of DOC, however, does not reveal the pattern of pro-duction and consumption (turnover) of DOC. A higher bacterial propro-duction, indicating a higher DOC consumption, was observed in the treatment with highest CO2 level in
5
PeECE II, but this was not the case in PeECE III (Grossart et al., 2006; Allgaier et al., 20071).
If the effect of increased pCO2 is an increase in the production of organic-C under
conditions of mineral nutrient limited phytoplankton growth, this will only have a feed-back effect on atmospheric CO2if the extra material is not respired by bacteria in the
10
photic zone. It has been suggested that the ability of bacteria to consume labile DOC is highly dependent on the state of growth rate limitation in the bacteria (Thingstad et al., 1997) with C-limited bacteria in principle consuming all accessible organic mate-rial, while mineral nutrient limitation of bacterial growth may lead to accumulation of the otherwise degradable organic material. A net effect on C-sequestration may therefore
15
depend not only on the physiological responses in phytoplankton, but also vary with ecological status and limiting factor for bacterial growth in the photic zone (Tanaka et al., 2007). The lack of any net heterotrophic phase in PeECE III shows that organic ma-terial produced during net autotrophy was not degraded by bacteria in the upper layer, but either accumulated or was exported vertically. This supports the interpretation of
20
Riebesell et al. (2007) of a high export of organic material through the pycnocline in this experiment. This accumulation/export, combined with the observation of a CO2
effect on bacterial production in PeECE II (Grossart et al., 2006), but not in PeECE III (Allgaier et al., 20071), highlights the need to better understand the ecological mecha-nisms regulating bacterial growth rate limitation in order to understand the net effects
25
BGD
4, 4385–4410, 2007 Primary productionat at elevated CO2 concentrations J. K. Egge et al. Title Page Abstract Introduction Conclusions References Tables Figures ◭ ◮ ◭ ◮ Back CloseFull Screen / Esc
Printer-friendly Version Interactive Discussion
EGU 4.2 Primary production related to osmotroph succession
All PeECE mesocosm studies were carried out in May–June, but nutrient additions, phytoplankton community composition, and other conditions were different (Table 2). By manipulating nutrient concentrations and stoichiometry, blooms of different phyto-plankton groups, e.g. Emiliania huxleyi and/or diatoms were introduced. In 2001,
ni-5
trate and phosphate were added in a ratio of 34:1 (atomic) in order to induce blooms of the coccolitophorid Emiliania huxleyi, which towards the end of the experiment reached cell numbers ranging from 20 to 40×103 cells ml−1 (Rochelle-Newall et al., 2004). In 2003, nitrate and phosphate were initially supplied in a lower N:P ratio (18:1) with sil-icate in excess (N:Si=1:1.33) in order to initiate diatom blooms. Diatoms, but also E.
10
huxleyi became dominant during this experiment and different species compositions
were observed within different CO2treatment (Grossart et al., 2006).
As for the first PeECE experiment, the aim in PeECE III was to introduce E.
hux-leyi blooms. Only nitrate and phosphate in a 25:1 ratio were therefore added to the
mesocosms. The initial water did, however, contain about 3 µmol L−1silicate, favouring
15
diatom growth (Schulz et al., 2007). Due to these start conditions the phytoplankton community became dominated by diatoms followed by a weak bloom of E. huxleyi and other nano- and pico-sized phytoplankton (Paulino et al., 2007). The nutrient environ-ment during the experienviron-ment can be divided into 5 phases (Tanaka et al., 2007). During the first 6 days all nutrients were detectable and silicate was the first nutrient that was
20
depleted (Phase I). Phosphate was depleted on day 11 (Phase II) and nitrate on day 15 (Phase III). Between day 16 and 20 all nutrients were depleted (Phase IV) before increased turnover times for phosphorus indicated regeneration of nutrients from day 21 (Phase V) (Tanaka et al., 2007).
The highest particulate primary production was observed in the first two phases. At
25
the time of silicate depletion (Day 6), 70% of the total production was observed in the largest size fraction (>10 µm), and the same fraction used 50–70% of the33PO4-uptake
BGD
4, 4385–4410, 2007 Primary productionat at elevated CO2 concentrations J. K. Egge et al. Title Page Abstract Introduction Conclusions References Tables Figures ◭ ◮ ◭ ◮ Back CloseFull Screen / Esc
Printer-friendly Version Interactive Discussion
EGU algae during the two first phases (Schulz et al., 2007). As net production was hardly
observed after Phase II, diatoms were probably the main contributors to the net primary production during the PeECE III experiment. Higher production was observed at 3× than at 1× and 2× CO2in the >10 µm fraction. The difference was not significant, and
mainly observed after Day 6. Since photosynthetic carbon fixation rate of all diatoms
5
tested so far are at or close to saturation at present CO2 levels (Riebesell, 2004), we
did not expect to see much effect in this group. In a field incubation experiment, Tortell et al. (2002) observed no change in primary production, but a relative shift in species composition between 150 and 750 ppm CO2. In their experiment, diatoms became
more abundant, Phaeocystis biomass decreased with increasing CO2. Also the ratio
10
between consumed nitrate and consumed silicate, N:Si, decereased with decreasing CO2. In our experiment, neither consumption of nutrients, nor diatom abundance was
affected by CO2levels (Schulz et al., 2007).
Most species of marine phytoplankton tested to date can use HCO−
3 in addition to
CO2as a source for inorganic carbon (Tortell et al., 1997; Burkhard et al., 2001; Rost
15
et al., 2003; Giordano et al., 2005). For the two diatoms Thalassiosira weissflogii and
Phaeodactylum tricornutum, Burkhardt et al. (2001) showed that photosynthesis was
unaffected by pCO2levels ranging from 36 to 1800 ppmv CO2, but the uptake of HCO−3
was more important as source of inorganic C at low CO2 levels than at high. If this
is a general trend among diatoms, it can also explain why primary production in our
20
experiment was less affected by CO2levels in the period when diatoms dominated the
phytoplankton community.
As in several previous mesocosms experiments, blooms of E. huxleyi occurred in mesocosms fertilized with nitrate and phosphate (Egge and Heimdal, 1994; Engel et al., 2005). In the PeECE III experiment, however, the maximum numbers were low
25
compared with previous observations, and the highest cell numbers were observed during Phase II (Paulino et al., 2007). The size fraction 5–10 µm has previously been shown to represent E. huxleyi quite well -when the bloom is dominated by this species (Egge, 1994, Engel et al., 2007). Maximum primary production rates in the 5–10 µm
BGD
4, 4385–4410, 2007 Primary productionat at elevated CO2 concentrations J. K. Egge et al. Title Page Abstract Introduction Conclusions References Tables Figures ◭ ◮ ◭ ◮ Back CloseFull Screen / Esc
Printer-friendly Version Interactive Discussion
EGU fraction occurred on Day 10, when E. huxleyi numbers ranged from 4.4 to 4.7×10³
cells ml−1 (Paulino et al., 2007). Assuming E. huxleyi to be the dominant photoau-totroph in this fraction, our measured production of 17–26 µg C L−1d−1 corresponds
to 4–5 pg C cell−1d−1. This is in the same order of magnitude as reported from lab-oratory experiments (7–10 pg C cell−1d−1) (Skattebøl, 1995; Zondervan et al., 2001).
5
The actual production of POC per E. huxleyi cell in the current experiment must have been considerably lower, as other species including other haptophyte species were more numerous and probably contributed more to the primary production in this frac-tion (Schulz et al., 2007; Paulino et al., 2007). Both increasing (Zondervan et al., 2001; Leonardos and Geider, 2005) and decreasing (Sciandra et al., 2003) production at
el-10
evated levels of CO2 were reported for E. huxleyi. Average primary production in the
fraction 5–10 µm showed a weak increase with increasing CO2,. The same trend was observed both for E. huxleyi numbers and the other nano-sized phytoplankton from the flowcytometer counts (Paulino et al., 2007, Fig. 4). In the last part of the PeECE I experiment, 2001, E. huxleyi reached maximum cell numbers up to 10 times higher
15
than the present experiment, but elevated CO2had no conspicuous effect on primary
production (Delille et al., 2005; Engel et al., 2005). Sciandra et al. (2003) observed decreased production of POC in cultures of E. huxleyi at elevated levels of CO2when nitrate was depleted. Nitrate was also depleted when the bloom peaked in 2001, and could have reduced the stimulating effect of elevated CO2 on E. huxleyi production
20
observed in other studies.
Production in the 1–5 µm fraction increased during the experiment and contributed 18 % of the total production. Synechococcus was probably an important contributor to the primary production in this fraction, and this genus became numerous towards the end of this experiment reaching cell numbers between 3 and 4×10⁵cell ml−1 (Paulino
25
et al., 2007). The development of primary production in this fraction mirrors the
Syne-chococcus abundance, which increased markedly during the last week of the
exper-iment. Cell numbers were higher in 1× CO2than in the two treatments with elevated
BGD
4, 4385–4410, 2007 Primary productionat at elevated CO2 concentrations J. K. Egge et al. Title Page Abstract Introduction Conclusions References Tables Figures ◭ ◮ ◭ ◮ Back CloseFull Screen / Esc
Printer-friendly Version Interactive Discussion
EGU experiment in 2001 where the highest cell numbers of Synechoccocus were observed
in the treatment with lowest CO2 (190 µatm) (Rochelle-Newall et al., 2004). Primary
production in the 1–5 µm fraction was also highest in the 1× CO2treatment, but only
on the very last day of the experiment. Analyses from FCM also showed that other pi-coautotrophs (1–2 µm cells) indicated the opposite response to elevated CO2,with the
5
highest cell numbers in the 3× CO2. These opposing effects will reduce the total effect
in this size fraction even though Synechococcus numbers were 5 fold higher than other small picoeucaryotes during the last days of the experiment.
5 Concluding remarks
With our techniques, we did not observe significant effects of elevated CO2 on daily
10
primary production during the PeECE experiments. The trend found in cumulative
14
C-based particulate primary production was, however, consistent with the over-consumption of DIC at high CO2 reported by Riebesell et al. (2007) and Bellerby et al. (2007). Splitting the production into size-fractions gave more information, and when the dynamics of fractionated production was compared to species composition, the
re-15
sults indicate that in some groups or species primary production may be stimulated at elevated CO2 levels. The 5–10 µm fraction showed a tendency towards increasing
production with increasing CO2 concentration, but as the production in this fraction
was low, it did not contribute much to total production. Also, if two group of organism respond opposite to elevated CO2 the effect on primary production will be reduced or
20
eliminated, as suspected for Synechococcus and other picoautrophs the 1-5µm frac-tion.
The trend in 14C-based particulate primary production was only visible when inor-ganic nutrients were depleted. This could be due to the fact that the diatoms dominating in the first part were not affected by pCO2or that pCO2only affects primary production
25
in nutrient stressed phytoplankton. Nutrient limitation may affect phytoplankton as well as bacteria, and the net outcome on community production may therefore well be
differ-BGD
4, 4385–4410, 2007 Primary productionat at elevated CO2 concentrations J. K. Egge et al. Title Page Abstract Introduction Conclusions References Tables Figures ◭ ◮ ◭ ◮ Back CloseFull Screen / Esc
Printer-friendly Version Interactive Discussion
EGU ent in different experiments where the conditions controlling bacterial carbon demand
may differ.
Experiments with duration of a few weeks do not include all possibilities in a poten-tially adaptive plankton community, extrapolation to long time scales should therefore be done with caution.
5
Acknowledgements. The staff at the Marine Biological Station, University of Bergen, in
particu-lar T. Sørlie and A. Aadnesen, and the Bergen Marine Research infrastructure (RI) are gratefully acknowledged for support in mesocosm logistics. C. Neill for providing TCO2 data for primary production calculations, and Geophysical Institute, Univerity of Bergen for providing data for global radiation. This study was supported by EU-TMR contract no HPRI-CT-2002-00181, and
10
NFR project no. 158936/I10 Biodiversity patterns: Blooms versus stable coexistence in the lower part of the marine pelagic food web.
References
Bellerby, R. G. J., Schulz. K. G., Ribesell, U., Neil, C., Nondal, G., Johannessen, T., and Brown, K. R.: Marine ecosystem community carbon and nutrient uptake stoichiometry under
vary-15
ing ocean acidification during the PeECE III experiment, Biogeoscienes Discuss., accepted, 2007.
Burkhardt S., Amoroso, G., Riebesell, and U., and S ¨ultemeyer, D.: CO2 and HCO−
3 uptake in
marine diatoms acclimated to different CO2 concentrations, Limnol. Oceanogr., 46, 1378–
1391, 2001.
20
Clark, D. R. and Flynn, K. J.: The relationship between the dissolved inorganic carbon concen-tration and growth rate in marine phytoplankton, Proc. R. Soc. Lond., 267, 953–959, 2000. Delille, B., Harley, J., Zondervan, I., Jacquet, S., Chou, L., Wollast, R., Bellerby, R.
G. J., Frankignoulle, M., Borges, A. V., Riebesell, U., and Gattuso, J. P.: Re-sponse of primary production and calcification to changes of pCO2 during experimental
25
blooms of the coccolithophorid Emiliania huxleyi, Global Biogeochem. Cy., 19, GB2023, doi:10.1029/2004GB002318, 2005.
Dickson, A. G.: Determination of dissolved oxygen in sea water by Winkler titration, WHP Operations and Methods, WHPO publication 90-1, 1994.
BGD
4, 4385–4410, 2007 Primary productionat at elevated CO2 concentrations J. K. Egge et al. Title Page Abstract Introduction Conclusions References Tables Figures ◭ ◮ ◭ ◮ Back CloseFull Screen / Esc
Printer-friendly Version Interactive Discussion
EGU
Dugdale, R. C. and Goering, J. J.: Uptake of new and regenerated forms of nitrogen in primary productivity, Limnol. Oceanogr., 12, 196–206, 1967.
Egge, J. K.: Nutrient control of phytoplankton growth: Effects of macronutrients composition (N, P, Si) on species succession, Dr. Scient thesis, University of Bergen, Norway, ISBN 82-7744-007-3, 1994
5
Egge, J. K. and Heimdal, B. R.: Blooms of phytoplankton including Emiliania huxleyi (Hapto-phyta), Effects of nutrient supply in different N:P ratios, Sarsia, 79, 333–348, 1994.
Engel, A.: Direct relationship between CO2 uptake and transparent exopolymer particles pro-duction in natural phytoplankton, J. Plank. Res., 24, 49–53, 2002.
Engel, A., Delille, B., Jacquet, S., Riebesell, U., Rochelle-Newall, E., Terbr ¨uggen, A., and
10
Zondervan, I.: Tarnsparant exopolymer particles and dissolved organic carbon production by Emiliania huxleyi exposed to different CO2concentrations: a mesocosm experiment, Aquat.
Microb. Ecol., 34, 93–104, 2004.
Engel, A., Zondervan, I., Aerts, K., Baufort, L., Benthien, A. Chou, L., Delille, B., Gattuso, J. P., Harley, J., Heeman, C., Hoffmann, L., Jacquet, S., Nejstgaard, J., Pizay, M. D.,
Rochelle-15
Newall, E., Schneider, U., Terbrueggen, A., and Riebesell, U.: Testing the direct effect of CO2
concentration on a bloom of the coccolithophorid Emiliania huxleyi in mesocosm experiment, Limnol. Oceanogr., 50, 493–507, 2005.
Engel, A., Schulz, K., Riebesell, U., Bellerby, R., Delille, B., and Schhartau, M.: Effects of CO2 on particle size and phytoplankton abundance during a mesocosm bloom experiment
20
(PeECE II), Biogeoscienes Discuss., 4, 4101–4133, 2007.
Gargas, E.: A manual for phytoplankton primary production studies in the Baltic, The Baltic Marine Biologists, Publication No. 2, The Danish Agency of Environmental Protection, Hørsholm, 1975.
Grossart, H. P., Allgaier, M., Passow, U., and Riebesell, U.: Testing the effect of CO2
concentra-25
tion on the dynamics of marine heterotrophic bacterioplankton, Limnol. Oceanogr., 51, 1–11, 2006.
Gazeau, F., Middelburg, J. J., Loijens, M., Vanderborght J.-H., Pizay, M.-D., and Gattuso, J.-P.: Planktonic primary production in estuaries: comparison of14C, O2and18O methods, Aquat. Microb. Ecol., 46, 95–106, 2007.
30
Giordano, M., Beardall, J., and Raven, J. A.: CO2concentrating mecanisms in algae: Mecha-nisms, environmental modulation, and evolution, Ann. Rev. Plant. Biol., 56, 99–131, 2005. Hein, M. and Sand-Jensen, K.: CO2increases oceanic primary production, Nature, 338, 526–
BGD
4, 4385–4410, 2007 Primary productionat at elevated CO2 concentrations J. K. Egge et al. Title Page Abstract Introduction Conclusions References Tables Figures ◭ ◮ ◭ ◮ Back CloseFull Screen / Esc
Printer-friendly Version Interactive Discussion
EGU
527, 1997.
John, D. E., Wang, Z. A., Liu, X., Bryne, R. H., Corredor, J. E., L ´opez, J. M., Cabrea, A., Bronk, D. A., Tabita, F. R., and Paul, J. H.: Phytoplankton carbon fixation gene (RuBisCO) transcripts and air-sea CO2flux in the Mississippi River plume, The ISME Journal, 517–531, 2007.
5
Johnson, P. W. and Sieburth, J. M.: Chroococcoid cyanobacteria in the sea: a ubiquitous and diverse phototrophic biomass, Limnol. Oceangr., 24, 928–935, 1979.
Karl, D. M., Hebel, D. V., and Bj ¨ormann, K.: The role of dissolved organic matter release in the productivety of the oligitropic North Pacific Ocean, Limnol. Oceaogr., 43, 1270–1286, 1998. Leonardos, N. and Geider, R. J.: Elevated atmospheric carbon dioxide increases organic
car-10
bon fixation by Emiliania huxleyi (Haptophyta), under nutrient-limited high-light conditions, J. Phycol., 41, 1196–1203, 2005.
Li, W. K. W.: Primary production of prochlorophytes, cyanobacteria, and eukaryotic ultraplank-ton: Measurements from flow cytometer sorting, Limnol. Oceanogr., 39, 169–175, 1994. Li, W. K. W., Irwin, B. D., and Dickie, P. M.: Variation related to biomass and productivety of
15
phytoplankton and bacteria, Limnol. Oceanogr., 38, 483–494, 1993.
Paulino, A. I., Egge, J. K., and Larsen, A.: Effects of increased atmospheric CO2 on small
and intermediate sized osmotrophs during a nutrient induced phytoplankton bloom, Biogeo-scienes Discuss., accpeted, 2007.
Raven, J. A.: Physiology of inorganic C acquisition and implications for resource use efficiency
20
by marine phytoplankton: relation to increased CO2 and temperature, Plant. Cell. Environ., 14, 779–774, 1991.
Raven, J. A. and Jonston, A. M.: Mechanisms of inorganic-carbon acquisition in marine phyto-plankton and their implications for the use of other recourses, Limnol. Oceanogr., 36, 1701– 1714, 1991.
25
Riebesell, U.: Effects of CO2enrichment on marine phytoplankton, J. Oceanogr., 60, 719–729,
2004.
Riebesell, U., Wolf-Gladrow, D. A., and Smetacek, V.: Carbon dioxide limitataion of marine phytoplankton growth rates, Nature, 361, 249–251, 1993.
Riebesell, U., Schulz, K. G., Bellerby, R. G. J., Botros, M., Fritsche, P., Meyerh ¨ofer, M., Neil, C.,
30
Nondal, G., Oschies, A., Wohlers, J. and Z ¨ollner, E.: Enhanced biological carbon consump-tion in high CO2ocean, Nature, 450, 545–548, doi:10.1038/nature06267, 2007.
BGD
4, 4385–4410, 2007 Primary productionat at elevated CO2 concentrations J. K. Egge et al. Title Page Abstract Introduction Conclusions References Tables Figures ◭ ◮ ◭ ◮ Back CloseFull Screen / Esc
Printer-friendly Version Interactive Discussion
EGU
Terbruggen, A., and Zondervan, I.: Chromophoric dissolved organic matter in experimental mesocosm maintained under different pCO2levels, Mar. Ecol. Prog. Ser., 272, 25–31, 2004.
Rost, B., Riebesell, U., Burkhardt, S., and S ¨ultemeyer, D.: Carbon acquisition of bloom-forming, Limnol. Oceanogr., 48, 55–67, 2003.
Sciandra, A., Harley, J., Lef `evre, D., Lem ´ee, R., Rimmelin, P., Denis, M., and Gattuso, J. P.:
5
Response of coccolithophorid Emiliania huxleyi to elevated partial pressure of CO2 under nitrogen limitation, Mar. Ecol. Prog. Ser., 261, 111–122, 2003.
Schippers, P., L ¨urling, M., and Scheffer, M.: Increase of atmospheric CO2 promotes
phyto-plankton productivity, Ecol. Lett., 446–451, 2004.
Schulz, K. G., Riebesell, U., Bellerby, R., et al.: Built-up and decline of organic matter during
10
PeECE III, Bigeoscienes Discuss., accepted, 2007.
Skattebøl, S.: Coccolitdannelse I lys og I mørke hos Emiliania huxleyi (Lohmann) Hat et Mohler. Laboratorie- og feltundersøkelser, Cand. Scient thesis, University of Oslo, Norway, p. 72, 1995.
Steeman Nielsen, E.: The use of radioactive (14C) for measuring organic production in the sea,
15
J. Cons. Perm. Int. Expl. Mer., 18, 117–140, 1952.
Tanaka, T., Thingstad, T. F., Løvdal, T., Grossart, H.-P., Larsen, A., Schulz, K., and Riebesell, U.: Availability of phosphate for phytoplankton and bacteria and of labile organic carbon for bacteria at different pCO2levels in mesocosm study, Biogeoscienes, Discuss., 4, 3937–3960,
2007.
20
Thingstad, T. F.; Microbial processes and the biological carbon pump, in: Towards a model of ocean biogeochemical processes, edited by: Evans, G. T. and Fasham, M. J. R., NATO ASI Series Vol I 10, Springer Verlag Heidelberg, 193–208, 1993.
Thingstad, T. F., Hagstrom, A., and Rassoulzadegan, F.: Accumulation of degradable DOC in surface waters: Is it caused by a malfunctioning microbial loop?, Limnol. Oceanogr., 42,
25
398–404, 1997.
Tortell, P. D., Reinfelder, J. R., and Morel, F. M. M.: Active uptake of bicarbonate by diatoms, Nature, 390, 243–244, 1997.
Tortell, P. D., DiTullino, G. R., Sigman, D. M., and Morel, F. M. M.: CO2 effects on taxonomic composition and nutrient utilization in an Equatorial Pasific phytoplankton assemblage, Mar.
30
Ecol. Prog. Ser., 236, 37–43, 2002.
Winkler, L. W.: Die Bestimmung des in Wasser gel ¨osten Sauerstoffes. Berichte der Deutschen Chemischen Gesellschaft, 21, 2843–2855, 1888.
BGD
4, 4385–4410, 2007 Primary productionat at elevated CO2 concentrations J. K. Egge et al. Title Page Abstract Introduction Conclusions References Tables Figures ◭ ◮ ◭ ◮ Back CloseFull Screen / Esc
Printer-friendly Version Interactive Discussion
EGU
Zondervan, I., Zeebe, R. E., Rost, B., and Riebesell, U.: Decreasing marine biogenic cal-sification: a negative feedback on rising atmospheric pCO2, Global Biogeochem. Cy., 15, 507–516, 2001.
BGD
4, 4385–4410, 2007 Primary productionat at elevated CO2 concentrations J. K. Egge et al. Title Page Abstract Introduction Conclusions References Tables Figures ◭ ◮ ◭ ◮ Back CloseFull Screen / Esc
Printer-friendly Version Interactive Discussion
EGU
Table 1. Experimental period and CO2and nutrient manipulation of PeECE I, II and III carried out in 2001, 2003 and 2003, respectively. Temperature range and average global radiation (Geophysical institute, University of Bergen) is given.
2001 2003 2005
Experimental period 31.05–25.06. 04.05–24.05. 16.05.–10.06. CO2concentration 180, 370, 700 µatm 190, 370, 700 µatm 375, 750, 1150 µatm Initial nutrient supply 9 µM N, 0.5 µM P,
17 µM N, 0.5 µM P 12 µM Si 15 µM N, 0.6 µM P Temperature range 10–13◦C 8–10◦C 9–11.5◦C
BGD
4, 4385–4410, 2007 Primary productionat at elevated CO2 concentrations J. K. Egge et al. Title Page Abstract Introduction Conclusions References Tables Figures ◭ ◮ ◭ ◮ Back CloseFull Screen / Esc
Printer-friendly Version Interactive Discussion
EGU
Table 2. Average primary producton (µmol C L−1h−1), gross production (µmol O
2L−1 d−1) net
production (µmol O2L−1d−1) and net community respiration (µmol O
2L−1d−1) for the PeECE
II experiment, 2003.
CO2treatment Primary production Gross production Net production Community respiration
µmol C L−1h−1 µmol O 2L−1d−1 µmol O2L−1d−1 µmol O2L−1d−1 Past (190 ppmV) 0.28 18.37 −1.33 5.42 Past (190 ppmV) 0.40 16.02 1.95 4.26 Present (370 ppmV) 0.45 20.30 1.33 4.49 Present (370 ppmV) 0.52 20.77 3.94 3.89 Future (700 ppmV) 0.43 16.89 1.44 3.63 Future (700 ppmV) 0.44 18.41 0.49 4.05
BGD
4, 4385–4410, 2007 Primary productionat at elevated CO2 concentrations J. K. Egge et al. Title Page Abstract Introduction Conclusions References Tables Figures ◭ ◮ ◭ ◮ Back CloseFull Screen / Esc
Printer-friendly Version Interactive Discussion EGU (a) µ m ol C l -1 h -1 0,0 0,5 1,0 1,5 2,0 2,5 3x CO2 2x CO2 1x CO2 Day no. 0 5 10 15 20 25 µ m ol C l -1 0 50 100 150 200
Fig. 1. Development of14C primary production through PeECE III; daily variation in µmol C l−1
h−1(a) and cumulative production in µmol C l−1for the 24 days experimental period (b). Values
are means ±SD of triplicate CO2treatments with 1× CO2(green), 2× CO2(grey) and 3× CO2
BGD
4, 4385–4410, 2007 Primary productionat at elevated CO2 concentrations J. K. Egge et al. Title Page Abstract Introduction Conclusions References Tables Figures ◭ ◮ ◭ ◮ Back CloseFull Screen / Esc
Printer-friendly Version Interactive Discussion EGU Gross production X Data µ m o l O2 l -1 d -1 0 20 40 60 80
Net community production
µ m o l O2 l-1 d -1 -20 0 20 40 60 80 Community respiration Day no. 0 5 10 15 20 25 µ m o l O2 l -1 d -1 0 10 20 30 3xCO2 2x CO2 1x CO2
Fig. 2. Gross- and Net community-production and Community respiration given as µmol O2 L−1 d−1 based on oxygen incubations. Values are means ±SD of triplicate CO2 treatments,
BGD
4, 4385–4410, 2007 Primary productionat at elevated CO2 concentrations J. K. Egge et al. Title Page Abstract Introduction Conclusions References Tables Figures ◭ ◮ ◭ ◮ Back CloseFull Screen / Esc
Printer-friendly Version Interactive Discussion EGU 0.1-2 µm µ m o l C l -1d -1 0 1 2 3 4 5 3x CO2 (M2) 2x CO2 (M5) 1x CO2 (M8) 1-5µm 0 1 2 3 4 5 -10 µm -1 0 1 2 3 > 10 µm Day no 0 5 10 15 20 25 0 2 4 6 8 10 12 14
Fig. 3. Average14C primary production (µmol C l−1d−1), in the fractions 0.2–1, 1–5, 5–10 and
>10 µm. One mesocosm of each CO2treatment (M2, M5 and M8) is investigated. Values are means±SD of triplicate incubations in each mesocosm, and colour code as in Fig. 1.
BGD
4, 4385–4410, 2007 Primary productionat at elevated CO2 concentrations J. K. Egge et al. Title Page Abstract Introduction Conclusions References Tables Figures ◭ ◮ ◭ ◮ Back CloseFull Screen / Esc
Printer-friendly Version Interactive Discussion EGU Size fraction 0.2-1 1-5 5-10 >10 Total µ m o l C L -1 d -1 0 1 2 3 4 5 6 7 3x CO2 2x CO2 1x CO2
Fig. 4. Average14C primary production (µmol C L−1d−1) for the 24 days experimental period