HAL Id: hal-00297933
https://hal.archives-ouvertes.fr/hal-00297933
Submitted on 5 Nov 2007HAL is a multi-disciplinary open access
archive for the deposit and dissemination of sci-entific research documents, whether they are pub-lished or not. The documents may come from teaching and research institutions in France or abroad, or from public or private research centers.
L’archive ouverte pluridisciplinaire HAL, est destinée au dépôt et à la diffusion de documents scientifiques de niveau recherche, publiés ou non, émanant des établissements d’enseignement et de recherche français ou étrangers, des laboratoires publics ou privés.
Marine viral populations detected during a nutrient
induced phytoplankton bloom at elevated pCO2 levels
J. B. Larsen, A. Larsen, R. Thyrhaug, G. Bratbak, R.-A. Sandaa
To cite this version:
J. B. Larsen, A. Larsen, R. Thyrhaug, G. Bratbak, R.-A. Sandaa. Marine viral populations detected during a nutrient induced phytoplankton bloom at elevated pCO2 levels. Biogeosciences Discussions, European Geosciences Union, 2007, 4 (6), pp.3961-3985. �hal-00297933�
BGD
4, 3961–3985, 2007 Marine phytoplankton viruses at elevated CO2 J. B. Larsen et al. Title Page Abstract Introduction Conclusions References Tables Figures ◭ ◮ ◭ ◮ Back CloseFull Screen / Esc
Printer-friendly Version Interactive Discussion
EGU Biogeosciences Discuss., 4, 3961–3985, 2007
www.biogeosciences-discuss.net/4/3961/2007/ © Author(s) 2007. This work is licensed
under a Creative Commons License.
Biogeosciences Discussions
Biogeosciences Discussions is the access reviewed discussion forum of Biogeosciences
Marine viral populations detected during
a nutrient induced phytoplankton bloom
at elevated pCO
2
levels
J. B. Larsen, A. Larsen, R. Thyrhaug, G. Bratbak, and R.-A. Sandaa
Dept. of Biology, Jahnebakken 5, University of Bergen, P. Box 7800, 5020 Bergen, Norway Received: 9 October 2007 – Accepted: 21 October 2007 – Published: 5 November 2007 Correspondence to: A. Larsen ([email protected])
BGD
4, 3961–3985, 2007 Marine phytoplankton viruses at elevated CO2 J. B. Larsen et al. Title Page Abstract Introduction Conclusions References Tables Figures ◭ ◮ ◭ ◮ Back CloseFull Screen / Esc
Printer-friendly Version Interactive Discussion
EGU
Abstract
During the PEeCE III mesocosm experiment in 2005 we investigated how the virio-plankton community responded to increased levels of nutrients (N and P) and CO2.
We applied a combination of flow cytometry, Pulsed Field Gel Electrophoresis and de-generated PCR primers to categorize and quantify individual viral populations, and to
5
investigate their temporal dynamics. Species specific and degenerated primers en-abled us to identify two specific large dsDNA viruses, EhV and CeV, infecting the haptophytes Emiliania huxleyi and Crysochromulina ericina, respectively. Some of the viral populations detected and enumerated by flow cytometry did not respond to altered CO2-levels, but the abundance of EhV and an unidentified dsDNA virus
de-10
creased with increasing CO2levels. Our results thus indicate that CO2conditions may affect the marine pelagic food web at the viral level. Our results also demonstrate that in order to unravel ecological problems as how CO2and nutrient levels affect the
rela-tionship between marine algal viruses and their hosts, we need to continue the effort to develop molecular markers used to identify both hosts and viruses.
15
1 Introduction
Increase in diffusion of CO2 into the ocean has been proposed as a negative
feed-back mechanism, counteracting the observed, and future expected, increase in atmo-spheric CO2 levels (McNeil et al., 2003). It is, however, uncertain to which extend such an increase will influence the marine microbial community, and how a possibly
20
consequential change in the marine microbial composition will affect the oceans role as a sink for CO2 in the future. Marine viruses may be affected by altered CO2
lev-els in the ocean, and may also influence their host organisms differently as the CO2
concentrations changes. Viruses are known to be the most abundant biological entity on earth and although being considerably smaller than bacteria, their sheer number,
25
con-BGD
4, 3961–3985, 2007 Marine phytoplankton viruses at elevated CO2 J. B. Larsen et al. Title Page Abstract Introduction Conclusions References Tables Figures ◭ ◮ ◭ ◮ Back CloseFull Screen / Esc
Printer-friendly Version Interactive Discussion
EGU tributor to the global biomass (Suttle, 2005). They are thought to play an essential role
in cycling of nutrients in the marine environment as well as in the population dynam-ics of phyto- and bacterioplankton (Fuhrman, 1999; Fuhrman and Schwalbach, 2003; Brussaard, 2004; Suttle, 2005).
Polymerase Chain Reaction targeting conservative sequences of bacteriophages
5
and more specifically cyanophages, have been used to study the diversity of these viral groups (Breitbart et al., 2004; Millard et al., 2004; Fil `ee, 2005; Sullivan, 2006). The impact that phages exercise on bacterioplankton composition and diversity have also been investigated both empirically (Hewson et al., 2003; Hewson and Fuhrman, 2006; Hewson and Wommack, 2006) and theoretically (Murray and Jackson, 1992;
10
Thingstad and Lignell, 1997; Thingstad, 2000). There is increasing evidence that virus also influence the microbial community by acting as important agents of mortality for phytoplankton, causing release of nutrients bound in cellular biomass and relieving competitive pressure by dominant species (Larsen et al., 2001; Martinez-Martinez et al., 2006). The model describing the relationship between bacterial diversity and
15
viruses, in which coexistence of competing bacterial species is maintained by viruses that “kill the winner” may thus also apply for algae and algal viruses (Thingstad, 2000). However, only a few complete algal virus genome sequences are available (Van Etten et al., 2002; Wilson et al., 2005) and the basis for designing general molecular probes that allow for detailed studies of native viral assemblages is limited. Many ecological
20
studies of aquatic algal viruses hence rely on relatively coarse methods like flow cytom-etry (FCM) and pulsed field gel electrophoresis (PFGE) (Castberg et al., 2001; Larsen et al., 2001; Li and Dickie, 2001; Jacquet et al., 2002; Larsen et al., 2004; Baudoux et al., 2006; Martinez-Martinez et al., 2006; Sandaa and Larsen, 2006).
A notable exception to the problem of identifying specific virus populations and
cor-25
relating them with host populations in natural ecosystems is Emiliania huxleyi and its associated virus EhV. One reason is that the full genome sequence is known for a EhV strain (Wilson et al., 2005), but maybe equally important, both host and virus gives dis-tinct fluorescence and scatter signals in the flow cytometer allowing temporal dynamics
BGD
4, 3961–3985, 2007 Marine phytoplankton viruses at elevated CO2 J. B. Larsen et al. Title Page Abstract Introduction Conclusions References Tables Figures ◭ ◮ ◭ ◮ Back CloseFull Screen / Esc
Printer-friendly Version Interactive Discussion
EGU to be followed in environmental samples (Castberg et al., 2001; Jacquet et al., 2002;
Wilson et al., 2002; Martinez-Martinez et al., 2006). Emiliania huxleyi form dense blooms at temperate to sub-arctic latitudes and is in climate research considered to be a key phytoplankton species in marine carbon and calcite cycles. A mesocosm exper-iment, performed at the Marine Biological Field Station, University of Bergen, Norway,
5
in May-June 2005, was therefore designed to investigate the effect of different pCO2
pressures on blooms of E. huxleyi and co-occurring phytoplankton species. This ex-periment provided a unique opportunity to explore the effect of altered pCO2 on EhV
and E. huxleyi host-virus interactions. The effect on other phytoplankton viruses was assessed using flow cytometry and PFGE in combination with a new set of species
10
specific and degenerated PCR primers allowing detection and identification of a more diverse group of large dsDNA viruses.
2 Material and methods
2.1 Experimental setup
The mesocosm experiment consisted of nine seawater enclosures mounted on floating
15
frames along a raft located in a small bay in Raunefjorden outside Bergen, Norway. The seawater in the enclosures was manipulated to three different pCO2levels (1050 µatm
(3×CO2), 700 µatm (2×CO2) and 350 µatm (1×CO2)) with three replicate enclosures
for each level. The mesocoms’ headspace was kept at target CO2 levels to simulate
1×, 2× and 3× atmospheric CO2 levels. Samples for flow cytometric virus
enumer-20
ation were obtained from all nine enclosures and from the adjacent seawater every second day for the first 6 days of the experiment and then daily thoughout the experi-ment. Samples for PFGE and PCR reactions were collected from one enclosure from each of the CO2levels: Enclosure 2 (3×CO2), enclosure 5 (2×CO2) and enclosure 8
(1×CO2) on day 0, 6, 9, 11, 12, 15, 17, 19, 23, 25 and 27. For a full description of the
BGD
4, 3961–3985, 2007 Marine phytoplankton viruses at elevated CO2 J. B. Larsen et al. Title Page Abstract Introduction Conclusions References Tables Figures ◭ ◮ ◭ ◮ Back CloseFull Screen / Esc
Printer-friendly Version Interactive Discussion
EGU experimental setup and sampling procedures, see Schulz et al. (2007)1.
2.2 Flow cytometry
Samples for enumeration of viruses were fixed with glutaraldehyde (final concentration 0.5%) for 30 min at 4◦C, snap frozen in liquid nitrogen and stored at −70◦C until further analysis. Thawed samples were diluted in 0.2 µm filtered 1xTE-buffer and stained
5
with SYBR Green I (Molecular Probes Inc., Eugene, OR) for 10 min in the dark at 80◦C. The samples were analysed by flow cytometer at event rates between 100–1000
viruses per second. The flow cytometer setup is described in Marie et al. (1999). The discrimination of virus populations was based on groups observed in scatter plots of SSC signal versus green DNA dye fluorescence (SYBR Green I)(Fig. 1).
10
2.3 Pulsed field gel electrophoresis
For PFGE 2 litres of sampled seawater was pre-filtered on 0.45 µm pore-size low-protein-binding Durapore membrane filters of 142 mm in diameter (Millipore, Billerica, MA, USA) in order to remove zooplankton, phytoplankton and some of the bacteria. The filtrate was then concentrated to ∼45 mL using a QuixStand benchtop system with
15
100 000 pore size (NMWC) hollow fibre cartridges (GE Healthcare Bio-Sciences AB, Uppsala, Sweden). Five mL was stored at 4◦C and used as template in PCR
re-actions (see below), and 40 mL was pelleted by ultracentrifugation at 28 000 rpm for 1 h. Following ultracentrifugation, the supernatant was removed, and pellets resus-pended overnight in 300 µL SM-Buffer at 4◦C. 200 µL concentrate was used to make
20
four PFGE plugs by adding 200 µL of Insert agarose (FMC, ME, USA). Hence, each plug contained virus concentrate from 0.3 L of seawater. Lysis and washing of the plugs was performed as described by Larsen et al. (2001). The plugs were loaded onto a
1
Schulz, K. G. and Riebesell, U.: Build-up and decline of organic matter during PEeCE III, Biogeosciences Discuss., in preparation, 2007.
BGD
4, 3961–3985, 2007 Marine phytoplankton viruses at elevated CO2 J. B. Larsen et al. Title Page Abstract Introduction Conclusions References Tables Figures ◭ ◮ ◭ ◮ Back CloseFull Screen / Esc
Printer-friendly Version Interactive Discussion
EGU 1% Seakem GTG agarose gel (FMC, ME, USA), together with a ladder (lambda size
marker, Bio-Rad). Electrophoresis was done on a Bio-Rad DR-II electrophoresis unit, coupled to a Bio-Rad Chef DR-II drive and control module. Each gel was run in 1xTBE buffer (Tris-Buffered EDTA), at a total voltage of 6 V. Three different settings for switch-ing time were used for separatswitch-ing DNA originatswitch-ing from small (SGV), medium (MGV)
5
and large genome sized viruses (LGV). Pulses were set between 1 to 5 s for 20 h for separation of SGV: 0–150 kb, 8 to 30 s switch time for separation of MGV: 150–250 kb, and 20 to 40 s for 22 h for separation of LGV: 250–600 kb. Following electrophoresis the gels were stained for 30 minutes in a 10 000 dilution of SYBR green I in dH2O, and
visualised on a LAS-3000 imaging system (Fujifilm Life Science, Stanford, CT, USA).
10
2.4 PCR and sequencing
All bands occurring on the PFGE gels within each of the three size ranges (SGV, MGV, LGV) were pooled and excised from the gel. Specific single bands coinciding in size with previously isolated viruses were also cut out. All excised material was frozen at −20◦C, and DNA was later extracted using GeneClean Turbo kit (BIO101) for extraction
15
of large DNA fragments from agarose gel, following the manufacturer’s instructions yielding approximately 10 ng/µL of DNA (total 30 µL).
The presence of cyanophages was investigated using primers targeting the photo-synthetic genes psbD on the DNA originating from the pooled PFGE bands (Clokie, 2006). The PCRs were carried out in a total volume of 50 µL containing: sterile
dis-20
tilled water, PCR buffer (10 x PCR buffer B, Promega, Madison, WI), dNTPs (each 200 nM), primers (each 0.5 µM), 1.5 mM MgCl, 2.5 U Taq DNA polymerase (Promega) and template amplicon (1–2 ng). Amplification conditions were: 94◦C for 5 min, 35 cy-cles of 94◦C for 1 min, 50◦C 1 min, and 72◦C for 1 min, and a final extension at 72◦C for
10 min.
25
DNA from the specific PFGE bands, which coincided in size with previously isolated viruses, were investigated using primers targeting the major capsid protein in a stan-dard PCR setup containing 30 cycles of denaturation at 94◦C, annealing at 55◦C and
BGD
4, 3961–3985, 2007 Marine phytoplankton viruses at elevated CO2 J. B. Larsen et al. Title Page Abstract Introduction Conclusions References Tables Figures ◭ ◮ ◭ ◮ Back CloseFull Screen / Esc
Printer-friendly Version Interactive Discussion
EGU elongation at 72◦C. Primer sequences used to amplify DNA from “EhV-size bands”
were 5’-TTT AAT TTC TCG GGC ATT GG-3’ (forward) and 5’-GAG AAC GAG TAC GAG TAG ATG-3’ (reverse), and the primers targeting “CeV-size bands” was 5’-TGC CCT TCC TTT AAT TGC AC-3’ (forward) and 5’-TAG AGT GAT GCC GCA ACA AG-3’ (reverse).
5
Degenerated primers designed to target algae viruses of Phycodnaviridae (unpub-lished results) were also used to amplify a sequence of the major capsid protein from the virus concentrate directly (see concentration procedure above). PCRs were per-formed with 2 µL virus concentrate as template DNA in a total reaction volume of 20 µL containing 10 µL HotStar master mix (Quiagen, Germany), and 0.5 µM of each of the
10
primers 5’-GGY GGY CAR CGY ATT GA-3’ (forward), and 5’-TGI ARY TGY TCR AYI AGG TA-3’ (reverse). Amplification was done in a Bio-Rad I-Cycler programmed for an initial hotstart at 95◦C for 15 min followed by a touchdown PCR containing 20
cy-cles of denaturation at 94◦C for 30 s, annealing at 60◦C for 30 s and elongation at 72◦C for 30 s, and 35 additional cycles with annealing at 45◦C. The run was terminated by
15
7 min incubation at 72◦C. Amplicons were separated on a 2% agarose gel, and bands
excised from the gel and sequenced according to standard procedures. Analysis of DNA sequences was carried out by alignment to the closest relative in the GenBank database using TBLASTX (Altschul et al., 1990). The obtained sequences have been submitted to GenBank with accession numbers as given in Table 1.
20
3 Results
3.1 Viral populations detected by flow cytometry
Using flow cytometry a total of five different viral populations were detected (Fig. 1). Three of these populations had similar SSC signals but were discriminated by differ-ences in green fluorescence signal, and are in the following referred to as low
fluo-25
BGD
4, 3961–3985, 2007 Marine phytoplankton viruses at elevated CO2 J. B. Larsen et al. Title Page Abstract Introduction Conclusions References Tables Figures ◭ ◮ ◭ ◮ Back CloseFull Screen / Esc
Printer-friendly Version Interactive Discussion
EGU (HFV). One population exhibited SSC and green fluorescence intensities like those
of previously detected EhV from similar samples (e.g. Jacquet et al., 2002; Martinez-Martinez et al., 2006) and of previously isolated EhV (Castberg et al., 2002). Moreover, EhV isolated from these samples displayed equal signals (own observations), and this population is thus denoted EhV. A fifth virus group, recognized by having substantially
5
higher SSC and green fluorescence than any of the other four groups, is called PLV (pu-tative large virus). Although viruses with genome sizes larger than the smallest known bacterial species have been isolated (Jacobsen et al., 1996; Sandaa et al., 2001; La Scola et al., 2003), these high fluorescence and SSC signals could be interpreted as a population of a single small bacteria species. We consider it more likely to represent a
10
large virus, however, as the clearly defined size group is typical that of viral populations (own observations).
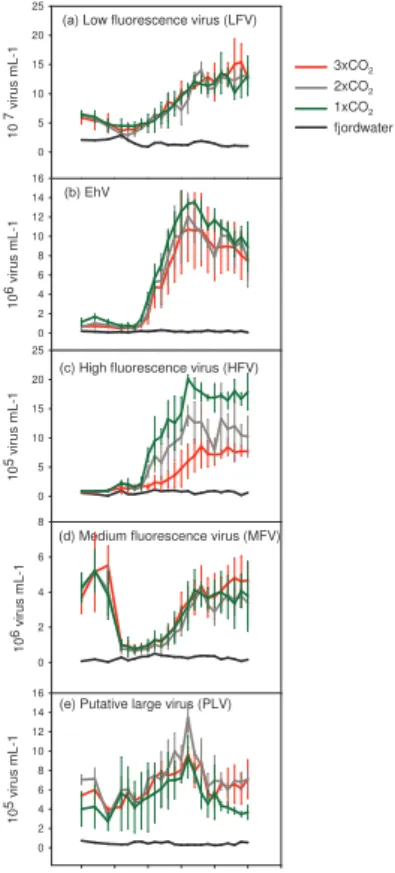
All the five virus groups reached concentrations considerably higher than what we observed in the fjord water (Fig. 2), and as such a response to increased primary and bacterial productivity caused by the nutrient addition was evident for all viral
popula-15
tions. The dynamics of LFV, EhV and HFV all followed a similar pattern with low initial concentrations followed by substantial increases from day 5–10, after which they re-mained at high concentrations throughout the experiment. LFV increased from ∼4×10⁷ on day 6 to ∼1.4×10⁸ virus mL−1 at the end of the experiment (Fig. 2a), and EhV and HFV increased from background levels to ∼1.1–1.4×10⁷ viruses mL−1 and 0.9–
20
2.0×10⁶ viruses mL−1, respectively (Fig. 2b, c). MFV and PLV showed a different development (Fig. 2d, e) in that both were found at elevated concentrations compared to fjord water already from day 0 (MFV: ∼5.5×10⁶mL−1, PLV: ∼4–7.0×10⁵mL−1). The
concentration of MFV declined abruptly to ∼1.0×10⁶viruses mL−1 on day 4–6 before increasing on day 12–18 to ∼4.5×10⁶ viruses mL−1 and then remained at this
con-25
centration for the rest of the experiment. A small decline in PLV concentration was observed around day 2–4, it then increased from day 8 on, reaching a maximum con-centration around 1–1.5×10⁶ml−1on day 16 before declining to initial levels at the end of the experiment.
BGD
4, 3961–3985, 2007 Marine phytoplankton viruses at elevated CO2 J. B. Larsen et al. Title Page Abstract Introduction Conclusions References Tables Figures ◭ ◮ ◭ ◮ Back CloseFull Screen / Esc
Printer-friendly Version Interactive Discussion
EGU The effect of the CO2manipulation was significant and consistent for HFV (Fig. 2c)
with higher maximum concentrations in the 1×CO2 enclosures (∼2.0×10 6
viruses ml−1, day 15) than in the 2×CO2and 3×CO2 ones (∼1.5×10
6
mL−1 (day 15) and 0.9×10⁶mL−1 (day 18), respectively). A similar but less pronounced CO2 effect was
observed for EhV with a slightly higher abundance in the 1×CO2 enclosures than in
5
the 2×CO2and 3×CO2enclosures (Fig. 2b). No clear effect of the CO2 manipulation
was seen for LFV, MFV and PLV (Fig. 2a, d, e).
3.2 Viral populations detected by pulsed field gel electrophoresis
A total of 21 viral populations, as defined by different genome sizes, could be identified on the PFGE gels (Fig. 3). Sixteen of the populations were common to all
meso-10
cosms (enclosure 2, enclosure 5, enclosure 8), while 5 (at ∼26, ∼105, ∼110, ∼137 and ∼440 kb) were observed in only one of the mesocosms.
In total seven large genome sized viruses (LGV: >250kb) were detected on the gels (Fig. 3). The largest genome size identified was ∼510 kb, correlating with the size of a previously isolated virus (CeV) infecting the prymnesiophyte Chrysochromulina ericina
15
(Sandaa et al., 2001). This band was excised and PCR-amplified using allele spe-cific primers, hereby verifying its origin as CeV. In the enclosure with the lowest CO2
concentration (M2) CeV was present from the initiation of the experiment, and it was observed in all three mesocosms from day 10. A virus population with a genome size around 410 kb, thus similar in size to a previously isolated virus (EhV) infecting
Emil-20
iania huxleyi (Castberg et al., 2002), was present in all three mesocosms from day 7–8 to the end of the experiment. The origin of this band was identified as EhV by DNA extraction and allele specific PCR amplification using primers targeting the major capsid protein. A population of viruses with a genome size of ∼270 kb was present in two of the mesocosms (1×CO2and 2×CO2) at the initiation of the experiment. It
dis-25
appeared but reappeared in all three mesocosms from day 7–10 (Fig. 3). A population of large dsDNA viruses with a genome size ∼440 kb, only observed in mesocosm 5
BGD
4, 3961–3985, 2007 Marine phytoplankton viruses at elevated CO2 J. B. Larsen et al. Title Page Abstract Introduction Conclusions References Tables Figures ◭ ◮ ◭ ◮ Back CloseFull Screen / Esc
Printer-friendly Version Interactive Discussion
EGU (2×CO2) (Fig. 3), appeared at day 10 and was present throughout the experiment. We
sporadically observed three other large virus genomes with sizes 254, 320 and 360 kb (Fig. 3).
A population maximum of five different viruses with medium sized genomes (MGV: 150–250 kb) was observed on the PFGE gels (Fig. 3). Their genome sizes were
esti-5
mated to 150, 169, 180, 210, and 234 kb. Most of these viruses were present at the initiation of the experiment, but tended to disappear after the first few days before reoc-curring again around day 7–10. PCRs using primers targeting the cyanophage psbD gene indicated the presence of cyanophages within this viral size group.
The most abundant group of viruses as determined by the intensity of the bands
10
on the PFGE gel, was the group of small genome sized dsDNA viruses (SGV: 0– 150 kb) (Fig. 3). Nine different genome sizes could be observed in this group during the course of the experiment, most being present from the initiation of the experiment and throughout (Fig. 3).
3.3 Viral identification by PCR using degenerated primers
15
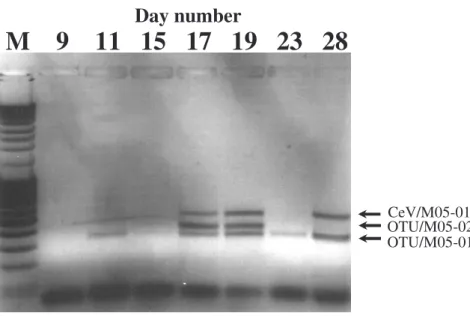
We have previously designed PCR primers targeting the major capsid protein gene se-quence of a clade of the Phycodnaviridae including the genera Chloroviruses, Raphi-doviruses and Prymnesioviruses (own unpublished work). By employing these primers on viral concentrates from all three mesocosms at various time points of the exper-iment, we produced three different amplicons of sizes 347 bp, 407 bp, and 518 bp
20
(Fig. 4). The amplified DNA fragments were sequenced and the 518 bp amplicon dis-played a 100% homology to previously isolated CeV (infecting C. ericina) (Sandaa et al., 2001), and is therefore in the following called CeV/5/2005. Sequencing of the two other amplicons followed by a TBLASTX search, gave highest similarity score to members of the Chlorovirus genus for the product at 347 bp (Fig. 4, OTU/05-01) with
25
highest similarity to the Chlorella viruses NY2A and AR158 (Table 1). The product at 407 bp (Fig. 4, OTU/05-02) showed highest similarity to the Heterosigma akashiwo infecting virus, HaV-1, and to the Mimivirus when comparing the aminoacid sequence
BGD
4, 3961–3985, 2007 Marine phytoplankton viruses at elevated CO2 J. B. Larsen et al. Title Page Abstract Introduction Conclusions References Tables Figures ◭ ◮ ◭ ◮ Back CloseFull Screen / Esc
Printer-friendly Version Interactive Discussion
EGU of the translated amplicon (Table 1). Each of the three amplicons was identified in the
concentrate from all three pCO2setups.
4 Discussion
4.1 Identification of viral populations
Flow cytometry, PFGE and PCR were applied to monitor the viral community during
5
the experiment. The great advantage of the flow cytometer is its ability to handle great quantities of viral samples with accuracy within reasonable time (Marie et al., 1999; Larsen et al., 2001; Li and Dickie, 2001; Jacquet et al., 2002; Larsen et al., 2004; Bau-doux et al., 2006; Martinez-Martinez et al., 2006). It is therefore especially valuable when following the temporal development of various viral populations. The qualitative
10
virus information is limited, however, and out of five different FCM-populations (LFV, MFV, HFV, EhV, PLV) only EhV, with its characteristic flow cytometry signature, could be identified (Castberg et al., 2001; Jacquet et al., 2002; Wilson et al., 2002; Martinez-Martinez et al., 2006). Some published works (Baudoux and Brussaard, 2005; Bau-doux et al., 2006) and our own experience with cultivated viruses (unpublished) show
15
that several large dsDNA algal virus have high green fluorescence signal when stained with SYBR Green I and gives a signal comparable to HFV in the current investigation. On the basis of the ratio between bacteria and viruses of the LFV group (often ≈1:10) it has previously been assumed that the majority of the LFV are bacteriophages (Marie et al., 1999; Wommack and Colwell, 2000; Castberg et al., 2001; Larsen et al., 2001;
20
Zhong et al., 2002; Larsen et al., 2004). This assumption is reasonable also for the cur-rent investigation as heterotrophic bacteria were found in concentrations around 1/10 that of LFV and their dynamics were comparable (Paulino et al., 2007). FCM can in other words give us a coarse idea of the viral community composition, but the difference in fluorescence signal between the various viruses are often subtle and FCM alone is
25
BGD
4, 3961–3985, 2007 Marine phytoplankton viruses at elevated CO2 J. B. Larsen et al. Title Page Abstract Introduction Conclusions References Tables Figures ◭ ◮ ◭ ◮ Back CloseFull Screen / Esc
Printer-friendly Version Interactive Discussion
EGU PFGE provides information of the genome size distribution, and to a certain extent
concentration of specific populations within the viral community (Wommack et al., 1999; Steward et al., 2000; Larsen et al., 2001; Sandaa and Larsen, 2006). Genome size is an important character for establishing the identity of a virus and the PFGE data took us further in a qualitative description. Lately, this approach has been used in several
5
studies to explore the dynamics in the communities of dsDNA viruses in the marine environment (Steward et al., 2000; Castberg et al., 2001; Larsen et al., 2001; Riemann and Middelboe, 2002; Jiang et al., 2003; Ovreas et al., 2003; Larsen et al., 2004; Sandaa and Larsen, 2006). These studies have shown that the viral assemblage in the marine environment is distributed in a genome size range from approximately 20
10
to 560 kb, and that the most dominant populations have genome sizes between 20 and 100 kb which is also the size range of most cultured marine bacteriophages with dsDNA genomes (Ackermann and DuBow, 1987; Jiang et al., 2003). Our PFGE results demonstrated that viral populations from 26 kb to 137 kb (SGV) were present in high concentrations during the entire experiment, with a dynamic similar to LFV. As such, it
15
is plausible that the majority of SGV as well as LFV, consists mainly of bacteriophages. Cultured cyanophages infecting Synechococcus are reported in the size range from 100–200 kb (Mann, 2003), and the presence of cyanophages in the MGV fraction (150– 234 kb) was verified by amplifying excised gel fragments from this part of the PFGE gels using PCR primers targeting the cyanophage psbD gene (Clokie, 2006).
More-20
over, the intensity of the bands in this region on the PFGE gel showed a similar trend to that observed for Synecoccocus spp. (Paulino et al., 2007), with a higher concen-tration compared to the fjord water at the initiation of the experiment, followed by a drop and reappearance of multiple bands around day 16. The dynamic of MFV (de-termined by FCM) followed the same trend, and it is therefore tempting to argue that
25
both MGS and MFV contain cyanophages. It should be noted, however, that also a larger virus (270 kb) and other phytoplankton host groups (picoeukaryotes) displayed a similar dynamic (see below).
BGD
4, 3961–3985, 2007 Marine phytoplankton viruses at elevated CO2 J. B. Larsen et al. Title Page Abstract Introduction Conclusions References Tables Figures ◭ ◮ ◭ ◮ Back CloseFull Screen / Esc
Printer-friendly Version Interactive Discussion
EGU genomes >300 kb (Brussaard, 2004; Dunigan et al., 2006). Seven distinct populations
within this size category (LGV) were revealed by the use of PFGE and four of these were genetically identified by allele specific or degenerated PCR primers. One was identified as EhV by combining expected genome size (≈410 kb) with allele specific amplification of DNA extracted from the bands observed on the PFGE gels. The
dy-5
namic observed by the intensities of bands confirm the dynamic of EhV with a peak somewhat delayed compared to that of the host (Paulino et al., 2007), which is also consistent with previous works showing increased viral concentrations after extensive mortality of E. huxleyi (Bratbak et al., 1993; Castberg et al., 2001; Larsen et al., 2001; Schroeder et al., 2003; Martinez-Martinez et al., 2006). LGV populations at 510 kb
10
and 440 kb were also revealed by PFGE. One of these was identified as CeV by allele specific PCR-amplification of the band at 510 kb. CeV appeared in high concentrations from day 15 coincidentally with crashes in nanoplankton populations, the phytoplank-ton group to which C. ericina belongs (Paulino et al., 2007). The presence of CeV in the mesocosms was further confirmed by an amplicon obtained and sequenced using
15
degenerated primers, and the sequence showed 100% homology to a CeV isolated from the same area in 2001 (Sandaa et al., 2001). The 440 kb virus showed a similar temporal pattern to that of CeV. The exact identity of this band on the PFGE gel was not, however, tested with allele specific primers. The temporal development of both CeV and the 440 kb-virus is comparable to that of HFV as determined by FCM and
20
we suggest that large dsDNA viruses infecting algae constitute a major part of HFV. A fourth large dsDNA virus (270 kb) had a temporal appearance similar to that observed for MFV with high initial concentrations, a sharp decrease and a subsequent substan-tial increase. As such, it is possible that at least some of the viruses within MFV were the same as those giving rise to the 270 kb band on the pulsed field gel. The dynamic
25
of the 270 kb-virus/MFV basically follows that of picoeukaryotes and to a certain ex-tent Synechococcus (Paulino et al., 2007). As MFV concentrations were an order of magnitude (1/10) that of picoeukaryotes and Synechococcus, it is therefore tempting to suggest that the 270 kb-virus/MFV infected members of these two phytoplankton
BGD
4, 3961–3985, 2007 Marine phytoplankton viruses at elevated CO2 J. B. Larsen et al. Title Page Abstract Introduction Conclusions References Tables Figures ◭ ◮ ◭ ◮ Back CloseFull Screen / Esc
Printer-friendly Version Interactive Discussion
EGU groups.
Genome sequencing of isolated viruses assigned to the Phycodnaviridae, have in-dicated high diversity within the family. Only nine core genes have been found to be shared in the currently sequenced genomes of Phycodnaviridae, and extensive dif-ferences in gene content exist even among members belonging to the same genus
5
(Van Etten et al., 2002; Delaroque et al., 2003). Using degenerated primers target-ing the major capsid protein, we were capable of extracttarget-ing DNA sequences from at least three different viruses. Interestingly, one of these was found to contain a 100% homologue DNA sequence to a previously isolated virus infecting C. ericina, isolated from field samples four years earlier (Sandaa et al., 2001) The occurrence of
con-10
served sequences seemingly present over a period of years, suggest a high evolution-ary pressure on this particular region or gene, beyond what could be expected from the generally short turnover time of viruses. Therefore, although the diversity of the gene content might be high within this family, the phylogenetic evolution might be consider-ably more constrained for the major capsid protein gene in a genus of these viruses
15
(Tidona et al., 1998). Besides the obtained product identical to CeV, two other pu-tative Phycodnaviridae viruses were identified using degenerated PCR primers. One virus had a sequence closest in similarity to members of the Chloroviruses, whereas a second isolate showed strongest homology to the HaV-1 and Mimivirus (Table 1). The similarity to the Mimivirus is interesting in view of the fact that this virus previously
20
have been assigned to a new family, the Mimiviridae, whose closest match was found in metagenome libraries from the Sargasso Sea (Ghedin and Claverie, 2005).
4.2 CO2effect on viral populations
The PFGE data revealed absence/presence of some viral populations as response to changed pCO2levels with one SGV and one LGV (110 kb and 440 kb) being observed
25
exclusively at 3×CO2, two SGVs (105 kb and 137 kb) solely at 1×CO2, and two other
SGVs (26 kb and 70 kb) at the 2× and 3×CO2only. The PFGE analysis were performed
en-BGD
4, 3961–3985, 2007 Marine phytoplankton viruses at elevated CO2 J. B. Larsen et al. Title Page Abstract Introduction Conclusions References Tables Figures ◭ ◮ ◭ ◮ Back CloseFull Screen / Esc
Printer-friendly Version Interactive Discussion
EGU closure 8), and only a few of the populations were identified and connected to specific
hosts. These results can therefore no more than indicate that CO2 conditions in the ocean might affect viral production. We did, however, observe a negative quantitative response to increased pCO2 for EhV and HFV through the flow cytometric analyses.
Increased CO2 levels led to a small increase in E. huxleyi abundance (Paulino et al.,
5
2007). The reduced EhV concentrations can therefore not be explained by an increase in host cells, but as a result of decreased burst size of the virus, possibly caused by biochemical changes in the host, or to impaired viral attachment at elevated CO2 con-centrations. One might think that changes in the calcite shell of E. huxleyi will interfere with viral attachment as it has earlier been suggested that the coccoliths of E. huxleyi
10
may serve as protection against viral attack (Young, 1994). The current results, how-ever, indicate that a possible abnormal coccolith formation, which has previously been demonstrated as an effect of increased pCO2 (Riebesell et al., 2000), does not result
in increased viral production, but rather the opposite.
The reduction in viral production with increasing CO2levels was even more obvious
15
for HFV than for EhV. The phytoplankton groups assumed to host HFV (nanoeukary-otes) did not exhibit a dynamic that can explain such a reduction as the abundance of all nanoeukaryotic groups increased slightly with increasing CO2levels (Paulino et al.,
2007). The reduced viral production therefore seems to be connected to changes in viral replication conditions. HFV is however, as argued above, most likely a composite
20
group of several dsDNA viruses infecting various nanoeukaryotic algae. This may have masked effects that could have been discovered if we were able to couple one specific host with its specific virus to a greater extent. It should also be taken into account that small differences in host abundances, not detectable by the methods used here, will be reinforced through the multiplication of viruses taking place in every host cell.
25
We have earlier argued that both LFV and MFV consist of bacterio- and cyanophages. The lack of effects of the CO2 manipulation observed for these groups
may thus be due the fact that changes in pCO2levels has a different effect on bacterial
BGD
4, 3961–3985, 2007 Marine phytoplankton viruses at elevated CO2 J. B. Larsen et al. Title Page Abstract Introduction Conclusions References Tables Figures ◭ ◮ ◭ ◮ Back CloseFull Screen / Esc
Printer-friendly Version Interactive Discussion
EGU However, also LFV and MFV do, as HFV, probably consist of several different viruses
and the argument of a masked effects that could have been detected with further de-veloped detection tools, is applicable also for these populations.
We have here demonstrated the possibility of identifying several dsDNA algal viral populations from environmental samples, and partially connect them to specific host
5
populations. It is obvious, however, that there is a great need for a continued effort to develop molecular markers that can be used to identify both viruses and their host. It is also apparent that such identification will help us to a better understanding of the effect that environmental factor, like altered CO2and/or nutrient conditions, may have on the
lower part of the pelagic food web.
10
Acknowledgements. The staff at the Marine Biological Station, University of Bergen, in
par-ticular T. Sørlie and A. Aadnesen, and the Bergen Marine Research infrastructure (RI) are gratefully ackowledged for support in mesocosm logistics. The research was partly funded by the project “Biodiversity patterns: Blooms versus stable coexistence in the lower part of the marine pelagic food web” (Research Council of Norway, 158936/I10).
15
References
Ackermann, H.-W. and DuBow, M. S.: Viruses of prokaryotes, CRC Press Inc., Boca Raton, FL., 1987.
Altschul, S., Gish, W., Miller, W., Myers, E., and Lipman, D.: Basic local alignment search tool, J. Mol. Biol., 215, 403–410, 1990.
20
Baudoux, A. C. and Brussaard, C. P.: Characterization of different viruses infecting the marine harmful algal bloom species Phaeocystis globosa, Virology, 341, 80–90, 2005.
Baudoux, A. C., Noordeloos, A. A. M., Veldhuis, M. J. W., and Brussaard, C. P. D.: Virally induced mortality of Phaeocystis globosa during two spring blooms in temperate coastal waters, Aq. Microb. Ecol., 44, 207–217, 2006.
25
Bratbak, G., Egge, J. K., and Heldal, M. Viral mortality of the marine algae Emiliania huxleyi (Haptophyceae) and termination of algal blooms. Mar. Ecol. Progr. Ser., 93, 39–48, 1993 Breitbart, M., Miyake, J. H. , and Rohwer, F.: Global distribution of nearly identical
BGD
4, 3961–3985, 2007 Marine phytoplankton viruses at elevated CO2 J. B. Larsen et al. Title Page Abstract Introduction Conclusions References Tables Figures ◭ ◮ ◭ ◮ Back CloseFull Screen / Esc
Printer-friendly Version Interactive Discussion
EGU
Brussaard, C. P.: Viral control of phytoplankton populations–a review, J Eukaryot. Microbiol., 51, 125–138, 2004.
Castberg, T., Larsen, A., Sandaa, R. A., Brussaard, C. P. D., Egge, J., Heldal, M., Thyrhaug, R., van Hannen, E. J., and Bratbak, G.: Microbial population dynamics and diversity during a bloom of the marine coccolithoporid Emiliania huxleyi (Haptophyta), Mar. Ecol. Prog. Ser.,
5
221, 39–46, 2001.
Castberg, T., Thyrhaug, R., Larsen, A., Sandaa, R. A., Heldal, M., Van Etten, J. L., and Bratbak, G.: Isolation and characterization of a virus that infects Emiliania huxleyi (Haptophyta) J. Phycol., 38, 767–774, 2002.
Clokie, M., A. D. Millard, J. Y. Mehta and N. H. Mann: Virus isolation studies suggest short-term
10
variations in abundance in natural cyanophage populations of the Indian Ocean, J. Mar. Biol. Ass. , 86, 499–505, 2006.
Delaroque, N., Boland, W., Muller, D. G., and Knippers, R.: Comparisons of two large phaeovi-ral genomes and evolutionary implications, J. Mol. Evol., 57, 613–622, 2003.
Dunigan, D. D., Fitzgerald, L. A., and Van Etten, J. L.: Phycodnaviruses: A peek at genetic
15
diversity, Virus Res., 117, 119–132, 2006.
Fil `ee, J. F. T., Suttle, C. A., and Krisch, H. M.: Marine T4-type bacteriophages, a ubiquitous component of the dark matter of the biosphere, PNAS, 102, 12 471–12 476, 2005.
Fuhrman, J. A.: Marine viruses and their biogeochemical and ecological effects, Nature, 399, 541–548, 1999.
20
Fuhrman, J. A. and Schwalbach, M.: Viral influence on aquatic bacterial communities, Biol. Bull., 204, 192–195, 2003.
Ghedin, E. and Claverie, J. M.: Mimivirus relatives in the Sargasso Sea, Virol. J., 2, 62–67, 2005.
Hewson, I., Vargo, G. A., and Fuhrman, J. A.: Bacterial diversity in shallow oligotrophic marine
25
benthos and overlying waters: Effects of virus infection, containment, and nutrient enrich-ment, Microb. Ecol., 46, 322–336, 2003.
Hewson, I. and Fuhrman, J. A.: Viral impacts upon marine bacterioplankton assemblage struc-ture, J. Mar. Biol. Ass., 86, 577–589, 2006.
Hewson I., Winger D. M., Williamson, K. E., Fuhrman, J. A., and Wommack, K. E.,: Viral and
30
bacterial assemblage covariance in oligotrophic waters of the West Florida Shelf (Gulf of Mexico), J. Mar. Biol. Ass. , 86, 591–603, 2006.
BGD
4, 3961–3985, 2007 Marine phytoplankton viruses at elevated CO2 J. B. Larsen et al. Title Page Abstract Introduction Conclusions References Tables Figures ◭ ◮ ◭ ◮ Back CloseFull Screen / Esc
Printer-friendly Version Interactive Discussion
EGU
Phaeocystis phouchetii (Prymnesiophyceae), J. Phycol., 32, 923–927, 1996.
Jacquet, S., Heldal, M., Iglesias-Rodriguez, D., Larsen, A., Wilson, W. H., and Bratbak, G.: Flow cytometric analysis of an Emiliania huxleyi bloom terminated by viral infection, Aq. Microb. Ecol., 27, 111–124, 2002.
Jiang, S., Fu, W., Chu, W., and Fuhrman, J. A.: The vertical distribution and diversity of marine
5
bacteriophage at a station off Southern California, Microb. Ecol., 45, 399–410, 2003. La Scola, B., Audic, S., Robert, C., Jungang, L., de Lamballerie, X., Drancourt, M., Birtles, R.,
Claverie, J. M., and Raoult, D.: A giant virus in amoebae, Science, 299, 2033, 2003.
Larsen, A., Castberg, T., Sandaa, R. A., Brussaard, C. P. D., Egge, J., Heldal, M., Paulino, A., Thyrhaug, R., van Hannen, E. J., and Bratbak, G.: Population dynamics and diversity
10
of phytoplankton, bacteria and viruses in a seawater enclosure, Mar. Ecol. Prog. Ser., 221, 47–57, 2001.
Larsen, A., Flaten, G. A. F., Sandaa, R. A., Castberg, T., Thyrhaug, R., Erga, S. R., Jacquet, S., and Bratbak, G.: Spring phytoplankton bloom dynamics in Norwegian coastal waters: Microbial community succession and diversity, Limnol. Oceanogr., 49, 180–190, 2004.
15
Li, W. K. W. and Dickie, P. M.: Monitoring phytoplankton, bacterioplankton, and virioplankton in a coastal inlet (Bedford basin) by flow cytometry, Cytometry, 44, 236–246, 2001.
Mann, N. H.: Phages of the marine cyanobacterial picophytoplankton, FEMS Microb. Rev., 27, 17–34, 2003.
Marie, D., Brussaard, C. P. D., Thyrhaug, R., Bratbak, G., and Vaulot, D.: Enumeration of
20
marine viruses in culture and natural samples by flow cytometry, Appl. Environ. Microbiol., 65, 45–52, 1999.
Martinez-Martinez, J., Norland, S., Thingstad, T. F., Schroeder, D. C., Bratbak, G., Wilson, W. H., and Larsen, A.: Variability in microbial population dynamics between similarly perturbed mesocosms, J. Pl. Res., 28, 783–791, 2006.
25
McNeil, B. I., Matear, R. J., Key, R. M., Bullister, J. L., and Sarmiento, J. L.: Anthropogenic
CO2 uptake by the ocean based on the global chlorofluorocarbon data set, Science, 299,
235–239, 2003.
Millard, A., Clokie, M. R. J., Shub, D. A., and Mann, N. H.: Genetic organization of the ps-bAD region in phages infecting marine Synechococcus strains, Proceedings of the National
30
Academy of Sciences of the United States of America, 101, 11 007–11 012, 2004.
Murray, A. G. and Jackson, G. A.: Viral dynamics: A model of the effects of size, shape, motion, and abundance of single-celled planktonic organisms and other particles, Mar. Ecol. Progr.
BGD
4, 3961–3985, 2007 Marine phytoplankton viruses at elevated CO2 J. B. Larsen et al. Title Page Abstract Introduction Conclusions References Tables Figures ◭ ◮ ◭ ◮ Back CloseFull Screen / Esc
Printer-friendly Version Interactive Discussion
EGU
Ser., 89, 103–116, 1992.
Ovreas, L., Bourne, D., Sandaa, R. A., Casamayor, E. O., Benlloch, S., Goddard, V., Smerdon, G., Heldal, M., and Thingstad, T. F.: Response of bacterial and viral communities to nutrient manipulations in seawater mesocosms, Aquat. Microb. Ecol., 31, 109–121, 2003.
Paulino, A. I., Larsen, A., and Egge, J.: Effects of increased atmospheric CO2 on small
5
and intermediate sized osmotrophs during a nutrient induced phytoplankton bloom, Biogeo-sciences Discuss., in press, 2007.
Riebesell, U., Zondervan, I., Rost, B., Tortell, P. D., Zeebe, R. E., and Morel, F. M.: Reduced
calcification of marine plankton in response to increased atmospheric CO2, Nature, 407,
364–367, 2000.
10
Riemann, L. and Middelboe, M.: Stability of bacterial and viral community compositions in danish coastal waters as depicted by DNA fingerprinting techniques, Aquat. Microb. Ecol., 27, 219–232, 2002.
Sandaa, R. A., Heldal, M., Castberg, T., Thyrhaug, R., and Bratbak, G.: Isolation and charac-terization of two viruses with large genome size infecting Chrysochromulina ericina
(Prymne-15
siophyceae) and Pyramimonas orientalis (Prasinophyceae), Virology, 290, 272–280, 2001. Sandaa, R. A. and Larsen, A.: Seasonal variations in virus-host populations in Norwegian
coastal waters: Focusing on the cyanophage community infecting marine Synechococcus spp., Appl. Environ. Microbiol., 72, 4610–4618, 2006.
Schroeder, D. C., Oke, J., Hall, M., Malin, G., and Wilson, W. H.: Virus succession observed
20
during an Emiliania huxleyi bloom, Appl. Environ. Microbiol., 69, 2484–2490, 2003.
Steward, G. F., Montiel, J. L., and Azam, F.: Genome size distributions indicate variability and similarities among marine viral assemblages from diverse environments, Limnol. Oceanog., 45, 1697–1706, 2000.
Sullivan, M. B. D. L., J. A. Lee, L. R. Thompson, J. P. Bielawski, S. W. Chisholm: Prevalence
25
and evolution of core photosystem II genes in marine cyanobacterial viruses and their hosts, PLoS Biol, 4, e234, 2006.
Suttle, C. A.: Viruses in the sea, Nature, 437, 356–361, 2005.
Thingstad, T. F. and Lignell, R.: Theoretical models for the control of bacterial growth rate, abundance, diversity and carbon demand, Aq. Microb. Ecol., 13, 19–27, 1997.
30
Thingstad, T. F.: Elements of a theory for the mechanisms controlling abundance, diversity, and biogeochemical role of lytic bacterial viruses in aquatic systems, Limnol. Oceanogr., 45, 1320–1328, 2000.
BGD
4, 3961–3985, 2007 Marine phytoplankton viruses at elevated CO2 J. B. Larsen et al. Title Page Abstract Introduction Conclusions References Tables Figures ◭ ◮ ◭ ◮ Back CloseFull Screen / Esc
Printer-friendly Version Interactive Discussion
EGU
Tidona, C. A., Schnitzler, P., Kehm, R., and Darai, G.: Is the major capsid protein of iridoviruses a suitable target for the study of viral evolution?, Virus Genes, 16, 59–66, 1998.
Van Etten, J. L., Graves, M. V., Muller, D. G., Boland, W., and Delaroque, N.: Phycodnaviridae– large DNA algal viruses, Arch. Virol., 147, 1479–1516, 2002.
Wilson, W. H., Tarran, G. A., Schroeder, D. C., Cox, M., Oke, J., and Malin, G.: Isolation of
5
viruses responsible for the demise of an Emiliania huxleyi bloom in the English Channel, J. Mar. Biol. Ass. UK, 82, 369–377, 2002.
Wilson, W. H., Schroeder, D. C., Allen, M. J., Holden, M. T., Parkhill, J., Barrell, B. G., Churcher, C., Hamlin, N., Mungall, K., Norbertczak, H., Quail, M. A., Price, C., Rabbinowitsch, E., Walker, D., Craigon, M., Roy, D., and Ghazal, P.: Complete genome sequence and lytic
10
phase transcription profile of a coccolithovirus, Science, 309, 1090–1092, 2005.
Wommack, K. E., Ravel, J., Hill, R. T., Chun, J., and Colwell, R. R.: Population dynamics of Chesapeake Bay virioplankton: Total-community analysis by pulsed-field gel electrophoresis, Appl. Environ. Microbiol., 65, 231–240, 1999.
Wommack, K. E. and Colwell, R. R.: Virioplankton: Viruses in aquatic ecosystems, Microbiol.
15
Mol. Biol. Rev., 64, 69–114, 2000.
Young, J. R.: Function of coccoliths: In Coccolithophores, ed. By a. Winter and w. G. Siesser. Cambridge university press, Cambridge., 1994.
Zhong, Y., Chen, F., Wilhelm, S. W., Poorvin, L., and Hodson, R. E.: Phylogenetic diversity of marine cyanophage isolates and natural virus communities as revealed by sequences of
20
BGD
4, 3961–3985, 2007 Marine phytoplankton viruses at elevated CO2 J. B. Larsen et al. Title Page Abstract Introduction Conclusions References Tables Figures ◭ ◮ ◭ ◮ Back CloseFull Screen / Esc
Printer-friendly Version Interactive Discussion
EGU Table 1. Sequences obtained using degenerated primers targeting the Major Capsid Protein
gene, and identified though TBLASTX search. Closest match are shown together with % iden-tical residues. The sequences have been submitted to genbank under the shown accession numbers.
Amplicon Seq length AA GenBank no. Closest match in Genbank Similarity
CeV/5/2005 172 EU006612 C. ericina CeV 100%
OTU/M05-01
115 EU086758 Chlorella virus NY2A (DQ491002.1)
Chlorella virus AR158 (DQ491003.1) 50% 49%
OTU/M05-02
135 EU086759 H. akashiwo HaV-1 (AB198422.1)
Mimivirus (AY653733.1)
49% 49%
BGD
4, 3961–3985, 2007 Marine phytoplankton viruses at elevated CO2 J. B. Larsen et al. Title Page Abstract Introduction Conclusions References Tables Figures ◭ ◮ ◭ ◮ Back CloseFull Screen / Esc
Printer-friendly Version Interactive Discussion EGU G re e n f lu o re s c e n c e Side Scatter HFV PLV EhV EhV MFV LFV G re e n f lu o re s c e n c e Side Scatter G re e n f lu o re s c e n c e Side Scatter HFV PLV EhV EhV MFV LFV
Fig. 1. Biparametric flow cytometric plots of viruses. Five different viral populations were
discriminated on basis of side scatter signal (SSC) vs green fluorescence signal after staining with SYBR green I: Low Fluorescence Firus (LFV), Medium Fluorescence Virus (MFV), High Fluroescencen Virus (HFV), Emiliania huxleyi Virus (EhV) and Putative Large Virus (PLV). For
further explanation see text. The current example is from a sample at day 15 from a 3×CO2
BGD
4, 3961–3985, 2007 Marine phytoplankton viruses at elevated CO2 J. B. Larsen et al. Title Page Abstract Introduction Conclusions References Tables Figures ◭ ◮ ◭ ◮ Back CloseFull Screen / Esc
Printer-friendly Version Interactive Discussion EGU (b) EhV 1 0 6 v ir u s m L -1 0 2 4 6 8 10 12 14 16
(c) High fluorescence virus (HFV)
1 0 5 v ir u s m L -1 0 5 10 15 20 25
(a) Low fluorescence virus (LFV)
1 0 7 v ir u s m L -1 0 5 10 15 20 25
(d) Medium fluorescence virus (MFV)
1 0 6 v ir u s m L -1 0 2 4 6 8
(e) Putative large virus (PLV)
day no. 0 5 10 15 20 25 30 1 0 5 v ir u s m L -1 0 2 4 6 8 10 12 14 16 3xCO2 2xCO2 1xCO2 fjordwater
Fig. 2. Temporal distribution of viral populations quantified using flow cytometry. Figure (a)
Low Fluorescence Viruses (LFV), (b) EhV (c) High Flourescence Viruses (HFV), (d) Medium Flourescence Viruses (MFV), and (e) Putative Large Virus (PLV). Each diagram shows a
virus population at present (1×CO2) and projected levels of atmospheric pCO2 in year 2100
(2×CO2), and in 2150 (3×CO2). Figures are average from three replicas, with error bars
BGD
4, 3961–3985, 2007 Marine phytoplankton viruses at elevated CO2 J. B. Larsen et al. Title Page Abstract Introduction Conclusions References Tables Figures ◭ ◮ ◭ ◮ Back CloseFull Screen / Esc
Printer-friendly Version Interactive Discussion EGU S G V : 0 -1 5 0 k b M G V : 1 5 0 -2 5 0 k b L G V : > 2 5 0 k b G e n o m e s iz e (k b )
Days after initiation of the experiment 0 4 7 8 9 10 11 13 17 19 21 510 440 410 360 320 270 254 234 210 180 169 150 137 110 105 95 70 63 50 38 26 3xCO2 (1050 µatm) 2xCO2 (700 µatm) 1xCO2 (350 µatm) S G V : 0 -1 5 0 k b M G V : 1 5 0 -2 5 0 k b L G V : > 2 5 0 k b G e n o m e s iz e (k b )
Days after initiation of the experiment 0 4 7 8 9 10 11 13 17 19 21 510 440 410 360 320 270 254 234 210 180 169 150 137 110 105 95 70 63 50 38 26 3xCO2 (1050 µatm) 2xCO2 (700 µatm) 1xCO2 (350 µatm)
Fig. 3. Virus genomes present in the mesocosms during the course of the experiment, as
investigated using Pulsed Field Gel Electrophoresis. The figure shows qualitative presence of virus bands at each of the days, for each of the three mesocosms tested (one mesocosm from
BGD
4, 3961–3985, 2007 Marine phytoplankton viruses at elevated CO2 J. B. Larsen et al. Title Page Abstract Introduction Conclusions References Tables Figures ◭ ◮ ◭ ◮ Back CloseFull Screen / Esc
Printer-friendly Version Interactive Discussion EGU
Day number
M 9 11 15 17 19 23 28
OTU/M05-01 OTU/M05-02 CeV/M05-01Fig. 4. Temporal diversity of viruses, investigated by amplification of a fragment of the viral
major capsid protein gene sequence using degenerated PCR primers. PCR was performed
with virus concentrate taken from a mesocosm subjected to a CO2concentration of 700 µatm
(2×CO2). Sequencing of the amplicons identified the top band at 518 bp as being homologue
to previously isolated CeV viruses, while the two smaller bands showed no homology to other viruses in the Genbank (TBLASTX). M – 100 bp ladder.


![[PDF] Apprendre la programmation Android avec base de données - Free PDF Download](data:image/gif;base64,R0lGODlhAQABAIAAAP///wAAACH5BAEAAAAALAAAAAABAAEAAAICRAEAOw==)