HAL Id: hal-00304151
https://hal.archives-ouvertes.fr/hal-00304151
Submitted on 9 May 2008HAL is a multi-disciplinary open access
archive for the deposit and dissemination of sci-entific research documents, whether they are pub-lished or not. The documents may come from teaching and research institutions in France or abroad, or from public or private research centers.
L’archive ouverte pluridisciplinaire HAL, est destinée au dépôt et à la diffusion de documents scientifiques de niveau recherche, publiés ou non, émanant des établissements d’enseignement et de recherche français ou étrangers, des laboratoires publics ou privés.
Determination of the evaporation coefficient of D2O
W. S. Drisdell, C. D. Cappa, J. D. Smith, R. J. Saykally, R. C. Cohen
To cite this version:
W. S. Drisdell, C. D. Cappa, J. D. Smith, R. J. Saykally, R. C. Cohen. Determination of the evap-oration coefficient of D2O. Atmospheric Chemistry and Physics Discussions, European Geosciences Union, 2008, 8 (3), pp.8565-8583. �hal-00304151�
ACPD
8, 8565–8583, 2008 The evaporation coefficient of D2O W. S. Drisdell et al. Title Page Abstract Introduction Conclusions References Tables Figures ◭ ◮ ◭ ◮ Back CloseFull Screen / Esc
Printer-friendly Version Interactive Discussion Atmos. Chem. Phys. Discuss., 8, 8565–8583, 2008
www.atmos-chem-phys-discuss.net/8/8565/2008/ © Author(s) 2008. This work is distributed under the Creative Commons Attribution 3.0 License.
Atmospheric Chemistry and Physics Discussions
Determination of the evaporation
coefficient of D
2
O
W. S. Drisdell1,2, C. D. Cappa3, J. D. Smith2, R. J. Saykally1,2, and R. C. Cohen1,4 1
Department of Chemistry, UC Berkeley, Berkeley, CA, USA
2
Chemical Sciences Division, Lawrence Berkeley National Laboratory, 94720 Berkeley, CA, USA
3
Department of Civil and Environmental Engineering, UC Davis, Davis, CA, USA
4
Department of Earth and Planetary Science, UC Berkeley, Berkeley, CA, USA Received: 26 March 2008 – Accepted: 7 April 2008 – Published: 9 May 2008 Correspondence to: R. C. Cohen (rccohen@berkeley.edu)
ACPD
8, 8565–8583, 2008 The evaporation coefficient of D2O W. S. Drisdell et al. Title Page Abstract Introduction Conclusions References Tables Figures ◭ ◮ ◭ ◮ Back CloseFull Screen / Esc
Printer-friendly Version Interactive Discussion
Abstract
The evaporation rate of D2O has been determined by Raman thermometry of a droplet
train (12–15µm diameter) injected into vacuum (∼10−5torr). The cooling rate mea-sured as a function of time in vacuum was fit to a model that accounts for temperature gradients between the surface and the core of the droplets, yielding an evaporation
5
coefficient (γe) of 0.57±0.06. This is nearly identical to that found for H2O (0.62±0.09)
using the same experimental method and model, and indicates the existence of a ki-netic barrier to evaporation. The application of a recently developed transition-state theory (TST) model suggests that the kinetic barrier is due to librational and hindered translational motions at the liquid surface, and that the lack of an isotope effect is due
10
to competing energetic and entropic factors. The implications of these results for cloud and aerosol particles in the atmosphere are discussed.
1 Introduction
The evaporation and condensation rates of liquid water are of fundamental importance to many chemical, biological, and atmospheric processes. In particular, the formation
15
and growth rates of cloud and aerosol particles are, in principle, sensitive to both ki-netic and thermodynamic variables (Winkler et al., 2004). Clouds and aerosols have a cooling effect on the earth’s atmosphere due to scattering of solar radiation, al-though some aerosols (black carbon) have a warming effect (IPCC, 2007). Current cloud models vary widely in their predictions for the radiative effects of anthropogenic
20
emissions that affect the number and composition of particles on which cloud droplets condense (CCN) (IPCC, 2007; Laaksonen et al., 2005; McComiskey and Feingold, 2008; Lohmann et al., 2007). This variation is in part due to differing values for wa-ter evaporation and condensation kinetics and their relation to particle growth rates in these models (Laaksonen et al., 2005). Direct measurements of the microscopic rates
25
of evaporation and condensation of pure water vary over three orders of magnitude, 8566
ACPD
8, 8565–8583, 2008 The evaporation coefficient of D2O W. S. Drisdell et al. Title Page Abstract Introduction Conclusions References Tables Figures ◭ ◮ ◭ ◮ Back CloseFull Screen / Esc
Printer-friendly Version Interactive Discussion although recent measurements have narrowed the range to between 0.05–1 times the
gas kinetic limit (Eames et al., 1997; Marek and Straub, 2001). Some of the variation in older literature is likely due to impurities in or on the surface of the water samples used in the experiments; we note this fact hints that impurities will be important deter-minants of evaporation and condensation rates in mixed systems, a notion supported
5
by field measurements of droplet growth rates (Feingold and Chuang, 2002; Ruehl et al., 2008). It is generally accepted that condensation and evaporation occurring faster than 10% of the gas kinetic limit results in thermodynamic control over droplet growth while slower rates result in kinetic control over these growth rates (Chuang et al., 1997; Laaksonen et al., 2005).
10
The maximum condensation rate of a gas is generally expressed via the Hertz-Knudsen equation, derived from gas kinetic theory (Eames et al., 1997),
Jc,max = √ p
2πmkT, (1)
wherep is the vapor pressure above the liquid surface, m is the molecular mass, k is Boltzmann’s constant, and T is the temperature. At equilibrium, the evaporation
15
and condensation rates are equal; therefore the maximum evaporation rate can be expressed as
Jc,max = Je,max=
psat
√
2πmkT, (2)
wherepsatis the saturation vapor pressure. Since the activity of the pure liquid is unity,
this expression for the evaporation rate holds at all vapor pressures. However, not all
20
substances evaporate at the maximum rate (McFeely and Somorjai, 1972; Eames et al., 1997). Deviations from the maximum rate are treated by introducing the evaporation coefficient (γe) and the condensation coefficient, alternatively referred to as the mass
accommodation coefficient (αm): Je,obs = γeJe,max = γepsat √ 2πmkT (3) 25
ACPD
8, 8565–8583, 2008 The evaporation coefficient of D2O W. S. Drisdell et al. Title Page Abstract Introduction Conclusions References Tables Figures ◭ ◮ ◭ ◮ Back CloseFull Screen / Esc
Printer-friendly Version Interactive Discussion Jc,obs = αmJc,max = αmp √ 2πmkT (4)
The evaporation and mass accommodation coefficients, which have values between zero and one, must be equal due to detailed balance at equilibrium. The equality holds for non-equilibrium systems as long as the velocity distribution in the gas phase does not deviate significantly from a Boltzmann distribution, because a Boltzmann
distribu-5
tion is assumed in the derivation of Eq. (1). Indeed, theoretical treatments of conden-sation have shown little sensitivity to gas phase speeds selected from the Boltzmann distribution at room temperature, although the condensation probability lowers for very high speeds (∼1000 m/s) (Chakraborty and Zachariah, 2008).
In addition to insuring the absence of impurities, measuringγefor H2O is challenging
10
because the high vapor pressure makes it difficult to observe evaporation or conden-sation in isolation without significant contributions from the opposing term. In addition, knowledge of the liquid surface temperature is required, and evaporation results in cooling of the surface by as much as 3–4 K relative to the bulk (Ward and Stanga, 2001).
15
Our own experiments have made use of liquid jets and droplet streams with high vacuum (10−4torr) maintained around the fluid, such that evaporation occurs with neg-ligible accompanying condensation. This greatly simplifies the interpretation as com-pared with many other recent experiments. The liquid jets and droplets also provide a renewing surface, minimizing contamination issues. Measurements of isotopic ratios in
20
evaporation between 264 and 295 K showed thatγe<1 and that it varied with the H/D ratio in the liquid (Cappa et al., 2005). Using Raman thermometry we derived a precise value ofγefrom the temperature change associated evaporation of pure H2O, yielding
a value of 0.62±0.09 over a temperature range of 245–295 K (Smith et al., 2006). We interpreted the results of our prior experiments using a transition-state theory (TST)
25
model of liquid water evaporation (Cappa et al., 2007). The calculations indicated that the evaporation rate is primarily influenced by the intermolecular hindered translational and librational motions of molecules at the liquid surface.
ACPD
8, 8565–8583, 2008 The evaporation coefficient of D2O W. S. Drisdell et al. Title Page Abstract Introduction Conclusions References Tables Figures ◭ ◮ ◭ ◮ Back CloseFull Screen / Esc
Printer-friendly Version Interactive Discussion Here we describe the extension of our previous studies to droplet train
measure-ments ofγe of pure D2O. These measurements serve as a further test of the
micro-scopic theory of evaporation and of the reproducibility and precision of the methodol-ogy, providing a firm basis for future studies of the evaporation from mixtures of water with salts, oils or surfactants.
5
2 Method
Evaporation rates from liquid D2O in vacuum were determined by measuring the tem-perature change of evaporating droplets using Raman thermometry. The evaporation rate is deduced from the cooling rate and the well known heat of vaporization. The droplets were formed with a vibrating orifice aerosol generator (VOAG). The D2O used
10
in this study was obtained from Cambridge Isotope Laboratories, with a stated purity of 99.9%.
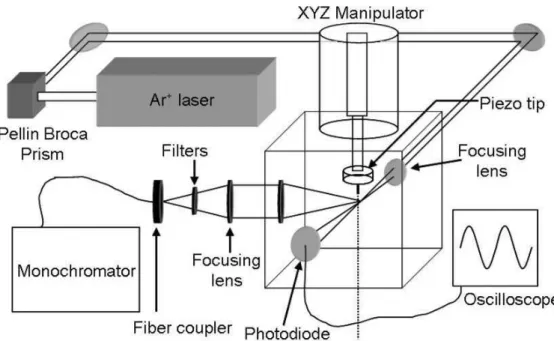
The Raman spectroscopy apparatus has been described in detail previously (Smith et al., 2006) and a schematic is given in Fig. 1. Briefly, a syringe pump (Teledyne ISCO Model 260D) is used to force the liquid through a fused silica orifice (2.5–4µm radius)
15
mounted on a piezoelectric ceramic. The silica orifice is generated by pulling 100µm ID silica tubing to the desired size with a commercial CO2 laser micropipette puller. The piezo is driven with a 0–20 V square wave at 200–1000 kHz to generate a uniform droplet train with a spread in radius of less than 0.1µm (Sayer et al., 2003). The radii of the droplets produced is calculated from the liquid flowrate and the oscillation
20
frequency (Smith et al., 2006).
The VOAG is mounted on a bellows attached to the top of a 7 cm cubical vacuum chamber pumped by a 110 liter/s turbomolecular pump. The VOAG as attached to an XYZ manipulator to allow positioning of the droplet stream. Pressures in the chamber during experiments were lower than 5×10⁻⁴torr. Viewports on the chamber allow the
25
introduction of the 514.5 nm line from an argon ion laser operating at ∼250 mW or less, which is focused onto the droplet train. Raman scatter from the droplets is filtered and
ACPD
8, 8565–8583, 2008 The evaporation coefficient of D2O W. S. Drisdell et al. Title Page Abstract Introduction Conclusions References Tables Figures ◭ ◮ ◭ ◮ Back CloseFull Screen / Esc
Printer-friendly Version Interactive Discussion collected at 90◦ through a fiber-optic cable and routed to a spectrometer with a liquid
nitrogen cooled CCD camera. After the droplets leave the interaction volume, they enter a liquid nitrogen trap located ∼50 cm from the nozzle. To ensure that the droplets are uniform in size, a photodiode is placed in the path of the laser, after it has crossed the droplet train. The photodiode signal and the modulation frequency are monitored
5
with an oscilloscope. As a droplet passes through the laser beam, there is a dip in signal on the photodiode; the oscillation frequency is tuned until the signal is sinusoidal in nature, indicating the formation of uniform droplets as described above.
The OD-stretching region of the Raman spectrum (2150–2800 cm−1) is used to de-termine the temperature of the droplets in a manner similar to that reported by Smith et
10
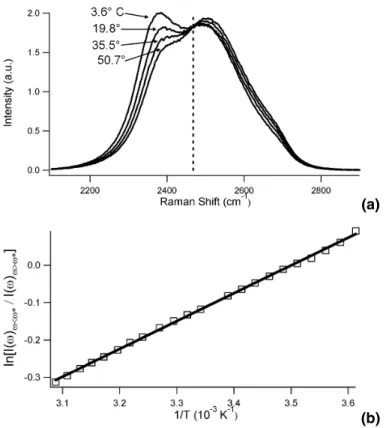
al. (2006). Calibration curves were collected using both the thermostated nozzle tech-nique described by Smith et al. (2006), and by measuring the total Raman scatter from liquid D2O in a cuvette over a similar temperature range (0–50◦C). The cuvette method was found to be more consistent (<2% deviation) compared to the jet method (∼5% de-viation) and has the additional advantage of requiring significantly smaller amounts of
15
liquid. Calibrations taken using the cuvette method were used for the bulk of the data. Examples of the spectra used to generate the temperature calibrations are shown in Fig. 2a and b shows one of the calibration curves.
Measurements were taken as a function of distance from the VOAG nozzle, which we converted to the residence time in the vacuum using the velocity of the droplet train.
20
This velocity is calculated from the liquid flowrate and the orifice size. As described pre-viously, the orifice size is determined by measuring the liquid jet diameter immediately after the nozzle using Mie scattering with the VOAG turned off (Cappa et al., 2005).
3 Results and analysis
Measurements for eight different droplet sizes with radii in the range between 5.3 µm
25
and 8.1µm were performed. Data were collected as a function of residence time in the vacuum chamber for maximum times ranging from 435µs to 1117 µs, with most around
ACPD
8, 8565–8583, 2008 The evaporation coefficient of D2O W. S. Drisdell et al. Title Page Abstract Introduction Conclusions References Tables Figures ◭ ◮ ◭ ◮ Back CloseFull Screen / Esc
Printer-friendly Version Interactive Discussion 600µs. This corresponds to a temperature range from 295 K to as low as 255 K. That
our measurements are taken in the free evaporation regime was verified by calculating the average number of collisions experienced by an evaporating molecule as it leaves the droplet surface and reaches an infinite distance:
Ncoll(r0, T ) = ∞ Z r0 dr λ(r, T ) = p 2πdcoll2 n(r0)r02 ∞ Z r0 dr r2 = r0 λ(r0, T ) , (5) 5
wherer0 is the droplet radius, λ(r0, T )=[
√
2πdcolln(r)]−1 is the mean free path of the
vapor, anddcoll is the collision diameter (2.6×10⁻¹⁰m). For D2O, the mean free path
predicted near the nozzle (with an expected vapor pressure of ∼7.5 torr) is ∼12 µm; thus molecules evaporating from droplets with radii less than 12µm experience less than one collision in the vapor phase on average and condensation may be neglected
10
(Smith et al., 2006).
We model the observed cooling as d T d t = −γeA psat √ 2πmkT ∆Hvap CpMd, (6)
where ∆Hvapis the enthalpy of vaporization (45.7 kJ/mol for D2O), Cp is the specific
heat capacity (84.67 J/mol*K for D2O), A is the surface area (4πr 2
0) andMd is the mass 15
of the liquid being cooled. Evaporation only occurs from the surface of the droplet, so this mass is only a fraction of the total droplet mass. We calculate the propagation of heat through the droplet numerically by dividing the droplet into concentric spherical shells, and do not assume instantaneous thermal equilibrium. The equation for cooling at the droplet surface is then
20 d T d t = −γe psat √ 2πmkT ∆Hvap Cp 3r02 (r03− r13)ρ1 , (7)
ACPD
8, 8565–8583, 2008 The evaporation coefficient of D2O W. S. Drisdell et al. Title Page Abstract Introduction Conclusions References Tables Figures ◭ ◮ ◭ ◮ Back CloseFull Screen / Esc
Printer-friendly Version Interactive Discussion wherer0andr1are the outer and inner radii of the outer shell of the droplet. The only
tunable parameter isγe. Thermal diffusion between adjacent shells is modeled as
d Q
d t = −κA d T
dr, (8)
whereκ is the thermal conductivity (0.595 W/m*K at 298 K for D2O),A is the surface
area of the shell andd T/dr is the temperature difference between the two adjacent
5
shells. As the outermost shell evaporates, mass loss due to evaporation is taken into account and all the shells are re-sized at each time step. The temperature gradient and the volume-averaged temperature of the entire droplet are calculated at each time step. As the entire droplet resides within the laser focal volume, we interpret the observed temperature as the volume-averaged temperature. We determineγe by fitting the ob-10
servations to the model represented by Eq. (7). We have considered three variations on the form ofγe, one whereγe is a constant with temperature and two where γe is
allowed to vary with temperature.
The model described above is essentially identical to that published previously (Smith et al., 2006). For completeness, a temperature-dependent equation for the
15
density of D2O from Kell (1967) and an empirical temperature- and density-dependent
equation for the thermal conductivity of D2O from the International Association for the
Properties of Water and Steam (Kestin, 2007) were both incorporated into the model. The inclusion of these temperature dependent values changedγeby less than 0.1%.
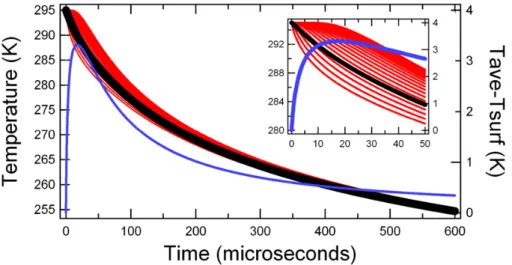
An example calculation is shown in Fig. 3. The figure shows the temperatures for
20
each of 20 spherical shells as a function of time, as well as the volume-averaged tem-perature for the entire 6.65µm droplet. The magnitude of the surface-bulk temperature difference in the droplet, defined as the difference between the outer shell temperature and the volume-averaged temperature of the droplet, is shown as the blue line. The maximum difference is 3 K during the initial 100 µs and drops below 1 K thereafter.
25
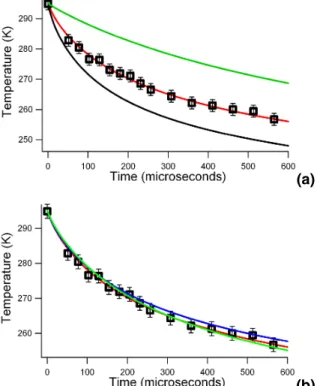
We tune γe in this model to fit observations of a 6.65µm droplet train, shown in Fig. 4a. For this particular experiment, a best fit (assuming zero temperature depen-dence ofγe) is obtained forγe=0.51. Eight different droplet sizes were measured. The
ACPD
8, 8565–8583, 2008 The evaporation coefficient of D2O W. S. Drisdell et al. Title Page Abstract Introduction Conclusions References Tables Figures ◭ ◮ ◭ ◮ Back CloseFull Screen / Esc
Printer-friendly Version Interactive Discussion average evaporation coefficient derived (95% confidence interval) is 0.57±0.06 where
we have assumed no temperature dependence. The theoretical cooling curve forγe=1,
also shown in Fig. 4a, yields much more rapid cooling than was observed. For compari-son, we have also included the model results using the temperature dependentγefrom Li et al. (2001), which increases from 0.17 at 295 K to 0.32 at 258 K (Li et al., 2001).
5
This predicts significantly less cooling than was observed. We have also fit two differ-ent temperature dependdiffer-ent functions to our data, as shown in Fig. 4b. These functions represent the maximum positive and negative temperature dependences consistent with the data. Using the temperature dependence described by Li et al. (2001), but ad-justed to give a largerγe at lower temperature than that measured by Li et al. (2001),
10
can be consistent with our observations if γe is equal to 0.4 at 295 K and to 0.6 at
258 K. An exponential temperature dependence of the form γe=ρ exp(−Ea/RT ) was
fit to the data, whereρ was constrained to be ≤1. The Ea for this case is 1.8 kJ/mol,
giving aγeof 0.48 at 295 K and 0.43 at 258 K. These ranges fall within the uncertainty
bounds of the temperature independent fit.
15
4 Discussion
The observed value ofγefor D2O is smaller than unity. The value is nearly identical to
that obtained recently for H2O (0.62±0.09) (Smith et al., 2006) The TST model study
by Cappa et al. (2007) predicts that H2O and D2O would have similar values of γe,
based on calculations of the absolute evaporation rates of the different isotopes as
20
a function of deuterium mole fraction in the liquid (Fig. 5 of that study), although the relative evaporation rates of the pure liquids was not explicitly calculated (Cappa et al., 2007). To determine whether an isotope effect is predicted, we calculated the ratio of γefor pure H2O to that for pure D2O using the following equation adapted from Cappa
ACPD
8, 8565–8583, 2008 The evaporation coefficient of D2O W. S. Drisdell et al. Title Page Abstract Introduction Conclusions References Tables Figures ◭ ◮ ◭ ◮ Back CloseFull Screen / Esc
Printer-friendly Version Interactive Discussion et al. (2007): rγ =γγe,H e,D = psat,D psat,H s mH mD Q∗ H Q∗ D QsD QsHe −∆Ea/kT, (9)
wherepsat is the saturation vapor pressure, m is the molecular mass, Q∗ and Qs are
the partition functions of the transition state and the liquid surface species, respectively, and ∆Ea is the difference in activation energies between the two isotopes. The sub-5
and superscripts H and D refer to H2O and D2O, respectively. By calculating the ratio
rγ we avoid several assumptions associated with calculating the absolute evaporation
rates of the isotopes, such as knowledge of the transition state area and the absolute magnitude of the activation energy (Cappa et al., 2007).
The observed ratio from experiment, rγ,exp, is 1.09±0.18. The calculated ratio rγ 10
from Eq. (9) was found to vary between 0.90 and 1.08 at 295 K, depending on the specific choices ofQ∗, Q
s, and ∆Ea given in Cappa et al. (2007). The smallest
iso-tope effect (rγ=1.02) was found using the values derived from the “scaled” surface
frequencies. These intermolecular translational and librational frequencies of the liquid surface species were scaled by a factor of
q
3/4 relative to the bulk frequencies to
15
better approximate the looser binding at the surface. At 265 K,rγ varies between 0.84 and 0.99, with the scaled frequencies yieldingrγ=0.94. This difference implies a very
weak temperature dependence to the relative values ofγe for the two isotopes. The
small isotope effect is due to a competing effect between the partition function ratios in the exponential pre-factor (entropy) and the activation energy difference in the
expo-20
nential. The results of our previous study of the evaporation of isotopic mixtures and the calculations by Cappa et al. (2007) suggests that these effects only balance each other for the pure liquids, and that γe for H2O and D2O in different isotopic mixtures can differ by as much as a factor of 3 (Cappa et al., 2005, 2007). It is important to note that the hindered translational frequencies for D2O are taken to be smaller than
25
those of H2O when comparing the pure solutions, as this plays an important role in
determiningrγ. The activation energy for D2O evaporation is predicted to be ∼2 kJ/mol
ACPD
8, 8565–8583, 2008 The evaporation coefficient of D2O W. S. Drisdell et al. Title Page Abstract Introduction Conclusions References Tables Figures ◭ ◮ ◭ ◮ Back CloseFull Screen / Esc
Printer-friendly Version Interactive Discussion higher than that for H2O, which is approximately the difference expected from zero point
energy effects. Therefore, this assessment remains valid if both H2O and D2O have
no energetic barrier to evaporation and the kinetic limit results entirely from entropic effects; however, a small energetic barrier is certainly possible. Recent measurements by Ward and Stanga showed a small (∼8◦C) temperature discontinuity between
evap-5
orating liquid H2O and the vapor (Ward and Stanga, 2001). Assuming that the higher
temperature in the vapor is due to an energetic barrier to evaporation, and using the specific heat capacity of the vapor (Cp=37.47 J mol−1K−1), the barrier size is predicted
to be very small (∼300 J/mol) for H2O. Our data provide a weak constraint on the size of
the barrier. The analysis above suggested the energetic barrier is less than 1.8 kJ/mol
10
for D2O.
Our value ofγe falls within the range of, but has much higher precision than, recent measurements by Winkler et al. (2004, 2006) and Voigtlander et al. (2007), both of which were condensation studies. Winkler et al. (2006) foundγeto be between 0.8–1.0
for temperatures between 250 and 270 K and 0.4–1.0 for temperatures between 270
15
and 290 K, and Voigtlander et al. (2007) foundγe to be between 0.3 and 1 for uptake on NaCl particles. Studies by Li et al. (2001) and Jakubczyk et al. (2007) find values that are, for the most part, higher than the 0.1 threshold below which cloud formation becomes kinetically controlled, but lower than our observed values and outside the uncertainties. Li et al. (2001) observed γe to increase from 0.17±0.03 at 285 K to 20
0.32±0.04 at 258 K, and Jakubczyk et al. (2007) observed γe to be between 0.054–
0.12 at temperatures between 277 and 298.3 K. While there is some debate in the literature about some of these experiments (Davidovits et al., 2005) there is not yet a satisfactory explanation for the differences.
Our reported value ofγe near 0.6 for D2O provides support for our previous results
25
for H2O, confirming thatγefor pure H2O is not small enough to imply a significant effect
on formation rates of cloud droplets in the atmosphere (Smith et al., 2006). There are other effects, however, that could lower these rates on ambient CCN, which are not pure H2O or D2O, such as the presence of concentrated solutes or surfactant coatings
ACPD
8, 8565–8583, 2008 The evaporation coefficient of D2O W. S. Drisdell et al. Title Page Abstract Introduction Conclusions References Tables Figures ◭ ◮ ◭ ◮ Back CloseFull Screen / Esc
Printer-friendly Version Interactive Discussion on the droplets. For example, the effects of dissolved salts on the vapor pressure of
liquid water have been extensively studied (MacMullin, 1969; Hornung and Giauque, 1955; Horita et al., 1992; Shmulovich et al., 1999), but the kinetic effects on the evap-oration coefficient are unknown. It has been argued that surface active solutes can lower the evaporation rate considerably, possibly leading to large changes inγe(Marek 5
and Straub, 2001). Many studies of the effect of surfactants on water evaporation in-dicate a dramatic lowering of the evaporation rate upon sufficient surface coverage by surfactant molecules (Lunkenheimer and Zembala, 1997; Rusdi and Moroi, 2004; Seaver et al., 1992). Additionally, recent molecular dynamics (MD) simulations of con-densation onto an aerosol particle coated with organics show a significantly lowered
10
condensation probability (Chakraborty and Zachariah, 2008). Given that CCN are of-ten composed of inorganic solutes as well as organics which might partition to the surface, measurements ofγe on these more complex mixtures will be important to im-proving microscopic models of cloud droplet growth rates, number and size. Indeed, a recent study sampling atmospheric aerosol from several different sites found that cloud
15
droplet growth rates were often consistent with values ofγe less than 0.1 (Ruehl et al., 2008), providing additional motivation for continued development of methods capable of precise determination ofγe.
5 Conclusions
We have determined the evaporation coefficient of D2O to be 0.57±0.06 using
Ra-20
man thermometry measurements on droplets undergoing evaporation in the absence of condensation. This value is the same, within experimental error, as that previously measured for H2O (Smith et al., 2006). Thus,γefor pure water is less than unity, but is
not small enough to have a significant impact on models for cloud formation and aerosol growth rates. A TST model for water evaporation (Cappa et al., 2007) is consistent with
25
both the H2O and D2O observations and indicates that the lack of an isotope effect is due to competing energetic and entropic effects. Further understanding of the source
ACPD
8, 8565–8583, 2008 The evaporation coefficient of D2O W. S. Drisdell et al. Title Page Abstract Introduction Conclusions References Tables Figures ◭ ◮ ◭ ◮ Back CloseFull Screen / Esc
Printer-friendly Version Interactive Discussion and magnitude of these effects and how they are affected by the presence of salts, oils
and surfactants will likely be important to understanding evaporation and condensation in mixed phase systems.
Acknowledgements. This work was supported by the Director, Office of Science, Office of Basic Energy Sciences, of the US Department of Energy under Contract No. DE-AC02-05CH11231. 5
References
Cappa, C. D., Drisdell, W. S., Smith, J. D., Saykally, R. J., and Cohen, R. C.: Isotope frac-tionation of water during evaporation without condensation, J. Phys. Chem. B, 109, 24 391– 24 400, 2005.
Cappa, C. D., Smith, J. D., Drisdell, W. S., Saykally, R. J., and Cohen, R. C.: Interpreting the h/d 10
isotope fractionation of liquid water during evaporation without condensation, J. Phys. Chem. C, 111, 7011–7020, 2007.
Chakraborty, P. and Zachariah, M. R.: Sticking coefficient and processing of water vapor on organic-coated nanoaerosols, J. Phys. Chem. A, 112, 966–972, 2008.
Chuang, P. Y., Charlson, R. J., and Seinfeld, J. H.: Kinetic limitations on droplet formation in 15
clouds, Nature, 390, 594–596, 1997.
Davidovits, P., Worsnop, D. R., Williams, L. R., Kolb, C. E., and Gershenzon, M.: Comment on “mass accommodation coefficient of water: Molecular dynamics simulation and revised analysis of droplet train/flow reactor experiment”, J. Phys. Chem. B, 109, 14 742–14 746, 2005.
20
Eames, I. W., Marr, N. J., and Sabir, H.: The evaporation coefficient of water: A review, Int. J. Heat Mass Tran., 40, 2963–2973, 1997.
Feingold, G. and Chuang, P. Y.: Analysis of the influence of film-forming compounds on droplet growth: Implications for cloud microphysical processes and climate, J. Atmos. Sci., 59, 2006– 2018, 2002.
25
Horita, J., Wesolowski, D. J., and Cole, D. R.: The activity-composition relationship of oxygen and hydrogen isotopes in aqueous salt solutions: I. Vapor-liquid water equilibration of single salt solutions from 50 to 100 c, Geochim. Cosmochim. Ac., 57, 2797–2817, 1992.
Hornung, E. W. and Giauque, W. F.: The vapor pressure of water over aqueous sulfuric acid at 25-degrees, J. Am. Chem. Soc., 77, 2744–2746, 1955.
ACPD
8, 8565–8583, 2008 The evaporation coefficient of D2O W. S. Drisdell et al. Title Page Abstract Introduction Conclusions References Tables Figures ◭ ◮ ◭ ◮ Back CloseFull Screen / Esc
Printer-friendly Version Interactive Discussion
Jakubczyk, D., Zientara, M., Kolwas, K., and Kolwas, M.: Temperature dependence of evapo-ration coefficient for water measured in droplets in nitrogen under atmospheric pressure, J. Atmos. Sci., 64, 996–1004, 2007.
Kell, G. S.: Precise representation of volume properties of water at 1 atmosphere, J. Chem. Eng. Data, 12, 66–69, 1967.
5
Kestin, J.: Revised release on viscosity and thermal conductivity of heavy water substance, International Association for the Properties of Water and Steam, 2007.
Laaksonen, A., Vesala, T., Kulmala, M., Winkler, P. M., and Wagner, P. E.: Commentary on cloud modelling and the mass accommodation coefficient of water, Atmos. Chem. Phys., 5, 461–464, 2005,
10
http://www.atmos-chem-phys.net/5/461/2005/.
Li, Y. Q., Davidovits, P., Shi, Q., Jayne, J. T., Kolb, C. E., and Worsnop, D. R.: Mass and thermal accommodation coefficients of H2O(g) on liquid water as a function of temperature, J. Phys. Chem. A, 105, 10 627–10 634, 2001.
Lohmann, U., Quaas, J., Kinne, S., and Feichter, J.: Different approaches for constraining 15
global climate models of the anthropogenic indirect aerosol effect, B. Am. Meteorol. Soc., 88, 243–249, 2007.
Lunkenheimer, K. and Zembala, M.: Attempts to study a water evaporation retardation by sol-uble surfactants, J. Colloid Interf. Sci., 188, 363–371, 1997.
MacMullin, R. B.: Algorithms for vapor pressure of water over aqueous solutions of salt and 20
caustic soda, J. Electrochem. Soc., 116, 416–419, 1969.
Marek, R. and Straub, J.: Analysis of the evaporation coefficient and the condensation coeffi-cient of water, Int. J. Heat Mass Tran., 44, 39–53, 2001.
McComiskey, A. and Feingold, G.: Quantifying error in the radiation forcing of the first aerosol indirect effect, Geophys. Res. Lett., 35, L02810, doi:10.1029/2007GL032667, 2008.
25
McFeely, F. R. and Somorjai, G. A.: Studies of vaporization kinetics of hydrogen-bonded liquids, J. Phys. Chem., 76, 914–918, 1972.
Ruehl, C. R., Chuang, P. Y., and Nenes, A.: How quickly do cloud droplets form on atmospheric particles?, Atmos. Chem. Phys., 8, 1043–1055, 2008,
http://www.atmos-chem-phys.net/8/1043/2008/. 30
Rusdi, M. and Moroi, Y.: Study on water evaporation through 1-alkanol monolayers by the thermogravimetry method, J. Colloid Interf. Sci., 272, 472–479, 2004.
Sayer, R. M., Gatherer, R. D. B., Gilham, R. J. J., and Reid, J. P.: Determination and validation
ACPD
8, 8565–8583, 2008 The evaporation coefficient of D2O W. S. Drisdell et al. Title Page Abstract Introduction Conclusions References Tables Figures ◭ ◮ ◭ ◮ Back CloseFull Screen / Esc
Printer-friendly Version Interactive Discussion
of water droplet size distributions probed by cavity enhanced raman scattering, Phys. Chem. Chem. Phys., 5, 3732–3739, 2003.
Seaver, M., Peele, J. R., Manuccia, T. J., Rubel, G. O., and Ritchie, G.: Evaporation kinetics of ventilated waterdrops coated with octadecanol monolayers, J. Phys. Chem., 96, 6389–6394, 1992.
5
Shmulovich, K. I., Landwehr, D., Simon, K., and Heinrich, W.: Stable isotope fractionation between liquid and vapour in water-salt systems up to 600 degrees c, Chem. Geol., 157, 343–354, 1999.
Smith, J. D., Cappa, C. D., Drisdell, W. S., Cohen, R. C., and Saykally, R. J.: Raman thermom-etry measurements of free evaporation from liquid water droplets, J. Am. Chem. Soc., 128, 10
12 892–12 898, 2006.
Voigtlander, J., Stratmann, F., Niedermeier, D., Wex, H., and Kiselev, A.: Mass accomodation coefficient of water: A combined computational fluid dynamics and experimental analysis, J. Geophys. Res., 112, D20208, doi:10.1029/2007JD008604, 2007.
Ward, C. A. and Stanga, D.: Interfacial conditions during evaporation or condensation of water, 15
Phys. Rev. E, 64, 051509-1–051509-9, 2001.
Winkler, P. M., Vrtala, A., Wagner, P. E., Kulmala, M., Lehtinen, K. E. J., and Vesala, T.: Mass and thermal accommodation during gas-liquid condensation of water, Phys. Rev. Lett., 93, 075701-1–075701-4, 2004.
Winkler, P. M., Vrtala, A., Rudolf, R., Wagner, P. E., Riipinen, I., Vesala, T., Lehtinen, K. E. 20
J., Viisanen, Y., and Kulmala, M.: Condensation of water vapor: Experimental determi-nation of mass and thermal accommodation coefficients, J. Geophys. Res., 111, D19202, doi:10.1029/2006JD007194, 2006.
ACPD
8, 8565–8583, 2008 The evaporation coefficient of D2O W. S. Drisdell et al. Title Page Abstract Introduction Conclusions References Tables Figures ◭ ◮ ◭ ◮ Back CloseFull Screen / Esc
Printer-friendly Version Interactive Discussion
Fig. 1. Experimental apparatus. The droplet train is positioned onto the focal point of the
514.5 nm line of the Ar+laser with an XYZ manipulator. Raman scatter is collected at 90◦into a
fiber coupler and routed to a monochromator (f/6.5) with a liquid nitrogen cooled CCD detector. A photodiode monitors the laser light attenuation after passing through the droplet train and is used in conjunction with an oscilloscope to ensure that uniform droplets are being produced. Spectra of the droplets as a function of time are taken by sampling at multiple points along the droplet stream, corresponding to liquid temperatures between 295 K and 255–260 K.
ACPD
8, 8565–8583, 2008 The evaporation coefficient of D2O W. S. Drisdell et al. Title Page Abstract Introduction Conclusions References Tables Figures ◭ ◮ ◭ ◮ Back CloseFull Screen / Esc
Printer-friendly Version Interactive Discussion
(a)
(b)
Fig. 2. (a) Representative spectra used to generate one of the temperature calibration curves.
The dashed line shows the frequency ω∗
=2468 cm−1 where the spectra were split. The full curve is constructed from spectra of liquid D2O at 22 different temperatures between 3.6◦C and
50.7◦C. (b) Representative temperature calibration curve.R2
ACPD
8, 8565–8583, 2008 The evaporation coefficient of D2O W. S. Drisdell et al. Title Page Abstract Introduction Conclusions References Tables Figures ◭ ◮ ◭ ◮ Back CloseFull Screen / Esc
Printer-friendly Version Interactive Discussion
Fig. 3. Representative model output for a 6.65µm radius droplet with γe of 0.57. The black line is the volume-averaged temperature, the blue line is the magnitude of the thermal gradient within the droplet (the difference between the outer shell temperature and the volume-averaged temperature), and the red lines are the temperatures of each shell. Absolute temperature is on the left axis and the magnitude of the temperature difference is on the right axis. The inset is an enlarged image of the first 50µs to depict the shell temperatures more clearly. The
volume-averaged temperature (black line) is the output that is fit to the experimental data. Note that the thermal gradient quickly drops below 1 K.
ACPD
8, 8565–8583, 2008 The evaporation coefficient of D2O W. S. Drisdell et al. Title Page Abstract Introduction Conclusions References Tables Figures ◭ ◮ ◭ ◮ Back CloseFull Screen / Esc
Printer-friendly Version Interactive Discussion
(a)
(b)
Fig. 4. (a) Experimental data for a droplet size of 6.65µm radius, shown with the model fit (red
line) toγe=0.51. The black line shows the model output for γe=1. The green line represents the
predicted cooling using the temperature dependentγefrom Li et al. (2001) (b) The same data, shown with the temperature independent fit forγe=0.51 (red line), a temperature dependent fit with the functional form from Li et al. (2001) (green line) whereγe increases from 0.4 at 295 K to 0.6 at 258 K, and an exponential temperature dependent fit (blue line) corresponding to an activation energy of 1.8 kJ/mol. This exponential function is constrained to giveγe≤1
for all temperatures. The exponential fit givesγe=0.48 at 295 K and γe=0.43 at 258 K. Both
temperature-dependent fits were tuned to yield the strongest temperature dependence that agrees with the observations within experimental error.