HAL Id: hal-00330259
https://hal.archives-ouvertes.fr/hal-00330259
Preprint submitted on 15 Aug 2007HAL is a multi-disciplinary open access
archive for the deposit and dissemination of sci-entific research documents, whether they are pub-lished or not. The documents may come from teaching and research institutions in France or abroad, or from public or private research centers.
L’archive ouverte pluridisciplinaire HAL, est destinée au dépôt et à la diffusion de documents scientifiques de niveau recherche, publiés ou non, émanant des établissements d’enseignement et de recherche français ou étrangers, des laboratoires publics ou privés.
Heterotrophic bacterial production in the South East
Pacific: longitudinal trends and coupling with primary
production
France van Wambeke, I. Obernosterer, T. Moutin, S. Duhamel, O. Ulloa,
Hervé Claustre
To cite this version:
France van Wambeke, I. Obernosterer, T. Moutin, S. Duhamel, O. Ulloa, et al.. Heterotrophic bacterial production in the South East Pacific: longitudinal trends and coupling with primary production. 2007. �hal-00330259�
BGD
4, 2761–2791, 2007
Heterotrophic bacterial production
in the South East Pacific
F. Van Wambeke et al.
Title Page Abstract Introduction Conclusions References Tables Figures ◭ ◮ ◭ ◮ Back Close
Full Screen / Esc
Printer-friendly Version Interactive Discussion Biogeosciences Discuss., 4, 2761–2791, 2007
www.biogeosciences-discuss.net/4/2761/2007/ © Author(s) 2007. This work is licensed
under a Creative Commons License.
Biogeosciences Discussions
Biogeosciences Discussions is the access reviewed discussion forum of Biogeosciences
Heterotrophic bacterial production in the
South East Pacific: longitudinal trends
and coupling with primary production
F. Van Wambeke1, I. Obernosterer3, T. Moutin2, S. Duhamel1,2, O. Ulloa4, and H. Claustre5
1
Laboratoire de Microbiologie, G ´eologie et Ecologie Marine (LMGEM), CNRS UMR 6117, Universit ´e de la M ´editerran ´ee, Campus de Luminy – Case 901, 13288 Marseille cedex 9, France
2
Laboratoire d’Oc ´eanographie et de Biog ´eochimie (LOB), CNRS UMR 6535, Universit ´e de la M ´editerran ´ee, Campus de Luminy – Case 901, 13288 Marseille cedex 9, France
3
Laboratoire d’Oc ´eanographie Biologique de Banyuls (LOBB), Universit ´e Pierre et Marie Curie – Paris VI, CNRS UMR7621, BP 44, F66650 Banyuls-sur-Mer, France
4
Department of Oceanography & Center for Oceanographic Research in the eastern South Pacific, University of Concepcion, Casilia 160-C, Concepcion, Chile
5
CNRS, Laboratoire d’oc ´eanographie de Villefranche, 06230 Villefranche-sur-Mer, France ; Universit ´e Pierre et Marie Curie-Paris6, Laboratoire d’oc ´eanographie de Villefranche, 06230 Villefranche-sur-Mer, France
Received: 23 July 2007 – Accepted: 27 July 2007 – Published: 15 August 2007 Correspondence to: F. Van Wambeke (france.van-wambeke@univmed.fr)
BGD
4, 2761–2791, 2007
Heterotrophic bacterial production
in the South East Pacific
F. Van Wambeke et al.
Title Page Abstract Introduction Conclusions References Tables Figures ◭ ◮ ◭ ◮ Back Close
Full Screen / Esc
Printer-friendly Version Interactive Discussion
Abstract
Spatial variations of heterotrophic bacterial production and phytoplankton primary pro-duction were investigated across South East Pacific Ocean (–141◦W, –8◦S to –72◦W, –35◦S) in November–December 2004. Bacterial production (3H leucine incorpora-tion) integrated over the euphotic zone encompassed a wide range of values, from
5
43 mg C m−2d−1in the hyper-oligotrophic South Pacific Gyre to 392 mg C m−2d−1 in the upwelling off Chile. Within the gyre (120◦W, 22◦S) records of low phytoplank-ton biomass (7 mg TChla m−2) were obtained and in situ14
C based particulate primary production rates were as low as 153 mg C m−2d−1, thus equal to the value considered as a limit for primary production under strong oligotrophic conditions. In the South
10
Pacific gyre average rates of3H leucine incorporation rates, and leucine incorporation rates per cell (5–21 pmol L−1h−1 and 15–56×10−21mol cell−1h−1, respectively), were in the same range as those reported for other oligotrophic sub tropical and temperate waters. Rates of dark community respiration, determined at selected stations across the transect varied in a narrow range (42–97 mmol O2m−2 d−1), except for one station
15
in the upwelling off Chile (245 mmol O2 m−2 d−1). Bacterial growth efficiencies varied between 5 and 38% and bacterial carbon demand largely exceeded 14C particulate primary production across the South Pacific Ocean. Net community production also revealed negative values in the South Pacific Gyre (–13±20 to –37±40 mmol O2 m−2 d−1). Such imbalances being impossible in this area far from any external input, we
dis-20
cuss the techniques involved for determining the coupling between primary production and bacterial heterotrophic production.
1 Introduction
Over a broad range of aquatic systems, heterotrophic bacterial biomass varies less than phytoplankton biomass (Cole et al., 1988). The magnitude, variability and control
25
of bacterial heterotrophic production is well studied in the northern hemisphere (Duck-2762
BGD
4, 2761–2791, 2007
Heterotrophic bacterial production
in the South East Pacific
F. Van Wambeke et al.
Title Page Abstract Introduction Conclusions References Tables Figures ◭ ◮ ◭ ◮ Back Close
Full Screen / Esc
Printer-friendly Version Interactive Discussion low, 2000; Landry and Kirchman, 2002), including the Arctic (Sherr et al., 2003;
Kirch-man et al., 2005). By contrast, the oceans in the southern hemisphere have been less explored, except along coasts and margins, and the Indian and the Antarctic Ocean. In the Pacific Ocean, results for heterotrophic bacterial production were mainly acquired in tropical and subtropical regions (20◦N–20◦S, Landry and Kirchman, 2002). The
5
North Pacific Central gyre has been intensively studied, particularly the long term sta-tion HOTS (Hawai Ocean Time Series, Karl et al., 2001). Overall, oligotrophic regions of the ocean are clearly the least well studied.
On the basis of remotely sensed ocean color, the South East Pacific gyre is sug-gested to be the most oligotrophic and stable water body (Claustre and Maritonera,
10
2003). To date, however, no investigation on the biogeochemistry of this water body has taken place. The aim of the BIOSOPE (BIogeochemistry and Optics SOuth Pacific Experiment) project was to conduct a pluridisciplinary exploration of this gyre as well as their eastern (Chilean upwelling) and western (Marquesas plateau) borders, allowing the examination of a very large range of trophic conditions. Hyperoligotrophic
condi-15
tions were observed in the centre of the gyre, with the clearest waters ever described (Morel et al 2007) and a deep chlorophyll maximum reaching 180 m. In oligotrophic environments it has been often discussed the issue that ocean respiration could ex-ceed production (del Giorgio et al., 1977; Steinberg et al., 2001; Williams et al., 2004; Mourino-Carballido and McGillicuddy, 2006). Thus, in this study, we will discuss levels
20
of bacterial production rates reached in comparison to other open ocean environments, compare bacterial carbon demand to primary production and reevaluate the interpre-tation of such comparison in the frame the of metabolic balance of these open ocean waters.
BGD
4, 2761–2791, 2007
Heterotrophic bacterial production
in the South East Pacific
F. Van Wambeke et al.
Title Page Abstract Introduction Conclusions References Tables Figures ◭ ◮ ◭ ◮ Back Close
Full Screen / Esc
Printer-friendly Version Interactive Discussion
2 Materials and methods
2.1 Strategy of sampling
The BIOSOPE cruise was conducted from 24 October to 11 December 2004 aboard R/V Atalante across the South East Pacific Ocean (Fig. 1). Stations of short (<5 h, 21 stations) and long (3 to 6 days, 6 stations) duration were sampled (Table 1).
Sta-5
tions occupied for less than 5 h were abbreviated chronologically (station type STB1 to STB20 and STA21, Fig. 1, Table 1). The stations of long duration were abbreviated according to their location: MAR (in the vicinity of Marquise Islands), HNL (High Nu-trients Low Chlorophyll waters in North Eastern area far from Marquise Islands), GYR (the central part of the South Pacific gyre), EGY (the Eastern part of the South Pacific
10
gyre) and, UPW and UPX (2 sites chosen in the upwelling of Chile). At the short sta-tions we systematically sampled at 09:00 h local time to avoid possible biases due to daily variability in heterotrophic bacterial abundance and activity. At the long stations, we checked the validity of our routine bacterial production protocols by time series and concentration kinetics. All samples were collected from a CTD rosette fitted with 20
15
12-L Niskin bottles equipped with Teflon rings. Samples were processed within 1 h of collection. Water samples used for in situ – simulated primary measurements (IPPdeck) came from the same rosette as that used for BP (the 09:00 a.m. CTD cast). However some measurements of PP using the JGOFs protocol (in situ moored lines immerged for 24 h from dusk to dusk, IPPin situ) were also performed for some time at the long
20
stations. In that case, samples were taken on a rosette before dusk. Besides mea-surements of bacterial abundance and production and primary production described below, other data included in this paper includes hydrographic properties (Claustre et
BGD
4, 2761–2791, 2007
Heterotrophic bacterial production
in the South East Pacific
F. Van Wambeke et al.
Title Page Abstract Introduction Conclusions References Tables Figures ◭ ◮ ◭ ◮ Back Close
Full Screen / Esc
Printer-friendly Version Interactive Discussion al., 2007a1) and Total chlorophylla (TChla = Chla+Divinyl-Chla, Ras et al., 20072).
2.2 Bacterial abundance
Water samples for flow cytometric analyses of heterotrophic bacterial populations were fixed with paraformaldehyde at 1% and preserved in liquid nitrogen for further analysis in the laboratory. The protocol is fully described in Grob et al. (2007). Briefly,
bacte-5
rial samples were counterstained with SYBR-Green I and counted on a FACS Calibur (Becton Dickinson) flow cytometer.
2.3 Bacterial production
Bacterial production was determined by [3H] leucine incorporation applying the cen-trifugation method (Smith and Azam, 1992). Duplicates 1.5 mL samples were
incu-10
bated with a mixture of [4,5-3H]leucine (Amersham, specific activity 160 Ci mmol−1) and nonradioactive leucine at final concentrations of 7 and 13 nM, respectively for ac-tive waters (>10 pmol leu L−1h−1) and the opposite (7 nM cold, 13 nM labeled) for low activity waters. Samples were incubated in the dark at the respective in situ temper-atures for 1–7 h according to expected activities, period during which we preliminarily
15
checked that the incorporation of leucine was linear with time (e.g. in the centre of the gyre we incubated on average 2 h surface waters and the activity in dark incubated samples was linear up to 8 h, data not shown). Incubations were stopped by the addi-tion of trichloracetic acid (TCA) to a final concentraaddi-tion of 5%. To facilitate the precipi-tation of proteins, bovine serum albumin (BSA, Sigma, 100 mg L−1final concentration)
20
was added prior to centrifugation at 16 000 g for 10 min. After discarding the
super-1
Claustre, H., Sciandra, A., Vaulot, D., and Raimbaullt, P.: Introduction to the special section: bio-optical and biogeochemical conditions in the South East Pacific in late 2004 – the BIOSOPE program, Biogeosci. Discuss., in preparation, 2007a.
2
Ras, J., Uitz, J., and Claustre, H.: Spatial variability of phytoplankton pigment distribution in the South East Pacific. Biogeosci. Discuss., in preparation, 2007.
BGD
4, 2761–2791, 2007
Heterotrophic bacterial production
in the South East Pacific
F. Van Wambeke et al.
Title Page Abstract Introduction Conclusions References Tables Figures ◭ ◮ ◭ ◮ Back Close
Full Screen / Esc
Printer-friendly Version Interactive Discussion natant, 1.5 ml of 5% TCA were added and the samples were subsequently vigorously
shaken on a vortex and centrifuged again. The supernatant was discarded and 1.5 ml of PCS liquid scintillation cocktail (Amersham) were added. The radioactivity incorpo-rated into bacterial cells was counted in a Packard LS 1600 Liquid Scintillation Counter on board the ship. We checked effects of ethanol rinse and BSA addition in our
pro-5
tocol, because in most published studies BSA is not added and ethanol rinse is often used to remove unspecific3H labelling (Wicks and Robarts, 1998; Ducklow et al., 2002; Kirchman et al., 2005) although sometimes ethanol rinse did not change the results (Van Wambeke et al., 2002; Gran ´eli et al., 2004). There was no significant difference among the different treatments (+ or – ethanol, + or – BSA added, data not shown).
10
As we managed also some size-fractionated bacterial activity measurements on some selected samples, we were also able to compare the filtration technique (20 ml incu-bated with 1 nM3H-leucine +19 nM cold leucine, filtered through Millipore GS 0.2 µm filters, no ethanol rinse), with the centrifugation technique (BSA addition, no ethanol rinse). The model II regression was applied to compute the relationships between both
15
techniques. With the whole data set (n=88, BP ranged 5–578 ng C L−1h−1), the slope of “filtration” versus “centrifugation” was 1.04±0.02, and with only the <50 ng C L−1h−1 data set (n=77), the slope was 0.93±0.04 (figure not shown). In both cases, the Y intercept was not significantly different from 0. We felt thus confident in comparison of our measurements of leucine rates compared to other protocols (centrifugation with no
20
BSA or filtration technique).
A factor of 1.5 kg C mol leucine−1 was used to convert the incorporation of leucine to carbon equivalents, assuming no isotopic dilution (Kirchman, 1993). Indeed, iso-topic dilution ranged from 1.04 to 1.18 as determined on 4 occasions on concentration kinetics. Error associated to the variability between replicate measurements (half the
25
difference between the two replicates) averaged 13% and 6% for BP values less and more than 10 ng C L−1h−1, respectively.
BGD
4, 2761–2791, 2007
Heterotrophic bacterial production
in the South East Pacific
F. Van Wambeke et al.
Title Page Abstract Introduction Conclusions References Tables Figures ◭ ◮ ◭ ◮ Back Close
Full Screen / Esc
Printer-friendly Version Interactive Discussion 2.4 Particulate primary production
Primary production was determined (1) by 24 h- in situ incubations according to the experimental protocol detailed in Moutin and Raimbault (2002) and (2) by short-term (<5 h) on-deck incubations using incubators equipped with Nickel screens (50, 25, 15, 7, 3 and 1% of incident irradiance) (Duhamel et al., 2006). Rates of daily particulate
5
primary production were obtained using 2 incubation methods: i) in situ moored lines immerged during 24 h, and in that case daily rates were directly measured (PPin situ) and ii) using the conversion factorsτ(T i ;T )according to Moutin et al. (1999) to calculate
normalized (dawn-to-dawn) daily rates from the hourly rates measured in the on-deck incubators (PPdeck). The conversion factors were calculated based on incident
irradi-10
ance measured aboard.
2.5 Gross community production, dark community respiration and net community pro-duction
Rates of gross community production (GCP), dark community respiration (DCR) and net community respiration (NCP) were estimated from changes in the dissolved oxygen
15
(O2) concentration during light/dark incubations of unfiltered seawater (24 h) carried out in situ on moored lines. Seawater was collected at 6 depths in the euphotic zone and transferred to 9-L polycarbonate bottles. The biological oxygen demand (BOD) bottles (125 ml) were filled by siphoning, using silicon tubing. For DCR, the BOD bottles were placed in black bags. All BOD bottles were incubated in situ at the respective depth
20
layers under natural irradiance levels from dusk to dusk using the same mooring line as for PPin situ. The concentration of oxygen was determined by Winkler titration of whole bottles. Titration was done with an automated potentiometric end-point detection sys-tem (Metrohm DMS 716), following the recommendations of Carignan et al. (1998). DCR and NCP were calculated as the difference between initial and final O2
concen-25
trations in dark and light bottles, respectively. GCP was calculated as the difference between NCP and DCR. On two occasions (St 3 5 m, 125 m), respiration rates were
BGD
4, 2761–2791, 2007
Heterotrophic bacterial production
in the South East Pacific
F. Van Wambeke et al.
Title Page Abstract Introduction Conclusions References Tables Figures ◭ ◮ ◭ ◮ Back Close
Full Screen / Esc
Printer-friendly Version Interactive Discussion also determined on filtered (0.8µm) water samples.
2.6 Bacterial growth efficiency
The bacterial growth efficiency (BGE) was calculated from bacterial heterotrophic pro-duction and rates of DCR, assuming that bacterial respiration represented a constant proportion (f) of DCR and applying a respiratory quotient (RQ) to convert O2- based
5
measurements to carbon units: BGE=BP/(BP + (fxRQxDCR))
The choices of RQ and f are developed in the results section. The BGE were estimated from data of daily BP and DCR integrated over the euphotic zone. Vertical profiles for both parameters are available at the long stations MAR, HNL, GYR, UPW and UPX
10
where moored lines were deployed for 24 h in situ.
3 Results
3.1 Spatial variation
Bacterial abundances (0.8–20.7×10⁵ bacteria ml−1) and leucine incorporation rates (0.34–400 pmol leu L−1h−1) revealed large variations across the 8000 km of the
15
BIOSOPE transect (Fig. 2). Both parameters were strongly correlated (relation log – log, n=249, r=0.85, p<0.001) over these large range of data. The gradients of bacterial abundances and leucine incorporation rates were particularly pronounced off Chile. Highest leucine incorporation rates were obtained in the uwelling area (250 pmol L−1h−1 at UPW at 35 m, Fig. 3; 400 pmol L−1h−1 at UPX at 15 m,
pro-20
file not presented) and in the northwestern zone of the transect, close to the Mar-quises Islands (60 pmol L−1h−1, at MAR at 10–50 m). Substantially lower rates were obtained between Stations 8 and 14 (maximum 15 pmol L−1h−1). A similar pattern
BGD
4, 2761–2791, 2007
Heterotrophic bacterial production
in the South East Pacific
F. Van Wambeke et al.
Title Page Abstract Introduction Conclusions References Tables Figures ◭ ◮ ◭ ◮ Back Close
Full Screen / Esc
Printer-friendly Version Interactive Discussion was detectable for phytoplankton biomass (Tchla, Ras et al., 20072) and nitrate
con-centrations (Raimbault et al., 20073). At MAR, sea surface temperature was 27.5◦C and the mixed layer reached 70 m (Fig. 3). A large peak of leucine activity devel-oped between 10 and 50 m (59±8 pmol L−1h−1) coinciding with the layer of maximum primary production (20 m, 13µg C L−1d−1) and maximum TChla (50 m, 0.4 µg L−1).
5
At UPW, characterized by a reduced mixed layer (20 m) and lower surface water temperature (15.9◦C), maximum rates of primary production (50µg C L−1d−1) and leucine incorporation (250 pmol L−1h−1) were higher than at the MAR site. Maxi-mum leucine incorporation coincided with a narrow, high TChla peak (2.6 µg L−1) at 35 m depth (Fig. 3). At the GYR site, leucine incorporation was homogenous (mean
10
± SD: 9.3±1.9 pmol L−1h−1) down to 120 m depth, similarly to primary production (0.9±0.3 µg C L−1d−1between 20 and 160 m). Below 120 m, leucine incorporation pro-gressively decreased to 1.4 pmol L−1h−1 at 250 m depth. No clear association with the deep, very low peak of TChla (0.16 µg L−1) at 185 m depth was detectable at this site. At EGY, leucine incorporation rates were still very low but exhibited a subsurface
maxi-15
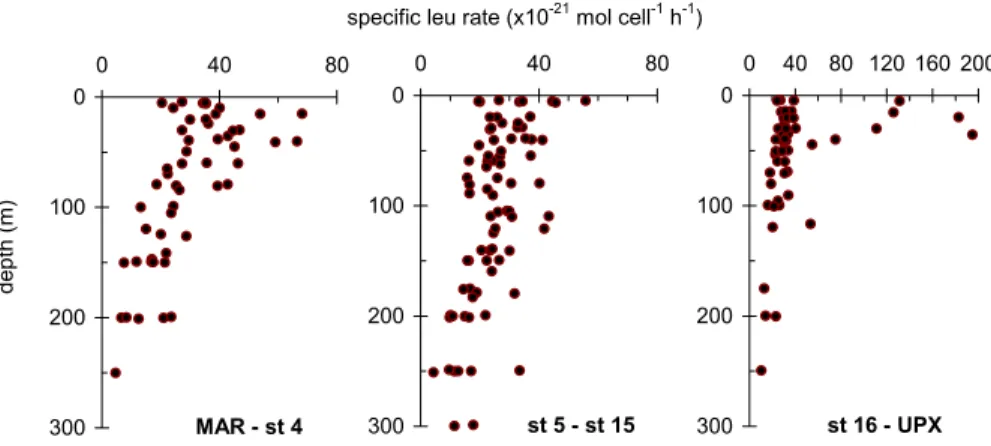
mum around 40 m, coinciding with a peak of primary production around 3µg C L−1d−1. By contrast to bulk fluxes of heterotrophic bacterial production, specific leucine incor-poration rates varied within a rather low range (10–70×10−21mol cell−1h−1), except for the Chilean coast, where values reached up to 200×10−21mol cell−1h−1(Fig. 4). From MAR to STB4, a sub-surface maximum was visible around 20–30 m with values
rang-20
ing from 30 to 70×10−21mol cell−1 h−1(Fig. 4). Within the gyre (stations 5 to 15) the vertical distribution of specific leucine incorporation rates were rather constant down to the deep Tchla maximum at around 160 m (13–56×10−21 mol cell−1 h−1) with slightly higher values in the subsurface and around 110 m depth.
BP integrated over the euphotic zone (IBP) ranged from 43 to 392 mg C m−2d−1
25
during the BIOSOPE Cruise (Fig. 5). These data reflect the large range of trophic con-ditions encountered, with integrated stocks of TChla within the euphotic zone ranging
3
Raimbault, P., Garcia, N., and Cerutti, F.: Distribution of organic and inorganic nutrients in the south Pacific Gyre, Biogeosci. Discuss., in preparation, 2007.
BGD
4, 2761–2791, 2007
Heterotrophic bacterial production
in the South East Pacific
F. Van Wambeke et al.
Title Page Abstract Introduction Conclusions References Tables Figures ◭ ◮ ◭ ◮ Back Close
Full Screen / Esc
Printer-friendly Version Interactive Discussion between 7 and 59 mg m−2 (Table 1) and integrated fluxes of particulate primary
pro-duction (IPPdeck) between 76 and 1446 mg C m−2d−1(Fig. 5). As for volumetric values, highest values of IBP were obtained in the upwelling off Chile (226–392 mg C m−2d−1) corresponding roughly to the IBP fluxes obtained by Cuevas et al. (2004) – based on thymidine technique- in the upwelling area off Concepcion in October 1999 (268–
5
561 mg C m−2d−1 for their coastal station 73◦W). At stations STB6 to STB15, encom-passing the GYR sites, IBP was as low as 58±11 mg C m−2d−1(mean ± SD). Sim-ilarly IPPdeck revealed lowest values in this region (134±42 mg C m−2d−1). Stations MAR and HNL, on the western part of the transect, presented intermediary values of IBP (86–140 mg C m−2d−1) and IPPdeck(318–683 mg C m−2d−1). IPPin situ, determined
10
only on a limited number of stations across the transect reflected the trends of IPPdeck (r=0.89, n=5) with higher values at MAR and UPW (1146 and 1344 mg C m−2d−1, respectively) and lower values at GYR (154 mg C m−2d−1, Table 2). Both estimates of 14
C particulate primary production were very close, with IPPin situbeing, on average 1.3 fold higher than IPPdeck(range 0.92–1.67). GCP ranged from 29 to 505 mmol O2m−2
15
d−1and was well correlated also with IPPdeck(r=0.89, n=7). Net community production was not statistically different from 0 at GYR, was negative at UPX (–38±23 mmol O2 m−2d−1) and reached up to 429 mmol O
2m−2d−1at UPW. The ratio of IBP to IPPdeck was not constant, ranging from 0.19 to 1.04 and presented higher values in the olig-otrophic area (mean ± SD for stations 6 to 15: 0.48±0.24) and lower on the boundaries
20
of the transect (for the eastern part, stations EGY to UPX: 0.24±0.05, for the western part, stations MAR to 1: 0.25±0.03).
3.2 Dark community respiration and Bacterial growth efficiencies
Rates of DCR varied within a narrow range (42–97 mmol O2 m−2 d−1) except for the high rates obtained at UPX (245 mmol O2m−2d−1). The BGE was calculated assuming
25
i) that heterotrophic bacterial respiration accounts entirely for DCR (BGE100), or that it represented half of it (BGE50, Table 3). For all stations considered, BGE100 ranged
BGD
4, 2761–2791, 2007
Heterotrophic bacterial production
in the South East Pacific
F. Van Wambeke et al.
Title Page Abstract Introduction Conclusions References Tables Figures ◭ ◮ ◭ ◮ Back Close
Full Screen / Esc
Printer-friendly Version Interactive Discussion between 7 and 24% and BGE50 ranged between 14 and 38%. DCR rates in<0.8 µm
fractionated sea water was not different from DCR (0.62±0.22 and 0.52±0.25 µmol O2 L−1 d−1 for the <0.8 µm size fraction and unfiltered seawater, respectively, at 5 m and 0.46±0.12 and 0.58±0.24 µmol O2 L−1 d−1 for the <0.8 µm size fraction and unfiltered seawater, respectively at 125 m). This suggests that the estimate of BGE100
5
is appropriate for the oligotrophic region visited in the present study. The application of respiratory quotients (RQ) for a given contribution of bacterial to community respiration resulted in minor changes of BGEs, differing only by 2 to 7% when RQs of 0.8 and 1.1 are applied. Hence, the assumption on the fraction of DCR attributable to bacterial respiration has a greater impact on the variability of the BGE than the choice of the
10
respiratory quotient (RQ). With both assumptions on the RQ, however, lower BGEs were obtained at site GYR (5–15%) and BGEs increased in the upwelling area (UPW: 14-38%) and in the western part, at the MAR and HNL sites (12–28%). Keeping an average BGE of 7% as a correct estimate for the more oligotrophic sites, the ratio of the integrated bacterial carbon demand (BCD) to14C-Primary production (IPPdeck, data
15
from Fig. 5) in the gyre would range between 3.7 (STB15) to 14 (STB7) (median for stations STB6 to STB15: 5.7, n=9).
The calculation of the BGE is commonly based on bacterial heterotrophic production determined prior to the 24 h incubation. During the size fractionation experiment at station STB3 as well as during bioassays experiments (Van Wambeke et al., 2007a4),
20
we observed, however, an increase in bacterial heterotrophic production during the in-cubation period. The median value of the increase at stations STB6 to STB15 was x 3.2 in 24 h (Van Wambeke et al., 2007a4). Such increases during DCR measure-ments were reported previously (Pomeroy et al., 1994). Estimates of BGE can be corrected from this bias by assuming an exponential increase in bacterial production
25
during the 24 h incubation as follows: (BP24-BP0)/(Ln (BP24) – Ln (BP0)). Applying this
4
Van Wambeke, F., Bonnet, S., Moutin, T., Raimbault, P., Alarc¸on G., and Guieu, C.: Factors limiting heterotrophic prokaryotic production in the southern Pacific Ocean, Biogeosci. Dis-cuss., in preparation, 2007a.
BGD
4, 2761–2791, 2007
Heterotrophic bacterial production
in the South East Pacific
F. Van Wambeke et al.
Title Page Abstract Introduction Conclusions References Tables Figures ◭ ◮ ◭ ◮ Back Close
Full Screen / Esc
Printer-friendly Version Interactive Discussion correction, BGEs at the GYR sites range from 10 to 15% (Table 3). Thus the average
BGE of 7% used for the oligotrophic site increases to 12%, resulting in a decrease in the BCD/IPPdeck ratios from 2.1 to 8.6 (median 3.3 for stations STB6 to STB15, n=9) according to locations.
4 Discussion
5
The South Pacific Gyre is the most oligotrophic water body in the global ocean, a de-scription that is up to date mainly based on satellite observations (Claustre and Mari-tonera, 2003; Longhurst, 1998). Several parameters determined during the BIOSOPE-cruise, such as water clarity (Morel et al., 2007) and phytoplankton biomass (7 mg TChla m−2 within the euphotic zone, Table 1, Ras et al., 20072) confirm the
hyper-10
oligotrophic character of this area. One question that we addressed in the present study was to determine whether bacterial production is also the lowest ever reported for open seas and oligotrophic areas? For surface layers, most reported rates of leucine incorporation in oligotrophic areas do not decrease below a threshold of ∼10 pmol L−1h−1 (Table 4). Lower leucine incorporation rates were only obtained
15
in the Eastern Mediterranean Sea (Levantine and Ionian Sea, range 0.4–17, mean 6.6±4.9 pmol L−1h−1, Table 4), and in our study between STB5 and STB14 (range 5–21 mean 10.8±2.9 pmol L−1h−1). Both cases correspond to marine environments where the depth of deep TChla maximum exceeds 150 m. Bacterial abundance varies less than bacterial heterotrophic production, thus the lowest specific activities are again
20
obtained for the Levantine Basin in the Mediterranean Sea (1–49×10−21 mole cell−1 h−1) and cell specific activities were in the same order of magnitude (10–60×10−21 mole cell−1 h−1) in the centre of the south Pacific Gyre, the western Mediterranean Sea, or the equatorial Pacific Ocean (Table 4).
Bacterial community turnover rates (the ratio of bacterial heterotrophic bacterial
pro-25
duction to bacterial biomass ratio = BP/BB ratio) allows a comparison among studies independent of the technique (leucine or thymidine incorporation), but it requires the
BGD
4, 2761–2791, 2007
Heterotrophic bacterial production
in the South East Pacific
F. Van Wambeke et al.
Title Page Abstract Introduction Conclusions References Tables Figures ◭ ◮ ◭ ◮ Back Close
Full Screen / Esc
Printer-friendly Version Interactive Discussion application of conversion factors for bacterial biomass and production. In the present
study, we used 1.5 kg C per mol leu assuming no isotopic dilution, and a low carbon per cell conversion factor more specific for oligotrophic environments (10 fg C per cell, Christian and Karl, 1994; Fukuda et al., 1998). The application of these conversion factors allowed us to compare our bacterial community turnover rates (0.05–0.21 d−1,
5
Table 4, mean 0.11±0.03 d−1, n=63) with many previous studies that used 3.1 kgC per mol leu and 20 fg C per cell (Li et al., 1993, Kirchman et al., 1995). Lowest bac-terial community turnover rates are still obtained for the Eastern Mediterranean Sea (0.003-0.123 d−1 based on leucine incorporation, Table 4 and 0.005–0.11 d−1 based on thymidine incorporation, Robarts et al., 1996). In the tropical, subtropical and
tem-10
perate Pacific and Atlantic oceans a bacterial community turnover rate of 0.02–0.04 d−1 (Table 4) appears to be a minimum threshold based on theoretical leucine-carbon con-version factors. However, a recent investigation of empirical concon-version factors along a coast-offshore transect in the Atlantic (Alonso-Saez et al., 2007) suggests a bias re-lated to high respiration of leucine in off shore stations (60–80%) which lead to very
15
low conversion factors when using3H leucine (0.02–0.36 kg C per mole leucine in off-shore stations). Applying the mean of these empirical conversion factors (0.17 kg C per mole leucine) in the gyre, our bacterial growth rates would decrease and range from 0.005 to 0.02 d−1. On the other hand, based on microautoradiographic observations, it has further been shown that only 25% of prokaryotic cells within surface waters in
20
the gyre are taking up leucine (Obernosterer et al., 20075), suggesting that a low per-centage of the prokaryotic heterotrophic community is active. Thus the growth rate of the active population based on leucine incorporation would be 4 fold higher. All these corrections would lead to a possibly very large range of bacterial community growth rates, varying between 0.005 d−1 (0.17 kg C per mole, no correction for active
frac-25
5
Obernosterer, I., Catala, P., Lami, R., Caparros, J., Ras, J., Bricaud, A., Dupuy, C., Van Wambeke, F., and Lebaron P.: Biochemical characteristics and bacterial community structure of the sea surface microlayer in the south Pacific Ocean, in preparation, Biogeoscience Discuss., 2007.
BGD
4, 2761–2791, 2007
Heterotrophic bacterial production
in the South East Pacific
F. Van Wambeke et al.
Title Page Abstract Introduction Conclusions References Tables Figures ◭ ◮ ◭ ◮ Back Close
Full Screen / Esc
Printer-friendly Version Interactive Discussion tion) to 0.8 d−1 (1.5 kg C per mole, 25% bacteria active). The fact that the bacterial
community turnover rate is often low compared to that of phytoplankton is presently a subject of debate (Duhamel et al., 2007, and references therein). Development of al-ternative techniques to estimate turnover of heterotrophic bacterial cells have recently been used, based on the examination on the turnover of a particular chemical pool or
5
compound of the cell. For instance, the turnover rate of the phosphate (P) pool has been examined in different size fractions during the BIOSOPE cruise (Duhamel et al., 2007). Based on the hypothesis that detrital particulate P in mostly negligible, and assuming that the P assimilation rates and the P biomass in the<0.6 µm fraction are mainly related to heterotrophic prokaryotes, these authors found a bacterial P-based
10
turnover time of 0.11±0.07 d−1 within the gyre. This value is in accordance with the mean range of BP/BB ratio that we obtained in the centre of the gyre using theoreti-cal conversion factors. Unexpected high turnover rates of bacteriochlorophyll a have been detected in the Mediterranean and Atlantic seas (Koblizek et al., 2007) a pigment characteristic of aerobic anoxygenic phototrophs which have been also observed
dur-15
ing BIOSOPE cruise (Lami et al., 2007). Such turnover rates derived from analysis of a given chemical pool, if in close relation to the whole cell turnover (Koblizek et al., 2007), suggest also that some components of the heterotrophic (including mixotrophs) bacterial community might have higher turnover rates than the whole consortium.
Our measurements of bacterial production, though among the lowest reported for the
20
open ocean – excluding high latitude, cold waters-, clearly do not represent minimum values. If bacterial activity is similar among open ocean oligotrophic environments, is this also the case for primary production? A comparison among studies is not simple due to differences in the incubation conditions. Our IPPdeckvalues were generally lower than those obtained by “standard” in situ incubations (IPPin situ, Table 2). It is well known
25
that it is difficult to reproduce the natural irradiance conditions on board and thus, for the comparison with IPP from other studies, we will only refer to primary production determined from the in situ moored lines. It appears that considerably higher rates of IPPin situ were obtained in the North Pacific Gyre at ALOHA (200–900 mg C m−2d−1,
BGD
4, 2761–2791, 2007
Heterotrophic bacterial production
in the South East Pacific
F. Van Wambeke et al.
Title Page Abstract Introduction Conclusions References Tables Figures ◭ ◮ ◭ ◮ Back Close
Full Screen / Esc
Printer-friendly Version Interactive Discussion Karl et al., 2001), and in the Sargasso Sea at BATS (312–520 mg C m−2d−1 and 340–
530 mg C m−2d−1, Steinberg et al., 2001 and Mourino-Carballido and McGillicuddy, 2006, respectively) as compared to the measurements of IPPin situ in the centre of the South Pacific Gyre (154–203 mg C m−2d−1). These previous estimates were derived from in situ dawn to dusk incubations whereas our results are from 24 h incubations.
5
As previously reported for the eastern Mediterranean Sea, an integrated primary pro-duction of about 150 mg C m−2d−1 may appear as a lower limit for primary production rates estimated by 24 h in situ incubations under strong oligotrophic conditions (Moutin and Raimbault, 2002). Thus the rates of primary production determined in the centre of the south Pacific gyre appear to be among the lowest reported.
10
We explored the phytoplankton-bacterial coupling by comparing the bacterial carbon demand (BCD) to primary production (IPP) and gross community production (GCP). These comparisons are often used to determine the potential fate of primary production through the microbial food web, but also to discuss the metabolic balance, presently a subject of debate in oligotrophic waters (del Giorgio et al. 1997; Kirchman, 1997;
15
del Giorgio and Duarte, 2002; Williams, 2004, Mc Andrew et al., 2007; Claustre et al., 2007b6). We paid particular attention to the methodological biases related to these different estimates.
As suggested previously (Ducklow et al., 2000), we assumed linearity when convert-ing hourly rates of bacterial heterotrophic production to daily rates. Takconvert-ing into account
20
the diurnal variability we observed at selected stations (Van Wambeke et al., 2007b7), this resulted in differences in the daily rates by 4% to 19% as compared to the linear in-crease over 24 h. The error introduced by not taking into account the daily variability is
6
Claustre, H., Huot, Y., Obernosterer, I., Gentili, B., Taillez, D., and Lewis, M.: Revisiting production budget in oligotrophic and mesotrophic system using a non intrusive bio-optical method: a case study in the south East Pacific. Biogeosci. Discuss., in preparation, 2007b.
7
Van Wambeke, F., Duhamel, S., Tedetti, M., and Claustre, H.: Heterotrophic prokaryotic production in the South East Pacific: daily variability. Biogeosci. Discuss., in preparation, 2007b.
BGD
4, 2761–2791, 2007
Heterotrophic bacterial production
in the South East Pacific
F. Van Wambeke et al.
Title Page Abstract Introduction Conclusions References Tables Figures ◭ ◮ ◭ ◮ Back Close
Full Screen / Esc
Printer-friendly Version Interactive Discussion in the same order of magnitude as the precision of bacterial production measurements
in oligotrophic areas (13% for BP values lower than 10 ng C L−1h−1, see methods). Considering all possible biases related to the estimate of BCD (daily variability, BGE estimates), bacterial carbon demand could exceed14C based IPP estimates inside the gyre by factors varying between 2 to 8 fold (median 3.3, n=9). There are two aspects
5
to examine about these results: first, the fact that BCD always exceeded PP at all sta-tions and second, the fact that a large variability of this ratio is obtained. Particulate PP based on14C measurements is generally 40–50% of gross photosynthesis (Karl et al., 1998; Moutin et al., 1999; Bender et al., 1999). For the present study, the com-parison between these fluxes is possible at some selected stations (Table 3). The ratio
10
IPP/GCP (including the whole set of IPPdeckand IPPin situcited Table 2) was 0.47±0.25 (mean ± SD), which confirms this notion. Thus the question arises how adequate the comparison between the bacterial carbon demand and14C-particulate primary produc-tion is? In fact, the ratio BCD/IPP was for most staproduc-tions within the gyre>1, while the ratio BCD/ GCP is < or close to 1 (Table 3). Even in the centre of the gyre the two
15
fluxes were close to balance (Table 3), as also observed for net community production (NCP –13±20 mmol O2 m−2 d−1, Table 2). Considering photorespiration as negligi-ble, this would suppose that DOC excreted during the incubation time represented a maximum of 37–68% of GCP, which is in the upper range of “gross” excretion values acquired in oligotrophic situations (Fernandez et al., 1994). More recently, the
percent-20
age of DOC release was assumed to represent a constant fraction of 22% across wide trophic levels (Maranon et al., 2005). However, this percentage has to be considered as “net”, as bacterial reassimilation of the DOC released during the incubation period was not taken into account. In addition, none of these studies examined the amount of DOC release that is respired by bacteria during 14C incubations devoted to
deter-25
mine primary production, even though this fraction is likely to be high given the low BGEs in oligotrophic environments. During laboratory studies it has been shown that DOC excretion increases under nutrient limited conditions (Myklestadt, 1995; Obernos-terer and Herndl, 1995). The South Pacific Ocean gyre represents an end member of
BGD
4, 2761–2791, 2007
Heterotrophic bacterial production
in the South East Pacific
F. Van Wambeke et al.
Title Page Abstract Introduction Conclusions References Tables Figures ◭ ◮ ◭ ◮ Back Close
Full Screen / Esc
Printer-friendly Version Interactive Discussion oligotrophic conditions and an exceptional percentage of DOC release by
phytoplank-ton cannot be ruled out. A marked diurnal pattern in bacterial production determined from high-frequency sampling at three stations (MAR, GYR and EGY) support this hy-pothesis (Van Wambeke, 2007b7). Bacterial production was highest around midnight, decreased until the early afternoon, and then rapidly increased again. This pattern
5
reflects a rapid response of heterotrophic bacteria to in situ primary production. These results suggest that the coupling between primary production and heterotrophic bacte-rial activity is particularly pronounced in the South Pacific Ocean.
The variability in the BCD/IPP ratio observed in the present study is more driven by the variability in IPP than the variability in IBP (percentage of variation 32% for
10
IPPdeck data, versus 19% for IBP data at stations 6 to 15 considered as oligotrophic, Fig. 5). The strong variability in IPP was not only related to the position of the station. At station GYR, IPPdeck and GCP varied both considerably during our visit, and this variability was linked to surface irradiance. Day-to-day fluctuations of primary produc-tion and thus variability in the ratio of BCD/IPP are also reported from a Lagrangian
15
experiment (Ducklow, 1999). At station ALOHA, it was also observed that the variabil-ity in production is higher than that in respiration (Williams et al., 2004). The lack of synchronicity between PP and BP has been proposed as an explanation for punctual high BCD/IPP ratios (Kirchman, 1997). Our results appear to support the hypothesis that short-term variability in PP frequently occurs, but that it is rarely determined due to
20
the time scale on which oceanographic cruises are taking place (Williams et al., 2004). Indeed, rapid (<1 week) bursts of net autotrophy, decoupled from respiration, could appear consequently to mesoscale physical processes, as shown by recent investi-gation on the effects of deep sea water enrichment in nutrient-limited surface waters of the North Pacific subtropical Gyre (Mc Andrew et al., 2007). The question on the
25
metabolic balance in the South Pacific Gyre was also investigated applying an optically based method to determine gross primary production (Claustre et al., 2007b6). These authors conclude that the South Pacific Gyre is in metabolic balance. The acquisition of high-frequency signals (Emerson et al., 2002) are necessary to provide valuable
BGD
4, 2761–2791, 2007
Heterotrophic bacterial production
in the South East Pacific
F. Van Wambeke et al.
Title Page Abstract Introduction Conclusions References Tables Figures ◭ ◮ ◭ ◮ Back Close
Full Screen / Esc
Printer-friendly Version Interactive Discussion insights into the temporal variability of PP and respiration in open oceans.
Acknowledgements. The authors thanks the crew of the R. V. Atalante for their help during
the cruise, A. Sciandra for his leadership during the second leg., C. Bournot, D. Taillez and D. Merien for CTD operations, C. Grob and G. Alarcon for access to bacterial abundance data, P. Catala for GCP and DCR measurements during Leg 2. This research was founded by the
5
French program PROOF (Processus Biogeochimiques dans l’Oc ´ean et Flux), Centre National de la Recherche Scientifique (CNRS), the Institut National des Sciences de l’Univers (INSU). This is a contribution to the BIOSOPE project of the LEFE CYBER program.
References
Alonso-Saez, L., Gasol, J. M., Aristegui, J., Vilas, J. C., Vaque, D., Duarte, C. M., and Agusti,
10
S.: Large scale variability in surface bacterial carbon demand and growth efficiency in the subtropical northeast Atlantic Ocean, Limnol. Oceanogr., 52, 533–546, 2007.
Bender, M. L., Orchardo, J., Dickson, M. L., Barber, R., and Lindley, S.: In vitro O2 fluxes compared with 14C production and other rate terms during the JGOFS Equatorial Pacific experiment, Deep-Sea Res. I, 46, 637–654, 1999.
15
Carignan, R., Blais, A.-M., and Vis, C.: Measurement of primary production and community respiration in oligotrophic lakes using the Winkler method, Can. J Fish. Aquat. Sci., 55, 1078–1084, 1998.
Carlson, C. A., Ducklow, H. W., and Sleeter, T. D.: Stocks and dynamics of bacterioplankton in the northwestern Sargasso Sea, Deep-Sea Res. II, 43, 491–515, 1996.
20
Christian, J. R. and Karl, D. M.: Microbial community structure at the U.S.-Joint Global Ocean flux Study Station ALOHA: Inverse methods for estimating biochemical indicator ratios, J. Geophys. Res., 99(C7), 14 269–14 276, 1994.
Claustre, H. and Maritonera, S.: The many shades of ocean blue, Science, 302, 1514–1515, 2003.
25
Cole, J. J., Findlay, S., and Pace, M. L.:Bacterial production in fresh and saltwater ecosystems: a cross – system overview. Mar. Ecol. Prog. Ser., 43, 1–10, 1988
Cuevas, L. A., Daneri, G., Jacob, B., and Montero, P.: Microbial abundance and activity in the seasonal upwelling area off Concepci ´on (36◦S), central Chile: a comparison of upwelling and non-upwelling conditions, Deep-Sea Res. II, 51, 2427–2440, 2004.
30
BGD
4, 2761–2791, 2007
Heterotrophic bacterial production
in the South East Pacific
F. Van Wambeke et al.
Title Page Abstract Introduction Conclusions References Tables Figures ◭ ◮ ◭ ◮ Back Close
Full Screen / Esc
Printer-friendly Version Interactive Discussion
del Giorgio, P. A. and Duarte, C. M..: Respiration in the open ocean, Nature 420, 379–384, 2002
Ducklow, H. W., Kirchman, D. L., and Quinby, H. L.: Bacterioplankton cell growth and macro-molecular synthesis in sewater cultures during the North Atlantic spring phytoplankton bloom, May, 1989. Microb. Ecol., 24, 125–144, 1992.
5
Ducklow, H. W., Quinby, H. L., and Carlson, C. A.: Bacterioplankton dynamics in the equatorial Pacific during the 1992 El Nino, Deep-Sea Res. II, 42, 621–638, 1995.
Ducklow, H. W.: The bacterial component of the oceanic euphotic zone. FEMS Microb. Ecol., 30, 1–10, 1999.
Ducklow, W. H.: Bacterial production and biomass in the oceans, in: Microbial Ecology of the
10
Oceans, edited by: Kirchman, D. L., New-York: Wiley-Liss, 85–120, 2000
Ducklow, H. W., Smith, D. C., Campbell, L., Landry, M. R., Quinby, H. L., Steward, G. F., and Azam, F.: Heterotrophic bacterioplankton in the Arabian Sea: Basinwide response to year-round high primary productivity, Deep-Sea Res. II, 48, 1303–1323, 2001.
Ducklow, H. W., Kirchman, D. L., and Anderson, T. R.: The magnitude of spring bacterial
15
production in the North Atlantic Ocean, Limnol. Oceanogr., 47, 1684–1693, 2002.
Ducklow, H. W., Dickson, M. L., Kirchman, D. L., Steward, G., Orchardo, J., Marra, J., and Azam, F.: Constraining bacterial production, conversion efficiency and respiration in the Ross Sea, Antarctica, January–February, 1997, Deep-Sea Res. II, 47, 32 227–33 247, 2000. Duhamel, S., Zeman, F., and Moutin, T.: A dual-labelling method for the simultaneous
mea-20
surement of dissolved inorganic carbon and phosphate uptake by marine planktonic species, Limnol. Oceanogr. Methods, 4, 416–425, 2006.
Duhamel, S., Moutin, T., Van Wambeke, F., Van Mooy, B., Rimmelin, P., Raimbault, P. and Claustre, H.: Growth and specific P-uptake rates of bacterial and phytoplanktonic communi-ties in the Southeast Pacific (BIOSOPE cruise), Biogeosci. Discuss., 4, 2027–2068, 2007.
25
Emerson, S., Stump, C., Johnson, B., Karl, D..: In situ determination of oxygen and nitrogen dynamics in the upper ocean. Deep-Sea Res. I, 49, 941-952, 2002.
Fern `andez, M., Bianchi, M., and Van Wambeke, F.: Bacterial biomass, heterotrophic production and utilization of dissolved organic matter photosynthetically produced in the Almeria-Oran front, J. Mar. Syst., 5, 313–325, 1994.
30
Fukuda, R., Ogawa, H., Nagata, T., and Koike, I.: Direct determination of carbon and nitrogen contents of natural bacterial assemblages in marine environments, Appl. Environ. Microbiol., 64, 3352–3358, 1998.
BGD
4, 2761–2791, 2007
Heterotrophic bacterial production
in the South East Pacific
F. Van Wambeke et al.
Title Page Abstract Introduction Conclusions References Tables Figures ◭ ◮ ◭ ◮ Back Close
Full Screen / Esc
Printer-friendly Version Interactive Discussion
Gasol, J. M., Doval, M. D., Pinhassi, J., Calderon-Paz, J. I., Guixa-Boixareu, N., Vaqu ´e, D., and Pedros-Alio, C.: Diel variations in bacterial heterotrophic activity and growth in the north-western Mediterranean Sea, Mar. Ecol. Prog. Ser., 164, 107–124, 1998.
Gran ´eli, W., Carlsson, P., and Bertilsson, S. Bacterial abundance, production and organic carbon limitation in the Southern Ocean (39–62◦S, 4–14◦E) during the austral summer
5
1997/1998, Deep Sea Res. II, 51, 2569–2582, 2004.
Grob, C., Ulloa, O., Claustre, H., Huot, Y., Alarcon, G., and Marie, D.: Picoplankton abundance and contribution to particulate attenuation (Cp) and organic carbon (POC) in the Eastern South Pacific, Biogeosci. Discuss., 4, 1461–1497, 2007.
Karl, D. M., Hebel, D. V., and Bjorkman, K.: The role of dissolved organic mater release in the
10
productivity of oligotrophic North Pacific Ocean, Limnol. Oceanogr., 13, 1270–1286, 1998. Karl, D. M., Bidigare, R. R., and Letelier, R. M.: Long-term changes in plankton community
structure and productivity in the North Pacific Subtropical Gyre: The domain shift hypothesis, Deep-Sea Res. II, 48, 1449–1470, 2001.
Kirchman, D. L.: Leucine incorporation as a measure of biomass production by heterotrophic
15
bacteria, in: Handbook of methods in aquatic microbial ecology, edited by: Kemp, P. F., Sherr, B. F., Sherr, E. B., and Cole, J. J., Boca Raton: Lewis, 509–512, 1993.
Kirchman, D. L.: Microbial breathing lessons, Nature, 385, 121–122, 1997.
Kirchman, D. L., Rich, J. H., and Barber, R. T.: Biomass and biomass production of het-erotrophic bacteria along 140◦W in the Equatorial Pacific: Effect of temperature on the
mi-20
crobial loop, Deep-Sea Res. II, 42, 603–619, 1995.
Kirchman, D. L., Malmstrom, R. R., and Cottrell, M. T.: Control of bacterial growth by tempera-ture and organic matter in the Western Arctic, Deep-Sea Res. II, 52, 3386–3395, 2005. Kobl´ıˇzek, M., Masin, M., Ras, J., Poulton, A. J., and Prasil, O.: Rapid growth of aerobic
anoxy-genic phototrophs in the oceans, Environ. Microbiol., doi:10.1111/j.1462-2990.2007.01354.x,
25
2007.
Lami, F., Cottrell, M., Ras, J., Ulloa, O., Obernosterer, I., Claustre, H., Kirchman, D., and Lebaron, P.: High abundances of aerobic anoxygenic photosynthetic bacteria in the South Pacific ocean, Appl. Environ. Microbiol., 73, 4198–4205, 2007.
Landry, M. R. and Kirchman, D. L.: Microbial community structure and variability in the tropical
30
Pacific, Deep-Sea Res. II, 49, 2669–2693, 2002.
Li, W. K. W., Dickie, P. M., Harrisson, W. C., and Irwin, B. D.: Biomass and production of bacteria and phytoplankton dudring the spring bloom in the western north Atlantic Ocean, Deep-Sea
BGD
4, 2761–2791, 2007
Heterotrophic bacterial production
in the South East Pacific
F. Van Wambeke et al.
Title Page Abstract Introduction Conclusions References Tables Figures ◭ ◮ ◭ ◮ Back Close
Full Screen / Esc
Printer-friendly Version Interactive Discussion
Res. II, 40, 303–327, 1993.
Maranon, E., Cermeno, P., and Perez, V.: Continuity in the photosynthetic production of dis-solved organic carbon from eutrophic to oligotrophic waters, Mar. Ecol. Prog. Ser., 299, 7–17, 2005.
McAndrew, P., Bjorkman, K., Church, M., Morris, P., Jachowski, N., Williams, P. J. l. B., and
5
Karl, D.: Metabolic response of oligotrophic plankton communities to deep water nutrient enrichment, Mar. Ecol. Prog. Ser., 332, 63–75, 2007.
Morel, A., Gentili, B., Claustre, H., Babin, M., Bricaud, A., Ras, J., and Tieche, F.: Optical properties of the “clearest” natural waters, Limnol. Oceanogr., 52, 217–229, 2007.
Mourino-Carballido, B. and McGillicuddy Jr., D. J.: Mesoscale variability in the metabolic
bal-10
ance of the Sargasso Sea, Limnol. Oceanogr., 51, 2675–2689, 2006.
Moutin, T., Raimbault, P., and Poggiale, J. C.: Production primaire dans les eaux de surface de la M ´editerran ´ee occidentale: Calcul de la production journali `ere. C. R. Acad. Sci. Paris, Sciences de la vie, 322, 651–659, 1999.
Moutin, T. and Raimbault, P.: Primary production, carbon export and nutrients availability in
15
western and eastern Mediterranean Sea in early summer 1996, J. Mar. Syst., 33–34, 273– 288, 2002.
Myklestad, S. M.: Release of extracellular products by phytoplankton with special emphasis on polysaccharides, Sci. Total Environ., 165, 155–164, 1995.
Obernosterer, I. and Herndl, G.: Phytoplankton extracallular release and bacterial growth:
de-20
pendence on the inorganic N:P ratio, Mar. Ecol. Prog. Ser., 116, 247–257, 1995.
Pomeroy, L. R., Sheldon, J. E., and Sheldon, W. M.: Changes in Bacterial numbers and leucine assimilation during estimations of microbial respiratory rates in seawater by the precision Winkler method, Appl. Environ. Microbiol., 60, 328–332, 1994.
Robarts, R. D., Zohary, T., Waiser, M. J., and Yacobi, Y. Z.: Bacterial abundance, biomass, and
25
production in relation to phytoplankton biomass in the Levantine Basin of the southeastern Mediterranean Sea, Mar. Ecol. Prog. Ser., 137, 273–281, 1996.
Sherr, E., Sherr, B., and Cowles, T.: Mesoscale variability in bacterial activity in the NorthEast Pacific Ocean off Oregon, USA, Aquat. Microb. Ecol., 25, 21–30, 2001.
Sherr, B. F. and Sherr, E. B.: Community respiration/production and bacterial activity in the
30
upper water column of the central Arctic Ocean, Deep-Sea Res. I, 50, 529–542, 2003 Smith, D. C. and Azam, F.: A simple, economical method for measuring bacterial protein
syn-thesis rates in sea water using 3H-Leucine, Mar. Microb. Food Webs, 6, 107–114, 1992.
BGD
4, 2761–2791, 2007
Heterotrophic bacterial production
in the South East Pacific
F. Van Wambeke et al.
Title Page Abstract Introduction Conclusions References Tables Figures ◭ ◮ ◭ ◮ Back Close
Full Screen / Esc
Printer-friendly Version Interactive Discussion
Steinberg, D. K., Carlson, C. A., Bates, N. R., Johnson, R. J., Michaels, A. F., and Knap, A. H.:Overview of the US JGOFS BErmuda Atlantic Time-series Study (BATS): a decade-scale look at ocean biology and biogeochemistry, Deep-Sea Res. II, 48, 1405–1447, 2001. Tedetti, M., Semp ´er ´e, R., Vasilkov, A., Charri `ere, B., N ´erini, D., Miller, W.L., Kawamura, K.,
and Raimbault, P. High penetration of ultraviolet radiation in the south east Pacific waters,
5
Geophys. Res. Lett., 34, L12610, doi:10.1029/2007GL029823, 2007.
Torr ´eton, J.-P. and Dufour, P.: Bacterioplankton production determined by DNA synthesis, pro-tein synthesis, and frequency of divinding cells in Tuamotu Atoll Lagoons and surrounding ocean, Microb. Ecol., 32, 185–202, 1996.
Van Wambeke, F., Christaki, U., Giannakourou, A., Moutin, T., and Souvemerzoglou, K.:
Lon-10
gitudinal and vertical trends of bacterial limitation by phosphorus and carbon in the Mediter-ranean Sea, Microb. Ecol., 43, 119–133, 2002.
Wicks, R. J. and Robarts, R. D.: Ethanol extraction requirement for purification of protein labeled with 3HLeucine in aquatic bacterial production studies, Appl. Environ. Microbiol., 54, 3191– 3193, 1988.
15
Williams, P. J. le B.: Microbial contribution to overall marine plankton metabolism: a direct measurement of respiration, Oceanol. Acta 4, 359–364, 1981.
Williams, P. J. le B, Morris, P. J., and Karl, D. M.: Net community production and metabolic balance at the oligotrophic ocean site, station ALOHA, Deep-Sea Res. I, 51, 1563–1578, 2004.
20
BGD
4, 2761–2791, 2007
Heterotrophic bacterial production
in the South East Pacific
F. Van Wambeke et al.
Title Page Abstract Introduction Conclusions References Tables Figures ◭ ◮ ◭ ◮ Back Close
Full Screen / Esc
Printer-friendly Version Interactive Discussion
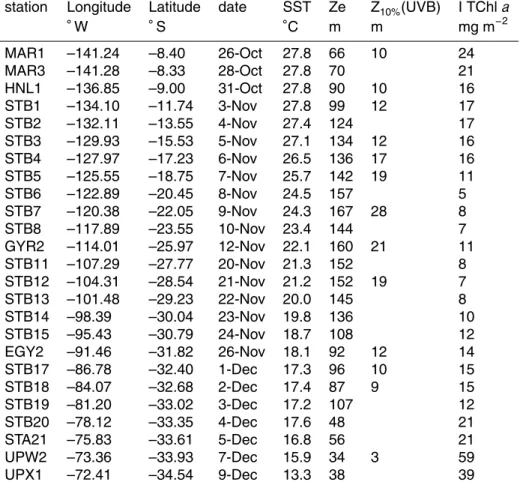
Table 1. Main physical and biological characteristics of longitudinal stations sampled during
BIOSPE cruise. SST: sea surface temperature, Ze: depth of the euphotic zone (1% PAR), Z10%(UV-B): the 10% UV-B irradiance depth (at 305±2 nm) as determined in T ´edetti et al (2007), I TChla: integrated Total chlorophylla.
station Longitude Latitude date SST Ze Z10%(UVB) I TChla
◦W ◦S ◦C m m mg m−2 MAR1 –141.24 –8.40 26-Oct 27.8 66 10 24 MAR3 –141.28 –8.33 28-Oct 27.8 70 21 HNL1 –136.85 –9.00 31-Oct 27.8 90 10 16 STB1 –134.10 –11.74 3-Nov 27.8 99 12 17 STB2 –132.11 –13.55 4-Nov 27.4 124 17 STB3 –129.93 –15.53 5-Nov 27.1 134 12 16 STB4 –127.97 –17.23 6-Nov 26.5 136 17 16 STB5 –125.55 –18.75 7-Nov 25.7 142 19 11 STB6 –122.89 –20.45 8-Nov 24.5 157 5 STB7 –120.38 –22.05 9-Nov 24.3 167 28 8 STB8 –117.89 –23.55 10-Nov 23.4 144 7 GYR2 –114.01 –25.97 12-Nov 22.1 160 21 11 STB11 –107.29 –27.77 20-Nov 21.3 152 8 STB12 –104.31 –28.54 21-Nov 21.2 152 19 7 STB13 –101.48 –29.23 22-Nov 20.0 145 8 STB14 –98.39 –30.04 23-Nov 19.8 136 10 STB15 –95.43 –30.79 24-Nov 18.7 108 12 EGY2 –91.46 –31.82 26-Nov 18.1 92 12 14 STB17 –86.78 –32.40 1-Dec 17.3 96 10 15 STB18 –84.07 –32.68 2-Dec 17.4 87 9 15 STB19 –81.20 –33.02 3-Dec 17.2 107 12 STB20 –78.12 –33.35 4-Dec 17.6 48 21 STA21 –75.83 –33.61 5-Dec 16.8 56 21 UPW2 –73.36 –33.93 7-Dec 15.9 34 3 59 UPX1 –72.41 –34.54 9-Dec 13.3 38 39 2783
BGD
4, 2761–2791, 2007
Heterotrophic bacterial production
in the South East Pacific
F. Van Wambeke et al.
Title Page Abstract Introduction Conclusions References Tables Figures ◭ ◮ ◭ ◮ Back Close
Full Screen / Esc
Printer-friendly Version Interactive Discussion
Table 2. Gross community production (GCP), dark community respiration (DCR), net
com-munity production (NCP), particulate primary production 14C based (IPPdeck and IPPin situ) at some selected stations were all these parameters were available. Data are integrated over the euphotic zone (Ze). Errors corresponds to standard deviation for GCP, DCR and NCP (quadru-plicate samples available at each depth) and for IPPin situ (triplicate samples) whereas, for IBP, IPPdeckerrors represents only integration of variability within duplicate measurements, as only 2 duplicate were used at each depth sampled. Note that the units used are not the same for all data (mmol O2m−2d−1and mgC m−2d−1).
Ze IBP DCR NCP GCP IPP1deck IPP1insitu
m mgC m−2d−1 mmol O 2m−2d−1 mmol O2m−2d−1 mmol O2m−2d−1 mgC m−2d−1 mgC m−2d−1 MAR 1 66 131±4 71±18 193±32 264±37 457±17 702±136 MAR 3 70 171±10∗ 97±13 227±16 324±20 683±29 1146±123 HNL 1 90 86±4 42±17 44±21 86±28 318±33 518±28 GYR 1 160 50±3 66±19 –37±40 29±45 159±19 154±23 GYR 4 160 65±3∗ 74±30 –13±20 61±37 nd 203±15 UPW 2 34 226±9 76±12 429±19 505±24 nd 4362±306 UPX 1 38 392±3 24 ±21 –38±23 207±34 1446±46 1344±46 1
IPPdeck: as in Fig. 5 (on-deck measurements), IPPin situ: 24 h in situ moored lines as standard JGOFS protocol (see methods).
∗
The daily IBP were calculated cumulating data of different profiles measured every 3 h along a diel cycle (Van Wambeke et al., 2007b7). In other cases, daily BP was calculated from the 09:00 CTD cast assuming daily rates = 24 times hourly rates.
BGD
4, 2761–2791, 2007
Heterotrophic bacterial production
in the South East Pacific
F. Van Wambeke et al.
Title Page Abstract Introduction Conclusions References Tables Figures ◭ ◮ ◭ ◮ Back Close
Full Screen / Esc
Printer-friendly Version Interactive Discussion
Table 3. Bacterial growth efficiencies (BGE), gross primary production (IGCP, in carbon units),
IPP/GCP and BCD/GCP ratio at some selected stations were these estimations were possible. BGEs were calculated using the following formula: BGE=BP/(BR+ BP), where BR (bacterial respiration) was assumed to be equal to DCR (BGE100) or half of it (BGE50). DCR and IBP data considered are those of Table 2. BGEcorr: BGE100 corrected for exponential growth in the flask during incubation.
BGE150 BGE1100 BGE1corr GCP2 IPP/GCP3 BCD/GCP3 % % % mgC m−2d−1 ratio ratio MAR 1 22-28 12-16 21–27 2259–2876 0.16–0.31 0.16–0.47 MAR 3 21–27 12–16 20–26 2778–3536 0.19–0.41 0.18–0.52 HNL 1 24–30 13–17 23–29 738–939 0.34–0.7 0.31–0.87 GYR 1 10–14 5.4–7.4 10–13 252–320 0.48–0.63 1.2-3.7 GYR 4 12–15 6.2–8.3 11–15 525–669 0.30–0.39 0.63–2.0 UPW 2 31–38 18–24 30–37 4328–5509 0.22–1 0.11–0.29 UPX 1 20–25 10–14 19–24 1774–2258 0.6–0.81 0.69–2.0 1
The range considers variability of Respiratory Quotients from 0.8 to 1.1.
2
The range consider variability of photosynthetic quotient from 1.1 to 1.4.
3
The range consider minimum – maximum values obtained according the choice of BGEs, RQ and PQ.
BGD
4, 2761–2791, 2007
Heterotrophic bacterial production
in the South East Pacific
F. Van Wambeke et al.
Title Page Abstract Introduction Conclusions References Tables Figures ◭ ◮ ◭ ◮ Back Close
Full Screen / Esc
Printer-friendly Version Interactive Discussion
Table 4. Review of leucine incorporation rates, specific leucine incorporation rates (SA leu) and
bacterial turnover rates (TR) in most oligotrophic mid-latitudes to equatorial areas. Temperature (T), conversion factors used to compute TR (leu CF), bacterial biomass conversion factor (BB CF) and Leucine concentration used are also indicated. Empty case: data not available. CK: concentration kinetic.
T1 leu conc Leu rate SA leu leu CF BB CF TR reference
◦C Area nM pmol L−1h−1 10−21mol cell−1h−1 kgC mole−1 fgC cell−1 d−1
20–25 South East Pacific, center of the
Gyre4 Nov–Dec 04 20 5–21 13–56 1.5 10 0.05–0.21 This study
30 South West pacific (Tuamotou Arch. 148◦15 W, 14◦55 S)
91–94 CK 36 71 1.7 15.3 0.13–0.19 Torr ´eton and Dufour (1996a) 18 Northwestern Med, inshore
off-shore transect
June 93 & June 95 20 8–70 3.4–101 0.3–2.1 Gasol et al. (1998) 22–24 Med longitudinal transect,
io-nian+levantine2
June 99 20 0.4–17 1–49 1.5 15 0.003–0.123 Van Wambeke
21–22 western 3–36 8–68 0.02–0.17 et al 2002
26–27 Med longitudinal transect, ionian3 September 99 20 10–26 18–49 1.5 15 0.04–0.123 Van Wambeke
23–25 western 15–48 14–63 0.03–0.15 et al 2002
25–28 Arabian Sea Jan–Dec 95 15–202 40–100 Ducklow et al. (2001)
15 Atlantic NABE 40◦N April–May 89 10 20–100 66–136* 1.1 20 0.08–0.1 Li et al. (1993)
45◦N 10 20–200 3.4 20 0.2-0.4
20 Sargasso Sea, BATS spring 21 10–40 0.3–0.6 4.2–7.2 0.096 Carlson et al. (1996)
25-26 (31◦50 N, 64◦10 W) summer 10–30 0.079
24-26 autumn 10–25 0.057
18–21 winter 10–20 0.07
18 North East Pacific, gyre edge off Oregon
summer 97,98 20 15–33 14–21 0.4 20 0.02–0.04 Sherr et al. (2001) 28 Equatorial Pacific along 140◦W Feb, Oct 92 60–70** 3 20 0.109–0.163 Kirchman et al. (1995)
28 Equator, Pac 140◦W during El
Nino
March 92 10 25–55 2.3 20 0.15–0.25 Ducklow et al. (1995)
25 Equator, Pac 140◦W during non El
Nino
oct-92 10 20–40 2.3 20 0.05–0.1
1
Only surface temperatures are indicated when stratification is important,2values from profiles down to depth of TChla maximum,3 values from surface layers, 4for our study, values have been indicated for stations 5 to 14 within euphotic layer (down to Ze), *from related reference Ducklow et al. (1992), ** from related reference Kirchman et al. (2005).
BGD
4, 2761–2791, 2007
Heterotrophic bacterial production
in the South East Pacific
F. Van Wambeke et al.
Title Page Abstract Introduction Conclusions References Tables Figures ◭ ◮ ◭ ◮ Back Close
Full Screen / Esc
Printer-friendly Version Interactive Discussion MAR HNL UPX UPW GYR 1 2 13 3 4 5 8 14 11 12 7 6 15 17 18 19 2021 EGY
Fig. 1. Transect of the BIOSOPE cruise from the Marquesas Islands to Chile. Long-term
process stations are indicated in red. Numbers indicates short-term stations, for which only numbers have been indicated to simplify presentation, not the complete code as in Table 3. For instance 1 is STB1 and 21 is STA21.
BGD
4, 2761–2791, 2007
Heterotrophic bacterial production
in the South East Pacific
F. Van Wambeke et al.
Title Page Abstract Introduction Conclusions References Tables Figures ◭ ◮ ◭ ◮ Back Close
Full Screen / Esc
Printer-friendly Version Interactive Discussion leu inc. rates pmol l-1h-1 BN x 105 ml-1
MAR GYR EGY UPW
Fig. 2. Distribution of bacterial abundances and leucine incorporation rates along the BIOSOPE
cruise transect. All CTD casts performed around 09:00. The main characteristics of the sta-tions sampled are presented Table 1. The scale of leucine incorporation rate was stopped at 150 pmol L−1h−1but higher values were obtained in the upwelling (see Fig. 3). Interpolation
be-tween sampling points in contour plots was made with Ocean Data View program (VG gridding algorithm, Schlitzer, 2004).
BGD
4, 2761–2791, 2007
Heterotrophic bacterial production
in the South East Pacific
F. Van Wambeke et al.
Title Page Abstract Introduction Conclusions References Tables Figures ◭ ◮ ◭ ◮ Back Close
Full Screen / Esc
Printer-friendly Version Interactive Discussion d e p th (m) d e p th (m) d e p th (m) température (°C) SIGMA Theta T Chla (mg m-3 ) primary production (mgC m-3 d-1 ) bacterial abundance (x 106 cells ml-1 )
leu incorporation rate (pmol l-1
h-1 ) MAR 0 50 100 150 200 20 21 22 23 24 25 26 10 15 20 25 30 SIG T 0 50 100 150 200 0 25 50 75 100 0 0.5 1 leu BA UPW 0 50 100 150 200 23 24 25 26 27 28 29 10 15 20 25 30 0 50 100 150 200 0 100 200 300 0 0.5 1 1.5 2 2.5 GYR 0 50 100 150 200 250 300 23 24 25 26 27 28 29 10 15 20 25 30 0 50 100 150 200 250 300 0 10 20 30 40 50 0 0.5 1 0 50 100 150 200 0 25 50 0 0.5 1 PP Tchla 0 50 100 150 200 0 10 20 30 40 50 0 0.5 1 1.5 2 2.5 0 50 100 150 200 250 300 0 1 2 3 4 0.0 0.5 1.0 0 50 100 150 200 250 0 10 20 30 40 50 0 0.5 1 0 50 100 150 200 250 300 0 1 2 3 4 0.0 0.5 1.0 EGY 0 50 100 150 200 250 23 24 25 26 27 28 29 10 15 20 25 30
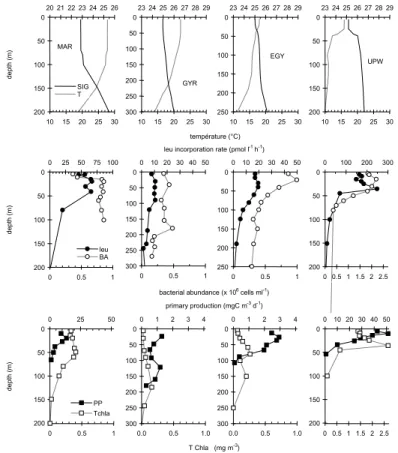
Fig. 3. Example of vertical distribution of some physical (temperature, sigma theta) and
biolog-ical (Tchla, bacterial abundance, leucine incorporation rates, primary production – PPdeck, see methods -) variables at stations meso to eutrophic MAR (26 November) and UPW (7 Decem-ber), and oligotrophic to hyperoligotrophic EGYR (26 November) and GYR (12 November). All variables came from the 09:00 CTD cast except bacterial abundance (the following 12:00 CTD cast).