HAL Id: hal-00304024
https://hal.archives-ouvertes.fr/hal-00304024
Submitted on 6 Mar 2008HAL is a multi-disciplinary open access
archive for the deposit and dissemination of sci-entific research documents, whether they are pub-lished or not. The documents may come from teaching and research institutions in France or abroad, or from public or private research centers.
L’archive ouverte pluridisciplinaire HAL, est destinée au dépôt et à la diffusion de documents scientifiques de niveau recherche, publiés ou non, émanant des établissements d’enseignement et de recherche français ou étrangers, des laboratoires publics ou privés.
Measurements of HNO3 and N2O5 using Ion drift ?
Chemical Ionization Mass Spectrometry during the
MCMA ? 2006 Campaign
J. Zheng, R. Zhang, E. C. Fortner, L. Molina, A. C. Aiken, J. L. Jimenez, K.
Gäggeler, J. Dommen, S. Dusanter, P. S . Stevens, et al.
To cite this version:
J. Zheng, R. Zhang, E. C. Fortner, L. Molina, A. C. Aiken, et al.. Measurements of HNO3 and N2O5 using Ion drift ? Chemical Ionization Mass Spectrometry during the MCMA ? 2006 Campaign. Atmospheric Chemistry and Physics Discussions, European Geosciences Union, 2008, 8 (2), pp.4877-4909. �hal-00304024�
ACPD
8, 4877–4909, 2008
Nitric acid during MCMA 2006 R. Zhang et al. Title Page Abstract Introduction Conclusions References Tables Figures ◭ ◮ ◭ ◮ Back Close
Full Screen / Esc
Printer-friendly Version
Interactive Discussion Atmos. Chem. Phys. Discuss., 8, 4877–4909, 2008
www.atmos-chem-phys-discuss.net/8/4877/2008/ © Author(s) 2008. This work is distributed under the Creative Commons Attribution 3.0 License.
Atmospheric Chemistry and Physics Discussions
Measurements of HNO
3
and N
2
O
5
using
Ion drift – Chemical Ionization Mass
Spectrometry during the MCMA – 2006
Campaign
J. Zheng1, R. Zhang1, E. C. Fortner1,*, L. Molina2, A. C. Aiken3, J. L. Jimenez3, K. G ¨aggeler4, J. Dommen4, S. Dusanter5, P. S .Stevens5, and X. Tie6
1
Dept. Atmospheric Sciences, Texas A & M University, College Station, Texas 77843, TX, USA
2
Molina Center for Energy and the Environment, La Jolla, CA, USA
3
Dept. Chemistry and Biochemistry, University of Colorado, Boulder, CO, USA
4
Laboratory of Atmospheric Chemistry, Paul Scherrer Institute, 5232 Villigen, Switzerland
5
Dept. Chemistry, Indiana University, Bloomington, IN, USA
6
Atmospheric Chemistry Division, National Center for Atmospheric Research, Boulder, CO, USA
*
now at: Dept. Chemistry and Biochemistry, Montana State University, Bozeman, MT, USA Received: 18 January 2008 – Accepted: 22 January 2008 – Published: 6 March 2008 Correspondence to: R. Zhang ([email protected])
ACPD
8, 4877–4909, 2008
Nitric acid during MCMA 2006 R. Zhang et al. Title Page Abstract Introduction Conclusions References Tables Figures ◭ ◮ ◭ ◮ Back Close
Full Screen / Esc
Printer-friendly Version
Interactive Discussion
Abstract
An ion drift – chemical ionization mass spectrometry (ID-CIMS) was deployed in Mex-ico City between 5 and 31 March to measure HNO3and N2O5during the 2006 Mexico
City Metropolitan Area (MCMA) field campaign. The observation site, T0, was located at the Instituto Mexicano del Petr ´oleo at the center of the Mexico City Basin with major
5
emissions of pollutants from both domestic and industrial sources. Diurnally, HNO3
was less than 200 parts per trillion (ppt) during the night and in the early morning, in-creased steadily from around 09:00 a.m. central standard time (CST), reached a peak value of 0.5 to 3 parts per billion (ppb) in the early afternoon, and declined sharply to less than half of the peak value near 05:00 p.m. CST. An inter-comparison between
10
the ID-CIMS and an ion chromatograph/mass spectrometer (ICMS) showed a good correlation in the HNO3 measurements (R
2
=0.75). The HNO3 mixing ratio was found
to anti-correlate with aerosol nitrate, suggesting that the gaseous HNO3
concentra-tion was controlled by the gas-particle particoncentra-tioning process. During most times of the MCMA 2006 field campaign, N2O5 was found to be under the detection limit (about 15
20 ppt for a 10 s integration time) of the ID-CIMS, because of high NO mixing ratio (>100 ppb) during the night. With one exception on 26 March 2006, about 40 ppt N2O5
was observed during the late afternoon and early evening hours under a cloudy condi-tion, before NO built up at the surface site. The results revealed that during the 2006 MCMA field campaign HNO3 was primarily produced by the reaction of OH with NO2
20
and regulated by gas/particle partitioning, and HNO3 production from N2O5hydrolysis
during the nighttime was small because of high NO and low O3 concentrations near
the surface.
1 Introduction
For decades, the Mexico City Metropolitan Area (MCMA), the biggest megacity in the
25
particu-ACPD
8, 4877–4909, 2008
Nitric acid during MCMA 2006 R. Zhang et al. Title Page Abstract Introduction Conclusions References Tables Figures ◭ ◮ ◭ ◮ Back Close
Full Screen / Esc
Printer-friendly Version
Interactive Discussion late matter (Molina and Molina, 2002; Molina et al., 2007). As the home of 20
mil-lion residents, 3.5 milmil-lion vehicles, and 35 000 industries, the MCMA emits annually near 206 kilotons of nitrogen oxides (NOx=NO+NO2), 22.5 kilotons of sulfur dioxide
(SO2), and 1769 kilotons of volatile organic compounds (VOCs) (Molina and Molina,
2002) into the atmosphere, due to both domestic and industrial fossil fuel
consump-5
tions. Furthermore, the unique combination of geographical conditions, i.e. the basin topography, tropical solar radiation (19◦25′N and 99◦10′W), and high elevation (2240 m a.m.s.l.), makes air pollutants easier to accumulate in the MCMA and is favorable for photochemical production of O3and aerosols (Molina and Molina, 2002; Zhang et al.,
2004a). Since 1988, this region annually experiences an hourly average O3 concentra-10
tion higher than 110 ppb for over 80% days and a peak O3concentration of frequently more than 300 ppb (Molina and Molina, 2002). Both VOCs and NOx play critical roles
during O3 formation in the troposphere (Finlayson-Pitts and Pitts, 1999) and the
vari-ations in their concentrvari-ations and the ensuing effects on O3 production rate can be
characterized as either NOx-sensitive or VOC-sensitive (Sillman, 1999; Lei et al., 2004; 15
Zhang et al., 2004b). Recently, based on a model study, Tie et al. (2007) suggested that the O3formation in the MCMA was VOC-limited. The lifecycle of NOxand its bud-get in the MCMA is one of the critical pre-required information to develop effective O3
control strategies (Lei et al., 2007). The dominant daytime sink of NOx is through the
oxidation of NO2by the hydroxyl radical (OH) to form nitric acid (HNO3),
20
NO2+ OH → HNO3 (1)
which is removed from the atmosphere by dry and wet depositions (Finlayson-Pitts and Pitts, 1999). Generally, HNO3deposition is considered as an irreversible sink for NOx,
but recent studies have suggested that HNO3deposited on the surface can be recycled
back into the atmosphere as NOx by heterogeneous reactions with NO (Saliba et al.,
25
2001) and photolysis in the presence of water (Ramazan et al., 2006). Under certain meteorological conditions, HNO3can be transported over 1000 km downwind from the
plume origin, and a HNO3 enriched plume can potentially contribute to O3 production
ACPD
8, 4877–4909, 2008
Nitric acid during MCMA 2006 R. Zhang et al. Title Page Abstract Introduction Conclusions References Tables Figures ◭ ◮ ◭ ◮ Back Close
Full Screen / Esc
Printer-friendly Version
Interactive Discussion During the nighttime, NOxwill titrate O3to form the nitrate radical (NO3),
NO + O3 → NO2+ O2 (2)
NO2+ O3 → NO3+ O2 (3)
NO2+ NO3 ↔ N2O5 (4)
N2O5+ H2O(l) → 2HNO3 (5)
5
which can further react reversibly with NO2 to form dinitrogen pentoxide (N2O5) (for
Reaction 4, Keq=4.5×10⁻¹⁴ exp[−1260/T ] cm3molecule−1s−1, JPL, 2006). At night, NO3can exist in significant concentrations and undergo H-atom abstraction or addition reactions with hydrocarbons in a similar way as OH radicals during daytime (Suh et al., 2001). Comparing with NO3, N2O5 is relatively unreactive, but it can act as a 10
reservoir of NO3 and undergo heterogeneous hydrolysis to form HNO3 (Zhang et al., 1995; Brown et al., 2006). Therefore, in-situ observations of HNO3 and N2O5 are
indispensable to fully characterize the NOx chemistry and budget in the troposphere
and to develop effective control strategies.
Several measurement techniques have been developed to measure gaseous HNO3 15
in the troposphere, including a nylon filter (Anlauf et al., 1988), a mist chamber (Talbot et al., 1990), a denuder technique (Perrino et al., 1990; Simon et al., 1995), a lumi-nol method (Hering et al., 1988), and chemical ionization mass spectrometry (CIMS) (Huey et al., 1998). Among the different approaches, the CIMS technique has the ad-vantages of high sensitivity and fast time-response. Ambient HNO3mixing ratio varies
20
considerably temporally and spatially, with the reported values ranging from a few tens of ppt in clean remote environment to tens of ppb in aged urban plumes (Furutani and Akimoto, 2002; Huey et al., 2004). Despite the importance of N2O5 in the nocturnal NOx chemistry, only recently in situ N2O5 measurements have become possible. In
situ measurements of N2O5 have been performed by a cavity ring-down spectroscopy 25
ACPD
8, 4877–4909, 2008
Nitric acid during MCMA 2006 R. Zhang et al. Title Page Abstract Introduction Conclusions References Tables Figures ◭ ◮ ◭ ◮ Back Close
Full Screen / Esc
Printer-friendly Version
Interactive Discussion observed N2O5concentration ranges from a few ppt to hundreds of ppt (Brown et al.,
2001; 2006; Slusher et al., 2004).
A series of field campaigns have been conducted MCMA such as the 2002, 2003 and 2006 field campaigns. The objectives of these campaigns are to fully characterize the up-to-date air quality, to investigate the underline chemical processes that are
respon-5
sible for secondary air pollutants formations, and to develop effective control strategies. In this paper, we present measurements of HNO3 and N2O5 during the MCMA 2006 campaign from a recently developed ion drift-chemical ionization mass spectrometry (ID-CIMS) technique and its first field deployment. The results provide insights into the production and gas/particle partitioning of HNO3in MCMA.
10
2 Experimental
2.1 ID-CIMS
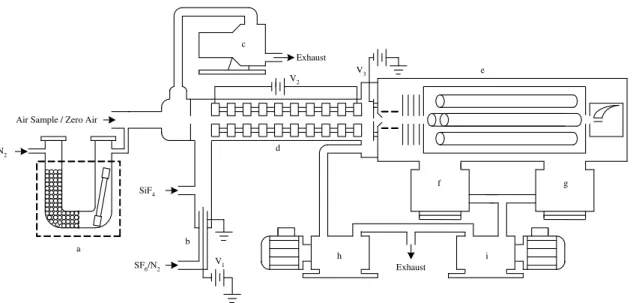
The ID-CIMS method has been previously described (Fortner et al., 2004), and only details pertinent to this work are provided. Figure 1 shows a schematic diagram of the ID-CIMS that consists of an ion-drift tube, an ion source, and a quadrupole mass
15
spectrometer. Also depicted in Fig. 1 is the HNO3 calibration device, which consists
of a U-shape 1-inch outer diameter (OD) and 7-inch long glass tube wrapped with a temperature-regulated heating jacket (the dashed line). The U-tube has two symmetri-cal compartments divided by a glass grid in the middle, with one side housing a 5.0-cm long Teflon permeation tube (VICI Metronics Inc.) and the other filled with 0.5-cm
di-20
ameter glass beads. A corona discharge is used to produce the ion source; it consists of a stainless steel needle typically biased by about −1200 volts (V1) and a grounded
1/4” OD stainless steel tube. A dry scroll pump (Varian) with a 500 liter per minute pumping speed draws the ambient air into the ID-CIMS system. A small portion of the air is introduced into the drift region through an orifice of about 0.5 mm. Within the
25
ACPD
8, 4877–4909, 2008
Nitric acid during MCMA 2006 R. Zhang et al. Title Page Abstract Introduction Conclusions References Tables Figures ◭ ◮ ◭ ◮ Back Close
Full Screen / Esc
Printer-friendly Version
Interactive Discussion the neutral species. The ion-drift tube is pumped by an Edwards E2M30 pump. A
10-ring drift tube sealed inside a heavy wall glass tube is used to guide the reagent ions and to control the ion-molecule reaction time. Each stainless steel ring is 7 mm thick and 40 mm OD and has a 14 mm diameter center hole. The rings are connected in series by three Teflon rods and isolated by 1/8” Nylon spacers. Neighboring rings are
5
connected by a 1.0±5% MΩ resistor. A negative voltage is typically set to develop an electronic field in the drift tube (V2). The reagent and product ions are introduced to the MS system through a pinhole of 400µm, which is also biased negatively (V3). An
Extrel 150-QS mass spectrometer is controlled by the Merlin 3.0 software (Extrel). Two high vacuum stages housing the quadrupole and the electron multiplier are pumped by
10
two Varian TV-551 turbo molecular pumps with a Varian DS402 backing pump. Dur-ing measurements, the dry scroll pump draws a flow of 200 standard liters per minute (slpm) ambient air into the inlet and only one liter air sample is sucked into the drift tube through the front orifice. A N2 flow carrying the reagent ions is mixed with the air sample inside the drift tube and the ion-molecule reaction proceeds throughout the
15
drift region. The typical pressure inside the drift tube is 2.8 torr. The reagent and the product ions are analyzed by the quadrupole mass spectrometer.
The unique character of the ID-CIMS lies in that it enables quantifications of neutral species by controlling the ion-molecule reaction time (∆t),
A + R(+or−) −→ Pk (+or−)+ others (6)
20
where A corresponds to the neutral species to be analyzed and quantified, R repre-sents the reagent ion,k is the reaction rate constant, and P denotes the product ion.
The concentration of the neutral species after the reaction time ∆t is expressed,
[A] = [P
(+or−)]
k∆t[R(+or−)] (7)
where [P(+or−)] and [R(+or−)] correspond to the intensities of product and reagent ions
25
ACPD
8, 4877–4909, 2008
Nitric acid during MCMA 2006 R. Zhang et al. Title Page Abstract Introduction Conclusions References Tables Figures ◭ ◮ ◭ ◮ Back Close
Full Screen / Esc
Printer-friendly Version
Interactive Discussion measurements or theoretical calculations (Zhao et al., 2004). ∆t is determined by the
length of the drift tube and the velocity of the reagent ions, U. While moving along
the drift region with the carrier gas at a flow velocity of (Uf), ions are also driven by a controllable electronic field to achieve a drift velocity (Ud), which is determined by
Ud = µE (8)
5
whereµ is the ionic mobility and E is the electronic field intensity. µ can be calculated
from the reduced ionic mobility,µ0,
µ = µ0(760/p)(T/273.16) (9)
wherep and T are the pressure and temperature inside the drift tube, respectively.
2.2 Ion chemistry
10
The ion chemistry used to detect HNO3 is similarly to that described by Huey and
Lovejoy (1996). The reagent ion, SiF−5, is produced in two steps. A flow of about 300 standard cubic centimeters per minute (sccm) N2doped with<0.1% SF6flows through
the ion source region, where SF6is attached by one electron,
SF6+ e− → SF−6 (10) 15 SF− 6 + SiF4 → SiF − 5 + SF5 (11) SiF− 5 + HNO3 → SiF − 5 · HNO3 (12)
A trace amount of SiF4 is introduced downstream of the ion source and reacts with SF−6 through a fluoride transfer reaction to produce SiF−5. SiF−5 subsequently reacts with HNO3at a rate of (3.8±1)×10−10cm
3
molecule−1s−1(Huey and Lovejoy, 1996) to form
20
SiF−5·HNO3 adduct. During the field campaign, both the isotope peak of the reagent
ion (30SiF−5, m/e=125) and the product ion, SiF−5·HNO3 (m/e=186) are recorded
ACPD
8, 4877–4909, 2008
Nitric acid during MCMA 2006 R. Zhang et al. Title Page Abstract Introduction Conclusions References Tables Figures ◭ ◮ ◭ ◮ Back Close
Full Screen / Esc
Printer-friendly Version
Interactive Discussion N2O5 is detected as the I− reagent ion, which is generated inside the ion source
through electron attachment reaction,
CF3I + e− → I−+ CF3 (13)
I−+ N
2O5 → NO−3+ INO2, (14)
N2O5 subsequently reacts with I− to produce NO−3, with a rate constant of 5
1.3×10⁻⁹cm3molecule−1s−1 (Huey et al., 1995).
The reduced ionic mobilityµ0of SiF−5 and I−are determined according to Mason and
McDaniel (1988), µ0 = 1.85 × 10⁴ ΩpTeff (m + M mM ) 1/2cm2 · V−1· s−1, (15)
whereTeffis the effective temperature of the carrier gas (in K), m and M are the masses
10
(in atomic mass units) of the ion (SiF−
5 or I−) and the carrier gas (N2), respectively, and
Ω is the momentum-transfer collision integral (in cm2). Teffis given by 3 2kbTeff = 3 2kbT + 1 2mU 2 f (16)
wherekbis Boltzmann’s constant andT is the temperature of the carrier gas. Ω is ob-tained from the tabulated values (Viehland et al., 1975) based on ion-neutral interaction
15
potentials. Because no experimental data are available to characterize the ion-neutral interactions in the SiF−
5/N2 or I−/N2 system, we perform ab initio calculations to
ob-tain the ion-neutral interaction potentials using the Gaussian 03 software package on an SGI Origin 3800 supercomputer (Lei et al., 2000; Lei and Zhang, 2001). The ge-ometry optimization and energy calculations at a series of center-to-center distances
20
B3LYP/6-ACPD
8, 4877–4909, 2008
Nitric acid during MCMA 2006 R. Zhang et al. Title Page Abstract Introduction Conclusions References Tables Figures ◭ ◮ ◭ ◮ Back Close
Full Screen / Esc
Printer-friendly Version
Interactive Discussion 31G(d,p) and B3LYP/LANL2DZ, respectively. The results are then fitted with a potential
model V(r) = B r12 − C6 r6 − C4 r4 (17)
where theB term represents the short-range repulsion energy, C6denotes the
charge-induced quadrupole attraction plus the London dispersion attraction, andC4represents 5
the attraction between the ion and the dipole induced in N2. Based on the calculated potential well depth,ε, and the minimum position, rm, the corresponding value of Ω is obtained. Table 1 provides a summary of the calculations. The predicted values ofµ0
for SiF−
5 and I− are 1.89 and 2.09 cm 2
· V−1· s−1, respectively. 2.3 Instrument calibrations
10
The ID-CIMS, in principle, can quantitatively determine the concentration of neutral species using Eq. (7). The accuracy of the calculation is affected by uncertainties as-sociated with several parameters, including the reduced ionic mobility, the ion-molecule reaction rate constants, the transmission efficiencies of the quadrupole mass filter, frag-mentation in the ion-molecule reaction, and etc. These parameters are invariant under
15
given experimental conditions and their uncertainties are minimized by calibration with known concentration gas standards.
The HNO3calibration employs a permeation device, as shown in Fig. 1. The
perme-ation device (Fig. 1a) is heated and maintained at 40.0◦C. About 400 to 500 sccm N2 carrier gas is fed into the side filled with glass beads and warmed to the same
tempera-20
ture as the entire device before entering the permeation tube side. After the permeation device, the concentrated HNO3/N2 stream is injected into a 1-inch OD Teflon tube in which they are mixed with a 20 to 150 slpm dilution flow. The concentrations of the exiting HNO3 flow ranges between 0.25 and 2 ppb. Prior to each calibration, the
per-meation device is maintained at an operational condition for more than 6 h to achieve
25
ACPD
8, 4877–4909, 2008
Nitric acid during MCMA 2006 R. Zhang et al. Title Page Abstract Introduction Conclusions References Tables Figures ◭ ◮ ◭ ◮ Back Close
Full Screen / Esc
Printer-friendly Version
Interactive Discussion Due to the “sticky” nature of HNO3, it is necessary to verify the effective permeation
rate under the normal operation condition to account for any possible wall loss during the preparation of the calibration standards. The procedure to verify the permeation rate is similar to the calibration process, but, instead of introducing the HNO3standards into the ID-CIMS for calibration, the HNO3 standard is introduced to a glass bubbler 5
containing a specific amount of pure water (R>17 MΩ) for a specific time. All tubing is
passivated by the HNO3standard for a few hours before the final solution is collected. The HNO3 solution is analyzed by ion chromatography (DIONEX), which is calibrated
by ultra pure sodium nitrate (Sigma-Aldrich) solutions. The measured permeation rate is 109±1.2 ng/min, within 10% of the manufacture certified value (116 ng/min).
10
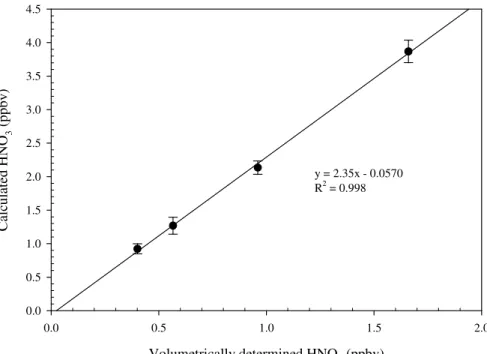
Figure 2 shows a correlation between the volumetrically determined HNO3 stan-dard concentration and the calculated concentration using the procedure described in Sect. 2.1. The error bars represent the systematic variation in measurements. The value of the slope of Fig. 2 corresponds to the calibration factor used to compensate the difference between the true values and the adapted values of the calculation
param-15
eters, i.e., the ion-molecule reaction rate constant, reduced ionic mobility, quadrupole transmission efficiency, and etc. For five independent calibrations at 25◦C, a calibration
factor of 2.2±0.2 is obtained.
N2O5 calibration is conducted with laboratory synthesized samples (Huey et al.,
1995). N2O5 is formed through two sequential reactions (Reactions 3 and 4). O3
20
and NO2 are mixed in a sealed glass reactor and the produced N2O5 is collected in
a cryotrap (−78.5◦C) as white crystal. The first batch of N2O5is discarded to remove
the water residue inside the cryotrap. During calibration, pure N2O5 is kept in an oc-tanol/dry ice bath (−57◦C). A small amount of dry N2 flows through the container and
carries N2O5 vapor into a 10-cm long absorption cell inside a UV/VIS spectrometer 25
(Perkin Elmer), where the absolute concentration of N2O5 is measured by its absorp-tion at 215 nm (σ=2.95×10⁻¹⁸cm2
molecule−1, JPL 2006). The concentrated N2O5
flow is diluted into a 140 slpm flow and analyzed by the ID-CIMS. Because N2O5 is
ACPD
8, 4877–4909, 2008
Nitric acid during MCMA 2006 R. Zhang et al. Title Page Abstract Introduction Conclusions References Tables Figures ◭ ◮ ◭ ◮ Back Close
Full Screen / Esc
Printer-friendly Version
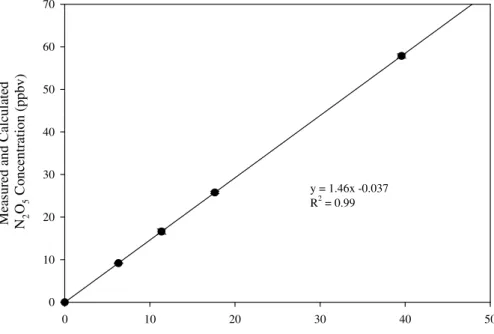
Interactive Discussion detected, we estimate its potential interference and find that only less than 6% of initial
N2O5decomposes into NO3at room temperature. Figure 3 shows the plots of the N2O5 concentrations measured by ID-CIMS against the concentrations determined from UV absorption. The slope in Fig. 3 represents the calibration factor.
During the field measurements, HNO3 background checks are performed once a
5
few hours by directing the ambient air flow through a two-inch OD nylon filter. N2O5
background signal is checked by passing the ambient air mixed with several hundreds of ppb NO through a 12-in-long heated metal tubing. Detection limits of HNO3 and N2O5for 10 s integration time are estimated about 100 ppt and 20 ppt, respectively.
2.4 Field setup and characterization of the inlet
10
The ID-CIMS instrument was deployed at the T0 supersite, located at the Instituto Mexicano del Petr ´oleo (IMP) near the center of the Mexico City Basin (19◦29.400′ N,
99◦08.911′ W). The ID-CIMS was housed inside an air-conditioned hut on the roof of Bldg. 32, which was about 30 m above the ground and among a cluster of buildings with the similar height. A 2.20 cm ID PFA tubing was used as the inlet, which had
15
been proved to be the best inlet material (Neuman et al., 1999). In order to minimize the surface effect, ambient air was sampled from two feet above the hut ceiling, and the inlet length was about 12 feet to bring the air sample into the ID-CIMS, located a few inches away from the sampling window. During most times of the field campaign, the weather was dry and relatively cold. Because HNO3 gas-aerosol partitioning was 20
sensitive to temperature variations, no heating was applied to the HNO3inlet. Instead, the sampling flow rate was kept at 200 slpm to minimize the sampling residence time (0.42 s) and the entire inlet was kept under the ambient conditions.
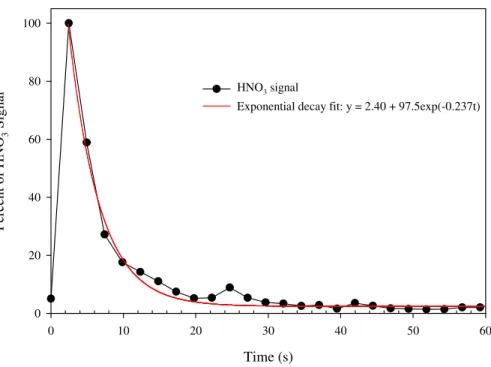
In order to characterize the inlet performance, several tests were conducted by ex-posing the inlet to HNO3(performed at 760 torr, 25◦C, RH=50%). The front of the inlet 25
was exposed to a solution of 68 wt% HNO3for less than one second and the ID-CIMS
was set to collect data at 0.4 Hz. As shown in Fig. 4, a spike of about 40 ppb HNO3 was detected by the ID-CIMS within 3 s and the HNO3 signal immediately decreased
ACPD
8, 4877–4909, 2008
Nitric acid during MCMA 2006 R. Zhang et al. Title Page Abstract Introduction Conclusions References Tables Figures ◭ ◮ ◭ ◮ Back Close
Full Screen / Esc
Printer-friendly Version
Interactive Discussion by about 80% after 9 s. The decay in the HNO3signal was well-fixed by an exponential
decay function ([HNO3]=2.4+97.5 exp(−0.237t), showing that the inlet had little
mem-ory effect. The influence between adjacent data points was less than 20% relative to each other, if data were collected within every 9 s.
The inlet for N2O5measurements was also made from 2.2 cm ID Teflon tubing except 5
that its length was only 2 ft to minimize surface loss.
An Aerodyne aerosol mass spectrometer (AMS) was used to measure the chemical composition of non-refractory aerosols from 35 nm to 1.5µm in size. This version of
AMS was equipped with a high-resolution time-of-flight mass analyzer and was capa-ble of analyzing organic species and most nitrate and sulfate compounds of different
10
elemental compositions at the same nominalm/z. More details about the AMS were
described by DeCarlo et al. (2006).
An ICMS was set up at T0 to measure both gas and aerosol phase acids. Air was aspired through a wet effluent diffusion denuder (WEDD) at 2 L/min to sample the gas phase acids. Water was continuously pumped through the denuder at a flow rate of
15
2 mL/min at counter flow to the air. The air to the aerosol collector (AC) first passed at 4 L/min through an activated charcoal denuder to remove the gas phase. The air stream was mixed with heated water vapor (100◦C and a flow rate of 0.6 ml/min), which condensed on the aerosol particles. These droplets impacted on a cooled maze (Fis-seha et al., 2006). The gas phase as well as the particle phase extracts were collected
20
on a concentrator column (TAC-LP1, Dionex) and analyzed alternately using ion chro-matography (conductivity detector) with a mass spectrometer in a quasi-continuous mode. The mass spectrometer (MSQ from Dionex) used electro-spray ionization and had a single quadrupole mass detector.
NOx and O3 data used in this work were measured by commercial instruments 25
(Thermo Scientific). Both instruments were regularly calibrated during the campaign. The detection limits were 0.2 ppb for each species and the data were collected at 1-min interval.
ACPD
8, 4877–4909, 2008
Nitric acid during MCMA 2006 R. Zhang et al. Title Page Abstract Introduction Conclusions References Tables Figures ◭ ◮ ◭ ◮ Back Close
Full Screen / Esc
Printer-friendly Version
Interactive Discussion
3 Results and discussion
3.1 HNO3Measurements
The measurements of HNO3 and N2O5 were conducted from 7 March to 30 March during the MCMA 2006. Due to a power supply failure, measurements from 13 March to 17 March were not available. The ID-CIMS was typically setup to measure HNO3 5
during the daytime and after sunset it was switched to the N2O5measurement. All data was collected at 0.1 Hz and presented in CST.
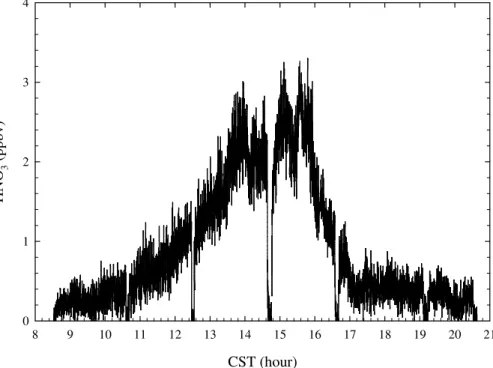
Figure 5 shows a diurnal profile of HNO3 observed on 22 March, a sunny and hazy
day. Due to its photochemical production nature, HNO3 started to slowly accumulate right after sunrise. From 08:30 a.m. to 10:00 a.m., about 200 ppt HNO3was observed 10
and no significant increase occurred before 11:00 a.m. After a steadily increase, HNO3
reached near 3 ppb at 02:00 p.m., when the photochemical activity reached the maxi-mum. From 02:00 p.m. to 04:00 p.m., HNO3reached a peak, and started to decrease
sharply after 04:00 p.m. Within one and half hours, only about 400 ppt was observed. HNO3did not totally disappear even after it was completely dark, indicating that there
15
were likely other HNO3 sources sustaining its present. However, when the ID-CIMS
was switched into the N2O5mode, no detectable N2O5was observed.
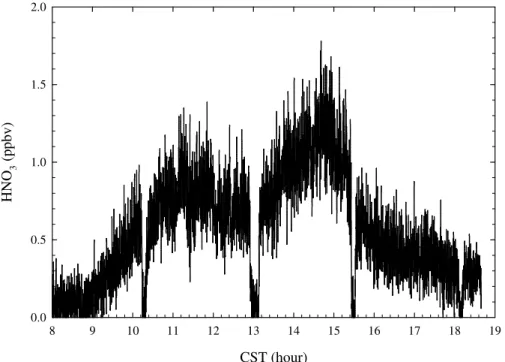
Figure 6 depicts another HNO3diurnal profile observed on 23 March, which was rel-atively cleaner and windier than the previous day. Before 09:00 a.m., HNO3was close
the instrument detection limit. Shortly after, HNO3increased steadily to about 1 ppb at 20
11:30 a.m. and, then, started to decrease to 600 ppt at 01:00 p.m., when HNO3 produc-tion was supposedly to be maximized. Around 02:45 p.m., HNO3 started to increase
again and reached a daily maximum 1.5 ppb. HNO3 decreased steadily to 400 ppt at
04:00 p.m. Similar to the previous day observation, near 300 ppt HNO3 was still ob-servable at about 06:30 p.m. Also, when the ID-CIMS was switched into the N2O5 25
mode, no N2O5 was observable. Note that 22 March and 23 represented the typical
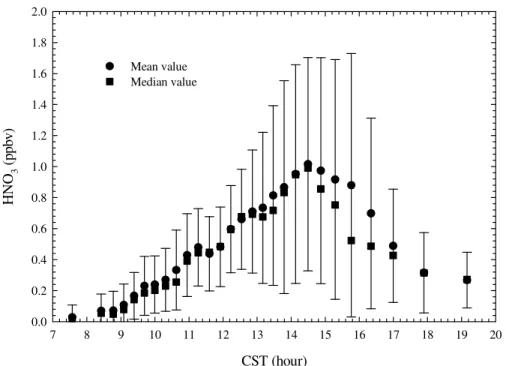
polluted and clean conditions encountered during the field campaign, respectively. Figure 7 shows the HNO3 diurnal profile averaged over the entire campaign.
Typ-ACPD
8, 4877–4909, 2008
Nitric acid during MCMA 2006 R. Zhang et al. Title Page Abstract Introduction Conclusions References Tables Figures ◭ ◮ ◭ ◮ Back Close
Full Screen / Esc
Printer-friendly Version
Interactive Discussion ically, no significant HNO3 was observed before 08:00 a.m., and HNO3 started to
accumulate after 09:00 a.m. and reached daily high, 1±0.65 ppb, between 02:00 to 03:00 p.m. After 04:00 p.m., HNO3decreased rapidly to less than 0.4 ppb at 06:00 p.m.
and gradually approached 200 ppt, before the ID-CIMS was switched to N2O5 measure-ments. The occurrence of the HNO3 daily peak was consistent with its photochemical 5
production mechanism, however the magnitude of the HNO3peak was lower than that
expected given the overwhelming NOxemission inventory in the MCMA and the strong tropical solar radiation. Another interesting observation was that several hundred ppt HNO3 was still detected several hours after sunset. Since no significant N2O5 was
present, the nighttime production of HNO3from the hydrolysis of N2O5(through
Reac-10
tions 2 to 5) could not proceed.
It is evident that the gas-phase chemistry alone could not explain the observed slow rise in the HNO3 diurnal profiles after sunrise and the residual HNO3 amount after
sunset during MCMA 2006. Heterogeneous processing of HNO3 in the particle phase needs to be accounted for to explain the HNO3 measurements (Zhang et al., 1993). 15
It has been suggested that the heterogeneous reaction between HNO3 and NH3 in
the particle-phase represents an important process to modulate the gaseous HNO3 concentration (Seinfeld and Pandis, 1998),
HNO3(g) + NH3(g) ↔ NH4NO3(s) (18)
Depending on the ambient relative humidity (RH), ammonium nitrate formed in
Reac-20
tion 18 can exist as a solid or an aqueous solution of NH+4 and NO−3. The equilibrium constant,Kp, is dependent on the temperature,
lnKp= 84.6 − (24220/T ) − 6.1 × ln(T/298) (19)
For the measurements relevant to MCMA 2006, the RH was fairly low (<41% averaged
over the campaign period). The dry environment at the MCMA prevented NH4NO3 25
from deliquescence and NH4NO3 was expected in a solid state. High ammonia (NH3)
ACPD
8, 4877–4909, 2008
Nitric acid during MCMA 2006 R. Zhang et al. Title Page Abstract Introduction Conclusions References Tables Figures ◭ ◮ ◭ ◮ Back Close
Full Screen / Esc
Printer-friendly Version
Interactive Discussion campaign (Moya et al., 2004). Although no direct measurements of NH3was available
at T0 during MCMA 2006, its concentration is expected to be high, given that both population and traffic activity inside the MCMA maintained an increasing trend since 2003.
Figure 8 shows a comparison between gaseous HNO3 and aerosol nitrate (NO− 3) 5
mass concentration measured by an Aerodyne aerosol mass spectrometer (AMS) on 22 and 23 March. The calculated equilibrium constant (Kp) of Reaction 18 is also plotted in Fig. 8, which is a function of ambient temperature. There are several promi-nent features in Fig. 8. The aerosol nitrate NO−3 started to increase right after sunrise and reached a maximum in the early morning. The aerosol nitrate peak occurred
sev-10
eral hours earlier than that of the gaseous HNO3 concentration. The aerosol nitrate dropped sharply after the morning peak and remained low throughout the afternoon and night hours. During each day, the measured HNO3 concentration and the
calcu-latedKpwere anti-correlated with NO−3. On the other hand, there appeared to have a
good correlation between the measured HNO3 concentration and calculatedKp: both
15
slowly increased at the morning hours and their peaks coincided. Hence, the slow rise in the measured HNO3 concentration is likely explained by gas/aerosol partitioning. HNO3photochemically produced from Reaction 1 was scavenged from the gas phase
by the particle-phase reaction with NH3to form aerosol nitrate, when ambient
temper-ature was low and aerosol nitrate was favorable (Kp<6). The gas/aerosol partitioning
20
hence accounts for the delayed rise and daily maximum of measured HNO3compared
to those of measured aerosol nitrate. As the temperature rose during the course of the day, the equilibrium favored gaseous HNO3. HNO3 was released back to gas-phase from the evaporation of aerosol nitrate, even when its photochemical production de-creased. After sunset, the HNO3photochemical production ceased, as reflected in the 25
sharp decrease in measured HNO3, while a few hundreds of ppt HNO3were still mea-sured. Since detectable NO−3 was present and no detectable N2O5was observed, the
lingering nighttime HNO3likely originated from the residue ammonium nitrate aerosol,
ACPD
8, 4877–4909, 2008
Nitric acid during MCMA 2006 R. Zhang et al. Title Page Abstract Introduction Conclusions References Tables Figures ◭ ◮ ◭ ◮ Back Close
Full Screen / Esc
Printer-friendly Version
Interactive Discussion aerosol nitrate corresponded to a higher HNO3 peak, when the difference in Kp was
insignificant. This explains the difference in the measurements of NO−3 and HNO3
be-tween 22 and 23 March 2006. Therefore, we concluded that during MCMA 2006 at T0 gas/particle partitioning played a key role to account for the measurements in gaseous HNO3and aerosol nitrate.
5
The magnitude and diurnal cycle of aerosol nitrate during the MCMA 2003 was re-ported by Salcedo et al. (2006). In the morning, particulate nitrate increased and was consistent with the production of nitric acid. However, after 11:00 a.m. aerosol nitrate decreased while HNO3 production continued. This observation was explained by the increase in the PBL height and temperature and the decrease in the RH as the day
pro-10
gressed. Also, it has been suggested that gas-particle partitioning plays a dominant role in the fate of aerosol nitrate over larger spatial scales (DeCarlo et al., 2007). 3.2 N2O5measurements
The ID-CIMS instrument was typically switched to conduct N2O5measurements after
sunset during the 2006 MCMA campaign. During most times of the campaign,
night-15
time N2O5was below the detection limit of the instrument. Because NO concentration
frequently exceeded 100 ppb after 07:00 p.m. and O3 was quickly depleted by the
freshly emitted NO, Reactions 3 and 4 were inhibited at the surface level. Therefore, NO3 and N2O5 did not play a major role during the nighttime chemistry on the
sur-face. It was still likely that some HNO3might be formed above the planetary boundary 20
layer (PBL) where the N2O5chemistry was still occurring at night and mixed downward (Stutz et al., 2004). However, as an exception, two N2O5peaks were observed in the
late afternoon and early evening on March 26 (Fig. 9). There was a scattered shower started in the early afternoon and no HNO3 was observed thereafter. At 04:00 p.m., the rain stopped and the sky remained cloudy, and O3 and NO2 were about 60 ppb 25
and 20 ppb, respectively. Meanwhile, the NO concentration was less than 2 ppb. The ID-CIMS was switched to the N2O5 mode at 04:20 p.m. and continued the
ACPD
8, 4877–4909, 2008
Nitric acid during MCMA 2006 R. Zhang et al. Title Page Abstract Introduction Conclusions References Tables Figures ◭ ◮ ◭ ◮ Back Close
Full Screen / Esc
Printer-friendly Version
Interactive Discussion only 3 ppb. Background checks were performed at the beginning and the end of the
measurement. Two N2O5 peaks near 40 ppt were observed around 05:00 p.m. and 08:00 p.m., when both NO2 and O3 were still substantial, but no fresh NO emission
was present. From 05:45 p.m. to 07:20 p.m., the T0 site was hit by another intermittent shower, and no N2O5was observed and the NOxand O3instruments were off-line for
5
calibrations. After 07:30 p.m., O3was anti-correlated with NO2due to the NO titration.
About 08:50 p.m., NO started to increase significantly and nearly all O3was depleted,
as N2O5 disappeared. Although the ID-CIMS could also response to NO3 radical as NO−3 at the same m/e=62 peak, NO3 radical was estimated to be less than 4% of
the N2O5 signal assuming that Reaction 4 was under thermodynamic equilibrium and 10
using the observed NO2and O3concentrations. 3.3 Inter-comparison with ICMS
An ICMS instrument was set up side-by-side with the ID-CIMS during the MCMA 2006 field campaign. The ICMS utilized a denuder to selectively collect gas phase HNO3
into aqueous solutions, which were then analyzed by an electrospray mass
spectrom-15
eter. The ICMS generated one data point about every two hours, thus its time series could not match with the temporal resolution of about 10 s from the ID-CIMS measure-ments. We compared the results between the two instruments for periods when both instruments were collecting data and the ID-CIMS data were averaged to represent the data during a similar period. The results were plotted in Fig. 10. A good correlation
20
in performance was found (R2=0.75) between the two techniques. We also performed at-test for these two set of data and a P value of 0.68 further proved that statistically
these two techniques reported the same results. The ID-CIMS data set was about 17% lower than the ICMS data set, and the intersection was well below the detection limit of either instrument.
ACPD
8, 4877–4909, 2008
Nitric acid during MCMA 2006 R. Zhang et al. Title Page Abstract Introduction Conclusions References Tables Figures ◭ ◮ ◭ ◮ Back Close
Full Screen / Esc
Printer-friendly Version
Interactive Discussion
4 Conclusions
We deployed an ID-CIMS during the MCMA 2006 campaign to measure HNO3 and
N2O5 at the T0 site. The objective of this work is to characterize the NOx chem-istry and its budget in the MCMA. Diurnally, HNO3 was less than 200 parts per
tril-lion (ppt) during the night and in the early morning, increased steadily from around
5
09:00 a.m. CST, reached a peak value of 0.5 to 3 parts per billion (ppb) in the early af-ternoon, and declined sharply to less than half of the peak value near 05:00 p.m. CST. The HNO3mixing ratio was found to anti-correlate with aerosol nitrate, suggesting that
the gaseous HNO3 concentration was regulated by the gas-particle partitioning pro-cess. Inter-comparison between the ID-CIMS and the ICMS showed a good agreement
10
(R2=0.75) in HNO3measurements. During most times of the MCMA 2006 campaign,
N2O5 was below the detection limit of the ID-CIMS due to high NO mixing ratio at the
surface, with one exception of transient N2O5peaks of 40 ppt were encountered on 26 March under cloudy conditions. The results reveal that during the MCMA 2006 cam-paign HNO3 was primarily produced through the photochemical process and HNO3 15
diurnal profile was largely controlled by the gas/particle partitioning process.
Acknowledgements. This research was funded by the Center for Atmospheric Chemistry and
Environment at the Texas A & M University. The authors were grateful to N. A. Marley and J. S. Gaffney for providing the temperature and RH data.
References 20
Anlauf, K. G., Mactavish, D. C., Wiebe, H. A., Schiff, H. I., and Mackay, G. I.: Measurement of atmospheric nitric-acid by the filter method and comparisons with the tunable diode-laser and other methods, Atmos. Environ., 22, 1579–1586, 1988.
Brown, S. S., Stark, H., Ciciora, S. J., and Ravishankara, A. R.: In-situ measurement of atmo-spheric NO3 and N2O5 via cavity ring-down spectroscopy, Geophys. Res. Lett., 28, 3227–
25
ACPD
8, 4877–4909, 2008
Nitric acid during MCMA 2006 R. Zhang et al. Title Page Abstract Introduction Conclusions References Tables Figures ◭ ◮ ◭ ◮ Back Close
Full Screen / Esc
Printer-friendly Version
Interactive Discussion
Brown, S. S., Stark, H., Ciciora, S. J., McLaughlin, R. J., and Ravishankara, A. R.: Simultane-ous in situ detection of atmospheric NO3and N2O5via cavity ring-down spectroscopy, Rev. Sci. Instrum., 73, 3291–3301, 2002.
Brown, S. S., Ryerson, T. B., Wollny, A. G., Brock, C. A., Peltier, R., Sullivan, A. P., Weber, R. J., Dube, W. P., Trainer, M., Meagher, J. F., Fehsenfeld, F. C., and Ravishankara, A. R.:
5
Variability in nocturnal nitrogen oxide processing and its role in regional air quality, Science, 311, 67–70, 2006.
DeCarlo, P. F., Kimmel, J. R., Trimborn, A., Northway, M. J., Jayne, J. T., Aiken, A. C., Go-nin, M., Fuhrer, K., Horvath, T., Docherty, K. S., Worsnop, D. R., and Jimenez, J. L.: Field-deployable, high-resolution, time-of-flight aerosol mass spectrometer, Anal. Chem., 78,
10
8281–8289, 2006.
DeCarlo, P. F., Dunlea, E. J., Kimmel, J. R., Aiken, A. C., Sueper, D., Crounse, J., Wennberg, P. O., Emmons, L., Shinozuka, Y., Clarke, A., Zhou, J., Tomlinson, J., Collins, D. R., Knapp, D., Weinheimer, A. J., Montzka, D. D., Campos, T., and Jimenez, J. L.: Fast airborne aerosol size and chemistry measurements with the high resolution aerosol mass spectrometer during the
15
milagro campaign, Atmos. Chem. Phys. Discuss., 7, 18 269–18 317, 2007.
Fisseha, R., Dommen, J., Gaeggeler, K., Weingartner, E., Samburova, V., Kalberer, M., and Baltensperger, U.: Online gas and aerosol measurement of water soluble carboxylic acids in zurich, J. Geophys. Res., 111, D12316, doi:10.1029/2005JD006782, 2006.
Finlayson-Pitts, B. J. and Pitts, J. N.: Chemistry of the upper and lower atmosphere : Theory,
20
experiments and applications, Academic Press, San Diego, Calif., xxii, 969 pp., 1999. Fortner, E. C., Zhao, J., and Zhang, R. Y.: Development of ion drift-chemical ionization mass
spectrometry, Anal. Chem., 76, 5436–5440, 2004.
Furutani, H. and Akimoto, H.: Development and characterization of a fast measurement sys-tem for gas-phase nitric acid with a chemical ionization mass spectrometer in the marine
25
boundary layer, J. Geophys. Res.-Atmos., 107, 4016, doi:10.1029/2000JD000269, 2002. Hering, S. V., Lawson, D. R., Allegrini, I., Febo, A., Perrino, C., Possanzini, M., Sickles, J. E.,
Anlauf, K. G., Wiebe, A., Appel, B. R., John, W., Ondo, J., Wall, S., Braman, R. S., Sutton, R., Cass, G. R., Solomon, P. A., Eatough, D. J., Eatough, N. L., Ellis, E. C., Grosjean, D., Hicks, B. B., Womack, J. D., Horrocks, J., Knapp, K. T., Ellestad, T. G., Paur, R. J., Mitchell,
30
W. J., Pleasant, M., Peake, E., Maclean, A., Pierson, W. R., Brachaczek, W., Schiff, H. I., Mackay, G. I., Spicer, C. W., Stedman, D. H., Winer, A. M., Biermann, H. W., and Tuazon, E. C.: The nitric-acid shootout – field comparison of measurement methods, Atmos. Environ.,
ACPD
8, 4877–4909, 2008
Nitric acid during MCMA 2006 R. Zhang et al. Title Page Abstract Introduction Conclusions References Tables Figures ◭ ◮ ◭ ◮ Back Close
Full Screen / Esc
Printer-friendly Version
Interactive Discussion
22, 1519–1539, 1988.
Huey, L. G., Hanson, D. R., and Howard, C. J.: Reactions of SF−6 and I−with atmospheric trace gases, J. Phys. Chem., 99, 5001–5008, 1995.
Huey, L. G. and Lovejoy, E. R.: Reactions of SiF−5 with atmospheric trace gases: Ion chemistry for chemical ionization detection of HNO3in the troposphere, Int. J. Mass. Spectrom., 155,
5
133–140, 1996.
Huey, L. G., Dunlea, E. J., Lovejoy, E. R., Hanson, D. R., Norton, R. B., Fehsenfeld, F. C., and Howard, C. J.: Fast time response measurements of HNO3in air with a chemical ionization mass spectrometer, J. Geophys. Res.-Atmos., 103, 3355–3360, 1998.
Huey, L. G., Tanner, D. J., Slusher, D. L., Dibb, J. E., Arimoto, R., Chen, G., Davis, D., Buhr,
10
M. P., Nowak, J. B., Mauldin, R. L., Eisele, F. L., and Kosciuch, E.: CIMS measurements of HNO3 and SO2at the south pole during ISCAT 2000, Atmos. Environ., 38, 5411–5421, 2004.
Huey, L. G.: Measurement of trace atmospheric species by chemical ionization mass spec-trometry: Speciation of reactive nitrogen and future directions, Mass Spectrom. Rev., 26,
15
166–184, 2007.
JPL: Chemical Kinetics and Photochemical Data for Use in Atmospheric Studies Evaluation Number 15, National Aeronautics and Space Administration, Jet Propulsion Laboratory, Cal-ifornia Institute of Technology, Pasadena, Calif., 5–77, 2006.
Lei, W., de Foy, B., Zavala, M., Volkamer, R., and Molina, L. T.: Characterizing ozone production
20
in the Mexico City metropolitan area: A case study using a chemical transport model, Atmos. Chem. Phys., 7, 1347–1366, 2007,http://www.atmos-chem-phys.net/7/1347/2007/.
Lei, W. F., Derecskei-Kovacs, A., and Zhang, R. Y.: Ab initio study of oh addition reaction to isoprene, J. Chem. Phys., 113, 5354–5360, 2000.
Lei, W. F. and Zhang, R. Y.: Theoretical study of hydroxylisoprene alkoxy radicals and their
25
decomposition pathways, J. Phys. Chem. A, 105, 3808–3815, 2001.
Lei, W. F., Zhang, R. Y., Tie, X. X., and Hess, P.: Chemical characterization of ozone formation in the Houston-Galveston area: A chemical transport model study, J. Geophys. Res.-Atmos., 109, D12301, doi:10.1029/2003JD004219, 2004.
Mason, E. A. and McDaniel, E. W.: Transport properties of ions in gases, Wiley, New York, xvi,
30
560 pp., 1988.
Molina, L. T., Molina, M. J., and Alliance for Global Sustainability: Air quality in the Mexico megacity: An integrated assessment, Alliance for global sustainability bookseries; 2, Kluwer
ACPD
8, 4877–4909, 2008
Nitric acid during MCMA 2006 R. Zhang et al. Title Page Abstract Introduction Conclusions References Tables Figures ◭ ◮ ◭ ◮ Back Close
Full Screen / Esc
Printer-friendly Version
Interactive Discussion
Academic Publishers, Dordrecht; Boston, xxi, 384 pp., 2002.
Molina, L. T., Kolb, C. E., de Foy, B., Lamb, B. K., Brune, W. H., Jimenez, J. L., Ramos-Villegas, R., Sarmiento, J., Paramo-Figueroa, V. H., Cardenas, B., Gutierrez-Avedoy, V., and Molina, M. J.: Air quality in north America’s most populous city–overview of the MCMA-2003 campaign, Atmos. Chem. Phys., 7, 2447–2473, 2007,
5
http://www.atmos-chem-phys.net/7/2447/2007/.
Moya, M., Grutter, M., and Baez, A.: Diurnal variability of size-differentiated inorganic aerosols and their gas-phase precursors during January and February of 2003 near downtown Mexico City, Atmos. Environ., 38, 5651–5661, 2004.
Neuman, J. A., Huey, L. G., Ryerson, T. B., and Fahey, D. W.: Study of inlet materials for
10
sampling atmospheric nitric acid, Environ. Sci. Technol., 33, 1133–1136, 1999.
Perrino, C., Desantis, F., and Febo, A.: Criteria for the choice of a denuder sampling technique devoted to the measurement of atmospheric nitrous and nitric-acids, Atmos. Environ. A-Gen., 24, 617–626, 1990.
Ramazan, K. A., Wingen, L. M., Miller, Y., Chaban, G. M., Gerber, R. B., Xantheas, S. S.,
15
and Finlayson-Pitts, B. J.: New experimental and theoretical approach to the heterogeneous hydrolysis of no2: Key role of molecular nitric acid and its complexes, J. Phys. Chem. A, 110, 6886–6897, doi:10.1021/Jp056426n, 2006.
Saliba, N. A., Yang, H., and Finlayson-Pitts, B. J.: Reaction of gaseous nitric oxide with nitric acid on silica surfaces in the presence of water at room temperature, J. Phys. Chem. A, 105,
20
10 339–10 346, doi:10.1021/Jp012330r, 2001.
Salcedo, D., Onasch, T. B., Dzepina, K., Canagaratna, M. R., Zhang, Q., Huffman, J. A., De-Carlo, P. F., Jayne, J. T., Mortimer, P., Worsnop, D. R., Kolb, C. E., Johnson, K. S., Zuberi, B., Marr, L. C., Volkamer, R., Molina, L. T., Molina, M. J., Cardenas, B., Bernabe, R. M., Marquez, C., Gaffney, J. S., Marley, N. A., Laskin, A., Shutthanandan, V., Xie, Y., Brune,
25
W., Lesher, R., Shirley, T., and Jimenez, J. L.: Characterization of ambient aerosols in mex-ico city during the mcma-2003 campaign with aerosol mass spectrometry: Results from the cenica supersite, Atmos. Chem. Phys., 6, 925–946, 2006,
http://www.atmos-chem-phys.net/6/925/2006/.
Seinfeld J. H. and Pandis, S. N.: From air pollution to climate change, Wiley, New York, xxvii,
30
Atmos. Chem. Phys., 1326 pp., 1998.
Sillman, S.: The relation between ozone, NOx and hydrocarbons in urban and polluted rural environments, Atmos. Environ., 33, 1821–1845, 1999.
ACPD
8, 4877–4909, 2008
Nitric acid during MCMA 2006 R. Zhang et al. Title Page Abstract Introduction Conclusions References Tables Figures ◭ ◮ ◭ ◮ Back Close
Full Screen / Esc
Printer-friendly Version
Interactive Discussion
Simon, P. K. and Dasgupta, P. K.: Continuous automated measurement of gaseous nitrous and nitric-acids and particulate nitrite and nitrate, Environ. Sci. Technol., 29, 1534–1541, 1995. Slusher, D. L., Huey, L. G., Tanner, D. J., Flocke, F. M., and Roberts, J. M.: A thermal
dissociation-chemical ionization mass spectrometry (td-cims) technique for the simultane-ous measurement of peroxyacyl nitrates and dinitrogen pentoxide, J. Geophys. Res.-Atmos.,
5
109, D19315, 2004.
Stutz, J., Alicke, B., Ackermann, R., Geyer, A., White, A., and Williams, E.: Vertical profiles of NO3, N2O5, O3, and NOxin the nocturnal boundary layer: 1. Observations during the texas air quality study 2000, J. Geophys. Res., 109, D12306, doi:10.1029/2003JD004209, 2004. Suh, I., Lei, W. F., and Zhang, R. Y.: Experimental and theoretical studies of isoprene reaction
10
with NO3, J. Phys. Chem. A, 105, 6471–6478, 2001.
Talbot, R. W., Vijgen, A. S., and Harriss, R. C.: Measuring tropospheric hno3 - problems and prospects for nylon filter and mist chamber techniques, J. Geophys. Res.-Atmos., 95, 7553– 7561, 1990.
Tie, X. X., Madronich, S., Li, G. H., Ying, Z. M., Zhang, R. Y., Garcia, A. R., Lee-Taylor, J.,
15
and Liu, Y. B.: Characterizations of chemical oxidants in mexico city: A regional chemical dynamical model (wrf-chem) study, Atmos. Environ., 41, 1989–2008, 2007.
Viehland, L. A., Mason, E. A., Morrison, W. F., and Flannery, M. R.: Tables of transport collision integrals for (n, 6, 4) ion-neutral potentials, Atom. Data Nucl. Data, 16, 495–514, 1975. Zhang, R., Wooldridge, P. J., and Molina, M. J.: Vapor pressure measurements for the
20
H2SO4/HNO3/H2O and H2SO4/HCl/H2O systems: Incorporation of stratospheric acids into background sulfate aerosols, J. Phys. Chem., 97, 8541–8548, 1993.
Zhang, R. Y., Leu, M. T., and Keyser, L. F.: Hydrolysis of N2O5 and ClONO2 on the H2SO4/HNO3/H2O ternary solutions under stratospheric conditions, Geophys. Res. Lett., 22, 1493–1496, 1995.
25
Zhang, R. Y., Lei, W. F., Tie, X. X., and Hess, P.: Industrial emissions cause extreme urban ozone diurnal variability, P. Natl. Acad. Sci. USA, 101, 6346–6350, 2004a.
Zhang, R. Y., Suh, I., Zhao, J., Zhang, D., Fortner, E. C., Tie, X. X., Molina, L. T., and Molina, M. J.: Atmospheric new particle formation enhanced by organic acids, Science, 304, 1487– 1490, 2004b.
30
Zhao, J. and Zhang, R. Y.: Proton transfer reaction rate constants between hydronium ion (H3O(+)) and volatile organic compounds, Atmos. Environ., 38, 2177–2185, 2004.
ACPD
8, 4877–4909, 2008
Nitric acid during MCMA 2006 R. Zhang et al. Title Page Abstract Introduction Conclusions References Tables Figures ◭ ◮ ◭ ◮ Back Close
Full Screen / Esc
Printer-friendly Version
Interactive Discussion
Table 1. Ion-neutral potentials of SiF−5/N2and I−/N2systems based on ab initio calculations. SiF− 5/N2 I−/N2 ε (eV) 0.050 0.057 rm(A) 4.82 4.06 B (eV·A12) 8.62×10⁶ 5.29×10⁵ C6(eV·A6) 824.96 220.38 C4(eV·A4) 20.98 8.39 Ω(10−16cm2) 73.16 51.83
ACPD
8, 4877–4909, 2008
Nitric acid during MCMA 2006 R. Zhang et al. Title Page Abstract Introduction Conclusions References Tables Figures ◭ ◮ ◭ ◮ Back Close
Full Screen / Esc
Printer-friendly Version Interactive Discussion Exhaust SF6/N2 SiF4 N 2
Air Sample / Zero Air
Exhaust V1 V2 V3 a c d e f g h i b
Fig. 1. Schematic diagraph of the ID-CIMS: (a), HNO3permeation device; (b), ion source; (c), dry scroll pump for air sampling; (d), 10-ring drift tube; (e), Extrel 150-QS mass spectrometer;
(f) and (g), Varian TV-551 turbo pumps; (h), Edwards E2M30 oil pump; (i), Varian DS402 oil
ACPD
8, 4877–4909, 2008
Nitric acid during MCMA 2006 R. Zhang et al. Title Page Abstract Introduction Conclusions References Tables Figures ◭ ◮ ◭ ◮ Back Close
Full Screen / Esc
Printer-friendly Version
Interactive Discussion
ppbv vs CPS Plot 1 Regr
Volumetrically determined HNO3 (ppbv)
0.0 0.5 1.0 1.5 2.0 C al cul at ed H N O3 ( ppbv ) 0.0 0.5 1.0 1.5 2.0 2.5 3.0 3.5 4.0 4.5 y = 2.35x - 0.0570 R2 = 0.998
Fig. 2. Plot of calculated verse volumetrically prepared HNO3concentrations. The slope corre-sponds to the calibration factor.
ACPD
8, 4877–4909, 2008
Nitric acid during MCMA 2006 R. Zhang et al. Title Page Abstract Introduction Conclusions References Tables Figures ◭ ◮ ◭ ◮ Back Close
Full Screen / Esc
Printer-friendly Version Interactive Discussion N2O5 standard concentration (ppbv) 0 10 20 30 40 50 M ea su re d a n d C al cu la te d N 2 O5 C o n ce n tr at io n ( p p b v ) 0 10 20 30 40 50 60 70 y = 1.46x -0.037 R2 = 0.99
Fig. 3. Plot of measured and calculated N2O5vs. synthesized standards concentration. The slope corresponds to the calibration factor.
ACPD
8, 4877–4909, 2008
Nitric acid during MCMA 2006 R. Zhang et al. Title Page Abstract Introduction Conclusions References Tables Figures ◭ ◮ ◭ ◮ Back Close
Full Screen / Esc
Printer-friendly Version Interactive Discussion Time (s) 0 10 20 30 40 50 60 P er ce n t of H N O3 S ig n al 0 20 40 60 80 100 HNO3 signal
Exponential decay fit: y = 2.40 + 97.5exp(-0.237t)
Fig. 4. Spike test of the inlet using a 68 wt % HNO3solution exposed to the 12 ft inlet for less than one second. The data was collected at 0.4 Hz.
ACPD
8, 4877–4909, 2008
Nitric acid during MCMA 2006 R. Zhang et al. Title Page Abstract Introduction Conclusions References Tables Figures ◭ ◮ ◭ ◮ Back Close
Full Screen / Esc
Printer-friendly Version Interactive Discussion CST (hour) 8 9 10 11 12 13 14 15 16 17 18 19 20 21 H N O3 ( p p b v ) 0 1 2 3 4
Fig. 5. Diurnal profile of HNO3 observed on 22 March 2006. Backgrounds were checked at 08:36, 10:38, 12:30, 14:39, 16:35, 19:20, and 20:35 CST.
ACPD
8, 4877–4909, 2008
Nitric acid during MCMA 2006 R. Zhang et al. Title Page Abstract Introduction Conclusions References Tables Figures ◭ ◮ ◭ ◮ Back Close
Full Screen / Esc
Printer-friendly Version Interactive Discussion CST (hour) 8 9 10 11 12 13 14 15 16 17 18 19 H N O3 ( p p b v ) 0.0 0.5 1.0 1.5 2.0
Fig. 6. Diurnal profile of HNO3 observed on 23 March 2006. Backgrounds were checked at 08:00, 10:15, 13:00, 15:30, and 18:10 CST.
ACPD
8, 4877–4909, 2008
Nitric acid during MCMA 2006 R. Zhang et al. Title Page Abstract Introduction Conclusions References Tables Figures ◭ ◮ ◭ ◮ Back Close
Full Screen / Esc
Printer-friendly Version Interactive Discussion CST (hour) 7 8 9 10 11 12 13 14 15 16 17 18 19 20 H N O3 ( p p b v ) 0.0 0.2 0.4 0.6 0.8 1.0 1.2 1.4 1.6 1.8 2.0 Mean value Median value
Fig. 7. Averaged HNO3diurnal profile during the entire field campaign. Each point is based on 1755 data points and the error bars represent one standard deviation.
ACPD
8, 4877–4909, 2008
Nitric acid during MCMA 2006 R. Zhang et al. Title Page Abstract Introduction Conclusions References Tables Figures ◭ ◮ ◭ ◮ Back Close
Full Screen / Esc
Printer-friendly Version Interactive Discussion Local Time (CST) 3/22/06 00:00 3/22/06 12:00 3/23/06 00:00 3/23/06 12:00 3/24/06 00:00 H N O3 ( p p b v ) 0.0 0.5 1.0 1.5 2.0 2.5 3.0 3.5 N O3 - (u g /m 3 ) 0 5 10 15 20 25 Kp ( p p b v 2) 0 5 10 15 20 25 30 HNO3 NO3 -Kp
Fig. 8. Gaseous HNO3, aerosol nitrate (NO−
3), and the calculated dissociation constantKpof
ACPD
8, 4877–4909, 2008
Nitric acid during MCMA 2006 R. Zhang et al. Title Page Abstract Introduction Conclusions References Tables Figures ◭ ◮ ◭ ◮ Back Close
Full Screen / Esc
Printer-friendly Version Interactive Discussion CST (hour) 16 17 18 19 20 21 22 O3 , N O , an d N O2 ( p p b v ) 0 20 40 60 80 100 N2 O5 ( p p tv ) 0 20 40 60 80 100 Ozone NO NO2 N2O5
Fig. 9. N2O5measured on 26 March. Also shown are plots of NO, NO2, and O3. The gap in the measurements was due to instrument calibrations.
ACPD
8, 4877–4909, 2008
Nitric acid during MCMA 2006 R. Zhang et al. Title Page Abstract Introduction Conclusions References Tables Figures ◭ ◮ ◭ ◮ Back Close
Full Screen / Esc
Printer-friendly Version Interactive Discussion ICMS HNO3 (ppbv) 0.0 0.5 1.0 1.5 2.0 2.5 3.0 ID -C IM S H N O3 ( pp bv) 0.0 0.5 1.0 1.5 2.0 2.5 3.0 y = 0.834x + 0.0464 R2 = 0.75
Fig. 10. Inter-comparison between the ID-CIMS and ICMS based on 45 overlapping data points