HAL Id: hal-00298061
https://hal.archives-ouvertes.fr/hal-00298061
Submitted on 26 Jan 2007
HAL is a multi-disciplinary open access
archive for the deposit and dissemination of
sci-entific research documents, whether they are
pub-lished or not. The documents may come from
teaching and research institutions in France or
abroad, or from public or private research centers.
L’archive ouverte pluridisciplinaire HAL, est
destinée au dépôt et à la diffusion de documents
scientifiques de niveau recherche, publiés ou non,
émanant des établissements d’enseignement et de
recherche français ou étrangers, des laboratoires
publics ou privés.
Atmospheric multidecadal variations in the North
Atlantic realm: proxy data, observations, and
atmospheric circulation model studies
K. Grosfeld, G. Lohmann, N. Rimbu, K. Fraedrich, F. Lunkeit
To cite this version:
K. Grosfeld, G. Lohmann, N. Rimbu, K. Fraedrich, F. Lunkeit. Atmospheric multidecadal variations
in the North Atlantic realm: proxy data, observations, and atmospheric circulation model studies.
Climate of the Past, European Geosciences Union (EGU), 2007, 3 (1), pp.39-50. �hal-00298061�
www.clim-past.net/3/39/2007/
© Author(s) 2007. This work is licensed under a Creative Commons License.
of the Past
Atmospheric multidecadal variations in the North Atlantic realm:
proxy data, observations, and atmospheric circulation model studies
K. Grosfeld1, G. Lohmann1, N. Rimbu1, K. Fraedrich2, and F. Lunkeit2
1Alfred Wegener Institute for Polar and Marine Research, Bussestraße 24, 27515 Bremerhaven, Germany 2Meteorological Institute, University of Hamburg, Bundesstraße 55, 20146 Hamburg, Germany
Received: 1 August 2006 – Published in Clim. Past Discuss.: 31 August 2006
Revised: 18 December 2006 – Accepted: 8 January 2007 – Published: 26 January 2007
Abstract. We investigate the spatial and temporal
char-acteristics of multidecadal climate variability in the North Atlantic realm, using observational data, proxy data and model results. The dominant pattern of multidecadal vari-ability of SST depicts a monopolar structure in the North Atlantic during the instrumental period with cold (warm) phases during 1900–1925 and 1970–1990 (1870–1890 and 1940–1960). Two atmospheric general circulation models of different complexity forced with global SST over the last century show SLP anomaly patterns from the warm and cold phases of the North Atlantic similar to the corresponding ob-served patterns. The analysis of a sediment core from Cari-aco Basin, a coral record from the northern Red Sea, and a long-term sea level pressure (SLP) reconstruction reveals that the multidecadal mode of the atmospheric circulation characterizes climate variability also in the pre-industrial era. The analyses of SLP reconstruction and proxy data depict a persistent atmospheric mode at least over the last 300 years, where SLP shows a dipolar structure in response to monopo-lar North Atlantic SST, in a simimonopo-lar way as the models’ re-sponses do. The combined analysis of observational and proxy data with model experiments provides an understand-ing of multidecadal climate modes durunderstand-ing the late Holocene. The related patterns are useful for the interpretation of proxy data in the North Atlantic realm.
1 Introduction
Observed surface temperature data over the last century de-pict strong variability at interannual to multidecadal time scales. There is evidence that the global climate system con-tains modes of climatic variability operating on decadal to multidecadal time scales involving temperature and
atmo-Correspondence to: K. Grosfeld
spheric circulation (e.g. Hibler and Johnsen, 1979; Mann et al., 1995; Cook et al., 1998; Delworth and Mann, 2000; Dima and Lohmann, 2004). The signature of multidecadal vari-ability has been detected in observed sea surface temperature (SST) data in the North Atlantic realm (Deser and Blackmon, 1993; Kushnir, 1994). It has been speculated, that the SST from the North Atlantic Ocean follows a quasi-periodic cy-cle with a time scale of 50–80 years (Delworth and Mann, 2000; Enfield et al., 2001). During the extreme phases, the entire North Atlantic Ocean is dominated by monopolar SST anomalies. Significant climatic anomalies like anomalous rainfall and river flows are detected over the North American continent (Enfield et al., 2001) or a deepened Aleutian Low in the North Pacific (Minobe, 1997). Additionally, strong multidecadal variations are found in global temperature time series (Folland et al., 1984; Schlesinger and Ramankutty, 1994) and a global network of paleo-climate data (Mann et al., 1995). Other paleo data time series also indicate strong variability in the North Atlantic region at multidecadal time scales (Mahasenan et al., 1997; Baliunas et al., 1997; Sha-balova and Weber, 1999; Lohmann et al., 2004; Fischer and Mieding, 2005). All these studies suggest the existence of a long-term variation of the climate system, referred as At-lantic Multidecadal Oscillation (AMO) (Delworth and Mann, 2000; Kerr, 2000).
Related to multidecadal variations, one pronounced cli-mate shift has been detected at the end of the 1960s to the early 1970s worldwide, where the North Atlantic SST shifted from a warm into a cold phase. This shift was strongly corre-lated with the Great Salinity Anomaly in the North Atlantic (Dickson et al., 1988). SST changes, associated to this shift, were accompanied by changes in the sea level pressure (SLP) pattern from anomalous high to anomalous low pressures in the northern North Atlantic.
The purpose of this study is to investigate the spatio-temporal structures of temperature and sea level pressure in the North Atlantic realm at multidecadal time scales as seen
in instrumental and proxy data. The emphasis is on decom-posing this pattern and clarifying the atmospheric response to long-term persistent SST forcing. The analyses of obser-vational and proxy data in this respect are combined with model studies that we performed with two Atmospheric Gen-eral Circulation Models (AGCMs) of different complexity. In this way, dominant signals of multidecadal variability in observed and proxy data of the North Atlantic realm can be attributed to changes in SST forcing.
The paper is organized as follows: Used data sets and the chosen model approach are shortly described in Sect. 2. It is followed by a discussion of the signature of North Atlantic multidecadal variability as recorded in several proxy data sets (Sect. 3). Instrumental data is analyzed in order to describe the associated pressure patterns to the North Atlantic SST multidecadal variations of two AGCMs of high and inter-mediate complexity. Section 4 provides a discussion of the proxy data and model results and draws conclusions from this study.
2 Data and methods
2.1 Instrumental data
The investigation of the North Atlantic multidecadal variabil-ity of the instrumental period is based on two observational data sets: an updated (1856–2000) version of the Kaplan et al. (1998) monthly reanalysis of global SST anomalies su-perimposed onto the global SST climatology (GISST data set) given by the Hadley Centre for Climate Prediction and Research (Rayner et al., 1996). We use the GISST data set instead of the latest HadISST version (Rayner et al., 2003) because already existing simulation results of an AGCM en-semble integration with three members (Arpe et al., 2000) are included in this study.
In addition, an updated SLP data set over the North-ern Hemisphere for the period 1899–1997 (Trenberth and Paolino, 1980) is used. Both SST and SLP fields have a hori-zontal resolution of 5◦×5◦, respectively. For all analyzes, we restrict on winter (December, January, February: DJF) fields, because in this season the atmospheric teleconnections are strongest.
2.2 Proxy and early instrumental data
To analyze the pattern variability of multidecadal North Atlantic SST from the instrumental period into the pre-industrial era, four different proxy and historical data sets were included into the study. A thorough overview about pa-leoclimate proxy data covering the last millennia is given in Jones and Mann (2004). The two proxy records Ras Umm Sidd, northwestern Red Sea, and Cariaco Basin, are not in-cluded in the analysis of Jones and Mann (2004) and also not in the Mann et al. (1998) temperature reconstruction. In this context, the data sets are new. We choose these data sets
because they flank our region of interest, the North Atlantic, to the west and east, and hence, they do provide insights in North Atlantic climate variability. The temporal high resolu-tion of the time series provide in addiresolu-tion a good data quality for statistical and cross-pattern analyses. We make use of
(i) A 250-year coral record from Ras Umm Sidd, Egypt (27.5◦N; 34.18◦E), in the northwestern Red Sea (Felis et al., 2000). Coral growth is influenced by temperature and salinity of the sea water which is incorporated into the skeleton of the coral in form of the isotopic species of oxygen (the ratio of18O/16O, reported as δ18O re-spectively).
(ii) The second time series is a sediment core originating from Cariaco Basin (64.67◦W; 10.5◦N) (Black et al., 1999), a large and deep ocean basin located on the con-tinental shelf of Venezuela. Varved sediments that ac-cumulate within the bottom anoxic waters provide a detailed record of annual to decadal climate variability over the last 800 years.
(iii) An SLP reconstruction over the North Atlantic realm (30◦W–40◦E; 30◦N–70◦N) is based on the combina-tion of early instrumental stacombina-tion series (pressure, tem-perature and precipitation) and documentary proxy data from Eurasian sites and covers a time span of 340 years, starting from 1659 (Luterbacher et al., 2002).
(iv) We make use of the temperature reconstruction for the annual mean of Mann et al. (1998) covering the past centuries. The multiproxy network utilized by Mann et al. (1998) consists of a combination of annually-resolved proxy indicators (dendroclimatic, coral and ice core records) combined with the few long available his-torical and instrumental climate records. In our study we use data for the period 1730 to 1980 (251 years) for the North Atlantic region.
2.3 Atmospheric General Circulation Model Experiments To investigate the connection between SST and SLP on the multidecadal time scale, we performed model studies with two AGCMs of different complexity.
One model used in this study is the Portable University Model of the Atmosphere (PUMA) developed at the Univer-sity of Hamburg (Fraedrich et al., 1998, 2005a). PUMA is designed to be as compatible as possible with the comprehen-sive AGCM ECHAM (European Centre HAMburg) (Roeck-ner et al., 1992) and belongs to models of intermediate com-plexity (Claussen et al., 2002). PUMA is a presursor of the Planet Simulator (Fraedrich et al., 2005b,c), an Earth system model of intermediate complexity to investigate climate and paleo-climate simulations for time scales up to millennia in acceptable computational time. In the present study, PUMA is integrated in T-21 spectral resolution, corresponding to a
Gaussian grid of approximately 5.625◦ in horizontal
direc-tion. Five equally spaced, terrain-following sigma-levels are used in the vertical.
The dynamical core of PUMA is based on the multi-layer spectral model proposed by Hoskins and Simmons (1975). It numerically integrates the moist primitive equations con-veniently formulated in terms of the vertical component of absolute vorticity, the horizontal divergence, the tempera-ture, the logarithm of the surface pressure and the specific humidity. The equations are solved using the spectral trans-form method (Orszag, 1970; Eliasen et al., 1970). Physi-cal processes which are not explicitly resolved are parame-terized using schemes of intermediate complexity. The sur-face fluxes of moisture, heat and momentum are based on bulk formulas. The radiation uses a one-band approxima-tion for the long-wave part and a two-band approximaapproxima-tion for the short-wave part. Large-scale precipitation for super-saturated air and a Kuo type convective precipitation scheme (Kuo, 1965, 1974) complete the atmospheric water cycle. Clouds are formed diagnostically based on the relative hu-midity. The parameterizations for the land surface and the soil include the calculation of temperatures for the surface and the soil, a soils hydrology and a river transport scheme. The former version of PUMA, which was based on dry dy-namics where moisture is not explicitly considered, has been extensively applied for the evaluation of storm tracks and baroclinic life cycles (Frisius et al., 1998; Franzke et al., 2000). In the recent version this deficit has been improved. It successfully simulates glacial climates (Romanova et al., 2006a) as well as it was used to investigate extreme climate states such as snowball Earth (Romanova et al., 2006b).
Furthermore, we perform a twin-experiment between PUMA and the comprehensive AGCM ECHAM4 (Roeck-ner et al., 1996). The ECHAM4 integrations are performed on a T-42 grid with 19 vertical levels (Arpe et al., 2000).
The experiments performed cover the period 1903 to 1994. They are forced with the monthly global ice, sea surface tem-perature (GISST) data (Rayner et al., 1996). Since SST vari-ability captures most of the climate forcing in a certain way, CO2concentration of the atmosphere and solar irradiation is
kept constant to present-day conditions over the whole inte-gration period (model experiments show about no difference when forced with observed CO2level of the atmosphere). We
run the models in a 3-member ensemble mode and discuss the results in terms of the ensemble mean patterns. The num-ber of ensemble memnum-bers was chosen according to the exist-ing number of computer-time consumexist-ing ECHAM simula-tions. For PUMA, a bigger number of ensembles members would be possible; e.g. Grosfeld et al. (2007)1applied 20 en-semble members to investigate the role of different oceanic basins as forcing for the AMO. Depending on the forcing
1Grosfeld, K., Lohmann, G., and Rimbu, N.: The impact of
At-lantic and Pacific Ocean sea surface temperature anomalies on the North Atlantic multidecadal variability, Tellus, submitted, 2007.
regime, the spread between the ensemble members is dif-ferent. For globally and Atlantic-only forced experiments, the spread of the model response over Atlantic is small com-pared to Pacific-only forcing. For the current study, we apply only three ensemble runs to be based on the same spread for the evaluation of the model results for both experimental se-tups, ECHAM and PUMA. The 20-ensemble member results with PUMA are similar with the 3-ensemble member results shown here.
3 Results
3.1 Multidecadal variability in proxy records and SST re-constuctions
The coral record from the northern Red Sea (Fig. 1a) as well as the sediment core from Cariaco Basin (Fig. 1b) show en-hanced variability with time scale 50–100 years over the last millennium. According to Felis et al. (2000), the Red Sea coral shows a dominant quasi-periodic component at about 70 years, consistent with the low frequency component (band pass 50–100 years in the Fourier domain) shown in Fig. 1a. This time series shows also enhanced variability at 22–23 years and 5.7 years, linked to the Arctic Oscillation/North Atlantic Oscillation (NAO) and El Ni˜no Southern Oscilla-tion (ENSO) (Felis et al., 2000; Rimbu et al., 2001; Felis et al., 2004). A singular spectrum analysis for the Cariaco sed-iment record depicts pronounced periods of 67, 83, and 120 years (Lohmann et al., 2004), consistent with the time series of low frequency variations as shown in Fig. 1b. Variations below the multidecadal to century-scale frame are found in the interdecadal to decadal-scale band (Black et al., 1999; Dima et al, 2005a). The correlation between the filtered Cari-aco Basin and Red Sea time series is r=−0.84 for the com-mon 250 years, exceeding the 97.5% significance level. Sig-nificance of filtered time series is estimated by dividing the length of the time series by the filter high frequency cutoff for calculting the degree off freedom (e.g., P<0.05 for DF>3). However, we note the intrinsic limitation of the shortness of the data series, especially for observational time scales.
We perform a correlation analysis of these two time series with reconstructed SST data over the North Atlantic (Mann et al., 1998) in the multidecadal band (50–100 years). Although the Mann et al. (1998) data are mainly derived from land data, they are calibrated against the nearly continuous avail-able land air/sea surface temperature grid-point data from 1902 onwards. For this period the Atlantic is fully data cov-ered from about 30◦S to 70◦N (comp. Fig. 1b of Mann et al., 1998). The reconstruction method and data base allows for a backward reconstruction of surface temperature back to 1760 in a largely indistinguishable skill. Earlier periods suffer under sparseness of data and reduced reconstructive skill. Nevertheless, our study does not aim to judge about
1100 1200 1300 1400 1500 1600 1700 1800 1900 2000 time (years) -3 -2 -1 0 1 2 3
Isotopic oxygen 18/16 ratio (norm. by std. dev)
ORIGINAL FILTERED ✂✁☎✄ 1100 1200 1300 1400 1500 1600 1700 1800 1900 2000 time (years) -3 -2 -1 0 1 2 3
abundance g. bulloides (norm by std. dev.) ORIGINAL FILTERED
✝✆✞✄
Fig. 1. Time series from (a) a coral (winter data) from the northern
Red Sea (Felis et al., 2000) and (b) from a sediment core in Cariaco Basin (Black et al., 1999) indicate multidecadal variations. The data is detrended, normalized and shown in raw and 50–100 year band pass filtered version.
data quality, we only take the data as a possible source to investigate AMO beyond the observational period.
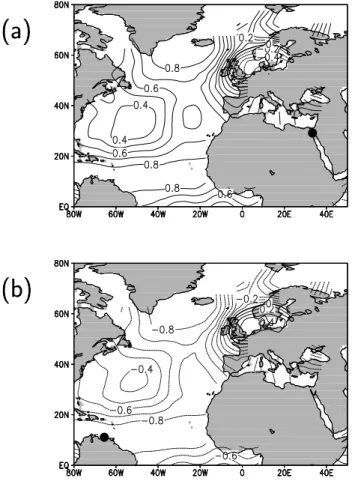
The correlation analysis shows a quasi-monopolar pattern with high coefficients over the entire North Atlantic. The oxygen isotope time series from the northern Red Sea is highly positive correlated with SST anomalies over the en-tire North Atlantic (Fig. 2a). The significant anti-correlation of the Cariaco time series with North Atlantic SSTs (Fig. 2b) suggests that the multidecadal mode is documented in Cari-aco Basin, consistent with enhanced variability of the record at multidecadal time scale (Fig. 1b). Prior to the analysis, the data (SST-field and proxy time series) are normalized and band-pass filtered (band pass 50–100 years in the Fourier do-main). The data processing is necessary to make the dif-ferent time series and data sets comparable and to isolate multidecadal variability from higher frequency fluctuations such as interannual or decadal variability. Beyond 100 years,
✂✁☎✄
✝✆✞✄
Fig. 2. Correlation map between gridded North Atlantic sea
sur-face temperature (Mann et al., 1998) and proxy time series from (a) northern Red Sea (Felis et al., 2000) and (b) Cariaco Basin (Black et al., 1999) for the period 1750–1980. Absolute correlation values exceeding ±0.65 fit the 90% confidence interval. Prior to correla-tion the data is detrended, normalized and Fourier filtered in the 50 years to 100 years frequency band. The proxy locations are indi-cated by circle, respectively.
the time series are not sensitive against the cut-off frequency. We performed several tests with the high frequency limit and choose it to be below the 60–70 years multidecadal band and higher than the decadal/interdecadal band. Test on different low-cut frequencies (35, 40, 45 years) show similar results than that for the 50 year low cut.
3.2 Multidecadal variability in reconstructed sea level pres-sure
Along with SST, sea level pressure over Northern Hemi-sphere depicts multidecadal variations on long time scales, also. The first EOF of the low-pass filtered SLP data (Fig. 3a) from a reconstruction reaching back to 1659 (Luterbacher et al., 2002) explains 46% of the variance. It shows an NAO-like dipolar pressure pattern over the North Atlantic and Western Europe, with negative anomalies over the Nordic
Sea and positive values over Western Europe. The corre-sponding principal component (Fig. 3b) indicates decadal to multidecadal variability and is highly correlated with the low frequency component of the NAO index. The spectral analy-sis of the original, unfiltered time series based on multi-taper method (Fig. 3c) depicts three peaks at about 7 years, 14 years, and 84 years, respectively, whereas the 7 years and 84 years peaks exceed the 95% significance level. The 84 years component is comparable with the low-pass filtered signal shown in Fig. 3b.
3.3 Multidecadal signature over the observational period: observations and model results
During the observational period, the North Atlantic SST shows pronounced multidecadal variability (Schlesinger and Ramankutty, 1994; Delworth and Mann, 2000). An SST in-dex (60◦W–0◦W, 0◦N–60◦N) constructed from the Kaplan
et al. (1998) data set for the entire North Atlantic indicates warm phases during 1870–1890 and 1940–1960 at multi-decadal time scales. These periods of warm SSTs are in-terrupted by cold phases during 1900–1925 and 1970–1990 (Fig. 4a). Figure 4b displays the difference between ob-served SST patterns over the North Atlantic between the warm phase 1940–1960 and the cold phase 1970–1990. Dur-ing these extreme phases, the entire North Atlantic is domi-nated by monopolar patterns with positive and negative tem-perature anomalies relative to the climatological mean state. A statistic t-test is applied to indicate the significance of the anomalous pattern at the 95% confidence level (e.g. Eshel and Farrell, 2000). The statistic test compares the anomalous pattern against the climatological mean anomaly (= zero), based on the hypothesis that the variance of the multidecadal fluctuation is significant compared to the decadal band vari-ability. Interannual variations are suppressed since multi-decadal variations modulate the interannual band but do not exceed its variance (Fig. 4a). Hence, the monopolar SST pattern over the whole North Atlantic is significant at 95% confidence level for the warm and cold phases (Fig. 4b).
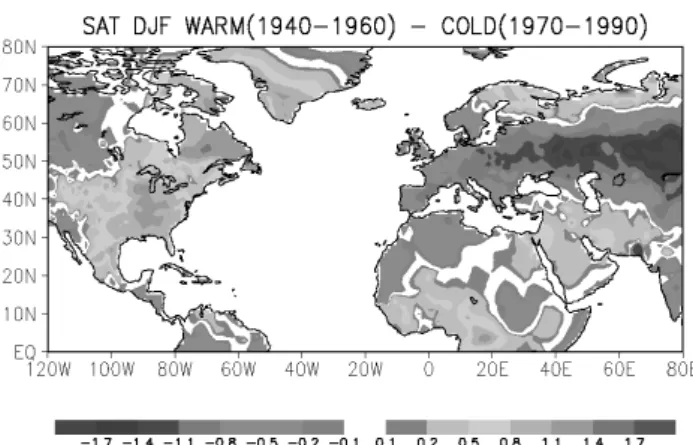
The ECHAM4 integration shows an extended monopolar SAT pattern over the North Atlantic (Fig. 4c) comparable to observations. The band of low anomalous amplitudes in the subtropics in observations (Fig. 4b) is exaggerated in the en-semble mean of the ECHAM simulations (Fig. 4c) and de-picts a band of negative anomalies. However, the amplitude reduction occurs in the same region compared to observa-tions. Over the continents, high regional variability with lo-cally reversed sign and strong amplitudes is detected. The PUMA integration (Fig. 4d) depicts similar results over the North Atlantic, but over land a much smoother and regular pattern, a result of the coarser resolution and reduced physics in PUMA as compared to ECHAM.
Concerning SAT over land, our model results fit to obser-vations for the most part. Figure 5 shows the same anoma-lous pattern (warm-cold) for the CRU-TS2.1 data (Mitchell
✂✁☎✄ ✝✆✞✄ 1650 1700 1750 1800 1850 1900 1950 2000 time (years) -3 -2 -1 0 1 2 3
SLP (hPa) norm by std dev
PC1 50 years low pass
✠✟✡✄ 0 0.02 0.04 0.06 0.08 0.1 0.12 0.14 frequency (1/years) 0.25 0.5 1 2 amplitude 99% 95% 90%
Fig. 3. EOF analysis of gridded sea level pressure data
(Luter-bacher et al., 2002) covering the period 1659–2000. (a) EOF1 ex-plaining 46% of the variance. (b) Principal component of EOF1 in raw (dotted) and 50 year low pass filtered (solid) version. (c) Spectra based on white noise null hypothesis, with lines indicating median and significance levels.
and Jones, 2005), compared to Figs. 4b, c, d. Compari-son with the ECHAM simulations shows good agreement. The negative anomaly over central Europe with extension over West Africa is as well captured in the model results
✂✁☎✄ 1860 1880 1900 1920 1940 1960 1980 2000 time (years) -1 -0.5 0 0.5 1
SST (deg C) norm by std dev
Kaplan SST 21 year running mean
✂✁☎✄ ✝✆☎✄ ✟✞✠✄ ☛✡✠✄ ✌☞✍✄ ✟✎✏✄ ☛✑✒✄
Fig. 4. (a) Index of North Atlantic SST (Kaplan et al., 1998) (dashed line) with 21-year running mean filter (solid line). Difference between
warm phase 1940–1960 and cold phase 1970–1990 of North Atlantic (b) SST (Kaplan et al., 1998) and (e) SLP (Trenberth and Paolino, 1980) from observational data, ensemble mean of ECHAM simulations for (c) SAT and (f) SLP, and ensemble mean of PUMA simulations for (d) SAT and (g) SLP. Units are given in◦C and hPa. Contour interval is 0.1◦Cand 0.25 hPa. Shading indicates significance at 95% confidence level, according to a t-test statistics.
as the positive anomaly over the eastern Mediterranean Sea and northern Arabian Peninsula. Over America, a transition from positive to negative anomalous temperatures from east
to west is given in ECHAM and in the observational data. The courser resolution PUMA model can not capture the small scale features as ECHAM does, but the general pattern
is also represented. Negative anomalous temperatures over western America change to positive temperatures at the East coast. The not resolved separation of SLP into two centres over the Atlantic and Europe/Africa, as obvious from obser-vations and in the ECHAM model, yields to an extension of the positive anomaly over Europe. The negative anomaly over Africa is similar to the ECHAM results. We conclude that a comparable SAT pattern to observations can be mod-elled with given global SST data by AGCMs. The quality of the model result depends on the model resolution and degree of complexity.
Associated with the SST anomalous pattern, the SLP pat-tern (Trenberth and Paolino, 1980) shows a coherent large-scale distribution (Fig. 4e). Over the northern North Atlantic region, the SLP pattern shows a dipolar SLP pattern: nega-tive SLP anomalies dominate the Azores area and southern Europe while positive SLP anomalies prevail over Iceland and northwestern Europe during the warm phase of the North Atlantic. A reverse pattern occurs during the cold phase of the North Atlantic Ocean. The ECHAM simulations yield a dipolar pattern in SLP (Fig. 4f) over the North Atlantic with positive anomalies over northern and north-eastern North Atlantic and negative anomalies over the subtropics. Posi-tive anomalies advance further south along the western Eu-ropean coast, compared to observations. The PUMA re-sults (Fig. 4g) show quite similar patterns in comparison with observations. A dipolar pattern is detected, although the transition from positive to negative anomalies is located more northward and the two significant regions of anoma-lous low pressure over the subtropics and central Europe are connected in the ensemble mean response. The global mean variance of the different realizations and the ensem-ble mean for the ECHAM and PUMA simulations are in the order of 0.7◦C and 0.5◦C, 1.4 hPa and 1.2 hPa, respectively. A dipole-like pattern with Icelandic and Azores centers of action arises, which has been detected for the multidecadal North Atlantic mode (Kushnir, 1994).
For our analysis, we choose the period 1903–1994, be-cause for this period AGCM integrations with the complex ECHAM4 model were available for the inter-comparison of the model results. We performed additional new model sim-ulation for the same period with PUMA to demonstrate the persistence of AMO in different model approaches. Aim of this study is not the demonstration if the AMO can gener-ally be simulated. This has already been done by different authors (Delworth and Mann, 2000). Our study compares the spatial and temporal characteristics of multidecadal cli-mate variability in the North Atlantic realm from different methodological approaches. Puma simulations covering the whole observational period (1856–2000) and going beyond the pre-industrial period are also performed on the basis of the Kaplan et al. (1998) data set. The results are discussed by Grosfeld et al. (2007)1 in detail. These results show an extension of the AMO for the period 1856–2000. The signa-ture of AMO is not alone dominated by the North Atlantic, it
Fig. 5. Anomalous warm – cold SAT (same as for Figs. 4b, c, d)
over land, derived from CRU-TS2.1 monthly climate observations (Mitchell and Jones, 2005).
is composed of different forcing regions, namely the Atlantic and Pacific Ocean. In this respect, the model results shown here describe the dominating pattern over the north Atlantic realm which can be extended to the past, when forcing the model with longer global SST data.
3.4 Long-term persistence of the multidecadal signature The correlation between two independent proxy data sets from different locations of the North Atlantic realm (Cari-aco Basin and Red Sea, r=−0.84 for the last 250 years) sup-ports a hemispheric mode suggested by Deser and Blackmon (1993). The analyzed records on centennial time scales en-able a reconstruction and projection of multidecadal signals such as the basin-wide North Atlantic temperature into the past. Our analysis of a long-term SLP reconstruction (Luter-bacher et al., 2002) shows the Atlantic dipole pattern as per-sistent modulation of the North Atlantic atmospheric pres-sure dipole on multidecadal time scales for the last 340 years (Fig. 3b).
The relation between North Atlantic SST variability on multidecadal time scales and the corresponding SLP pattern over the North Atlantic realm over longer time scales can be clarified through correlation between Cariaco Basin sedi-ment core time series (Black et al., 1999) and the Luterbacher et al. (2002) SLP reconstruction. The common time window covers the last 332 years starting from 1659. Prior to the analysis, the data are filtered in the 50 years to 100 years fre-quency band. This procedure excludes higher frefre-quency vari-ability such as decadal or annual ones, but also reduces the degree of freedom for the significance test (332 yr/50 yr filter
=7 degrees of freedom) for the pressure maxima. We found that the resulting correlation map reveals a pattern with coef-ficients exceeding the 95% significance level for the maxima. The correlation map (Fig. 6a) shows a clear dipolar pres-sure pattern over the North Atlantic with high prespres-sure over
(a)
(b)
Fig. 6. (a) Correlation map between proxy time series from Cariaco
basin (Black et al., 1999) and SLP reconstruction data over North Atlantic (Luterbacher et al., 2002) covering 332 years starting from 1659. Correlation values exceeding ±0.65 fit the 95% confidence interval. (b) Same as (a), but excluding the anthropogenically in-fluenced period after 1859. All data is detrended, normalized and filtered in the band of 50 to 100 years prior to the analysis.
southern and western Europe and low pressure over north-ern Europe and the Norwegean Sea. This NAO+-like pattern
is associated with a cold Atlantic Ocean (comp. correlation of Cariaco Basin record with SST reconstruction, Fig. 2b). Since the centers of pressure variations are different to the NAO (compare also 1. EOF of Luterbacher et al., 2002, in Fig. 3a), the Atlantic multidecadal mode is a distinct feature, but modulates the NAO index on multidecadal time scales. The high correlation between the sediment record and the SLP pattern suggests that multidecadal SST variations over the North Atlantic could be an important forcing factor for the large-scale atmospheric circulation.
In order to separate the impact of anthropogenic forcing during the 20th century on the correlation pattern we cal-culate a correlation map of the Cariaco time series and the (Luterbacher et al., 2002) SLP data for the common pre-industrial period (1659–1859), similar to Fig. 6a, to exclude the impact of 20th century climate variability from the data. Figure 6b shows a similar correlation pattern as for the entire period (up to 1990), indicating that the 20th century
anthro-pogenic contamination of the forcing data has only minor impact on multidecadal time scales.
The Cariaco time series suggests a weaker multidecadal variability of the North Atlantic temperature during the 1550s to the 1650s period as well as during a period of about 100 years centered around the 1350s, which is prob-ably linked to the onset of pronounced cooling phases dur-ing the last millennium (Fig. 1a). An anomalous cold phase, known as the Little Ice Age, began with dramatic cooling around 1560 after global climate experienced a brief warm-ing period between 1460 and 1560. This is also consistent with a sea-salt aerosol record of a Greenland ice core for the last 1000 years (Fischer and Mieding, 2005), attributing sea-salt concentration variations to shifts in storm track activity, which are linked to changes in the North Atlantic pressure gradient.
4 Discussion and conclusion
Motivated by proxy data which clearly indicate multidecadal variations, we analyze the North Atlantic multidecadal vari-ability using observational data, general atmospheric circula-tion model experiments with two AGCMs of different com-plexity (ECHAM4 and PUMA), as well as proxy data. The overall goal of this study is the identification of the AMO signature in different data archives and to connect the analy-ses by means of physical interpretation revealed from model study results.
Instrumental and proxy data show persistent multidecadal variations over the North Atlantic realm for the last 300 years, represented as monopolar SST and dipolar SLP pat-terns. The correlation analysis of the Atlantic-European SLP (Luterbacher et al., 2002) and the long-term reconstruction of the oceanic upwelling regime (Black et al., 1999) reveal that the dominant pattern of multidecadal variability projects well on the SLP pattern associated to North Atlantic multidecadal variability.
Observational data and model results over the last 150 years enable a common discussion of patterns typical for multidecadal variability. Both data sets depict a clear climate shift in surface temperature (SST respectively SAT) and SLP patterns in the 1970s. The North Atlantic is characterized by a quasi-monopolar surface temperature pattern associated with dipolar SLP structure. A warm North Atlantic, as it was the case in 1860–1880 and 1940–1960, is related to pat-terns similar to those of negative phase of the NAO. Contrary to this, a cold North Atlantic Ocean, as it was the case in 1905–1925 and 1970–1990, is related to patterns similar to those of positive phase of the NAO. However, the centers of the anomalous fields are different (for the NAO, centers are over Island and Gibraltar; for the AMO, centers shift to South Greenland and to central North Atlantic). The periods of stable warm and cold SSTs coincide well with the phasing of coral and marine sediment records during the same period
(Fig. 2a and b). This connection of monopolar SST patterns with dipolar SLP on longer time scales is similar to results of Deser and Blackmon (1993), who analyzed 90 years of observational data in respect of low-frequency variability of the surface climate during winter. In their analysis it is spec-ulated that the climate shift in the 1970s can be part of a quasi-periodic behavior on multidecadal time scales.
As our model results show, a basin-wide monopolar SST pattern is accompanied by a (at least in part predictable) dipolar SLP pattern at multidecadal time scales over the en-tire North Atlantic. Significant correlations were found be-tween the decadal mean North Atlantic SST index and SLP over the North Atlantic-European region. A possible con-nection of the SLP response and the multidecadal SST vari-ations are given by the geometry of the SLP pattern. Com-pared to the NAO pattern in the northern North Atlantic, the SLP main pressure centers on multidecadal time scales are shifted toward the east during warm phases of the North At-lantic (Fig. 6), with an axis of the dipolar pattern inclined northeast-southwestward. One can speculate that this cir-culation change supports increased sea ice export from the Arctic to the North Atlantic in a similar way as suggested by Hilmer and Jung (2000). The sea ice export can influence the freshwater budget in the northern North Atlantic affect-ing the THC which in turn produces the other phase of the inter-hemispheric bipolar SST anomaly.
The vertical structure of our PUMA simulations reveals a dipolar signal in the field of geopotential height at 500 hPa (Fig. 7), indicating a barotropic stucture of the vertical pres-sure field (comp. Fig. 4). Following the idea of Delworth and Mann (2000) that an Atlantic forcing of the AMO would induce a baroclinic vertical structure close to the anomalous SST field, our result speaks for a remote forcing mechanism. Grosfeld et al. (2007)1investigate exact this question in dif-ferent model simulations over the observational period (last 145 years), with prescribed observed SST in the Atlantic or Pacific Ocean and climatological forcing of a mixed layer slab ocean outside. They found, that the AMO is forced by two mechanisms, the Atlantic SST which reveals a monopo-lar SLP field over monopomonopo-lar SAT at time scales of 60–70 years and a signal of Pacific origin, which is transferred via teleconnections to the Atlantic at time scales of 80–90 years. Both parts contribute to the AMO signal which is derived from observational data and also from model results shown in this study.
Our modeling studies with two AGCMs of different com-plexity forced by global SST variability over the last century show that the SLP pattern over North Atlantic is predictable if global SST variability can be predicted. This result can be compared with the modeling study of Rodwell et al. (1999), but on interannual to decadal time scales, who derived cli-mate predictability of European winter clicli-mate, as e.g., the NAO pattern with North Atlantic SST as predictor. Simi-larly, Latif et al. (2000) found that SLP variations over North Atlantic are predictable as long as the SSTs used as forcing
Fig. 7. Anomalous warm – cold field of 500 hPa geopotential height
(equivalent to Fig. 4g), indicating a barotropic stucture of the dipo-lar pressure field with a negative anomaly, but reduced horizontal extension over the subtropical North Atlantic.
data can be predicted. Since both patterns are highly corre-lated they suggest a common mode in which SST forces the large-scale SLP pattern. Evidences of an NAO-like response to prescribed Atlantic SST forcing have also been found in AGCM simulations by Robertson et al. (2000). Sutton and Hodson (2003) analyzed seasonal characteristics of North Atlantic climate variability on interannual and multidecadal time scales, and possible non-stationarity in the oceanic in-fluence. On multidecadal time scales they found a single mode from ensemble simulations forced with SST and sea ice extent data for the period 1871–1999, which resembles the NAO pattern. Sutton and Hodson (2003) further conclude that this mode might be driven by the oceanic thermohaline circulation, a result that can be supported with our model setup. This gains further support by a modelling study by Pohlmann et al. (2004) who derived a clear relationship be-tween the North Atlantic SST and the oceanic thermohaline circulation (THC) with high predictability skill on decadal to multidecadal time scales in a coupled atmosphere – ocean model approach. In a recent paper Latif et al. (2006) suggest that the meridional overturning circulation (MOC), which is related to AMO, can be understood as the lagged response to multidecadal variations in NAO and the associated varia-tions in Labrador Sea convection. A similar mechanism is proposed in an earlier paper of Eden and Jung (2001), who provides evidence that multidecadal fluctuations in the MOC and the associated SST variability are driven bei the NAO through heat flux forcing (see also Delworth and Greatbatch, 2000). However, our study is focused on the atmospheric response to SST forcing during the phase of maximum am-plitude of AMO (i.e. entire North Atlantic is covered by SST anomalies of the same sign). This does not exclude an NAO SLP pattern in the early phase of AMO. Therefore, our re-sults are not in contradiction with the Latif et al. (2006) and Eden and Jung (2001) mechanisms.
However, the origin of AMO is not yet fully understood. The multidecadal variation in SAT and SLP depict slightly
different time scales in the multidecadal frame, where SAT reveals shorter periods (about 60–70 years) and SLP tends to longer periods (about 80–90 years). It is a question whether these fluctuations belong to the same phenomenon. The North Atlantic SAT pattern is associated to a more re-gional mode, possibly linked to the thermohaline circulation (Lohmann et al., 2004). Monopolar SST anomalies in the North Atlantic are connected to the inter-hemispheric seesaw temperature pattern, typical for THC changes (e.g. Crowley, 1992; Stocker, 1998). Part of the multidecadal variability can also be attributed to a global mode possibly forced by solar insolation (Lohmann et al., 2004). This mode has also been detected in an analysis of a coral record from the subtropical South Pacific, where the associated field correlation points to a possible solar origin (Dima et al., 2005b). The signature of solar irradiance for the Gleissberg cycle (70–100 years) as probable driver of the AMO is, for example, character-ized by a band structure in the Pacific SST pattern (Lohmann et al., 2004). A teleconnection via Pacific-North American (PNA) pattern could transfer this signal to the Atlantic. Re-cently, Dima and Lohmann (2007) propose a deterministic mechanism relying on atmosphere-ocean-sea-ice interaction. Anomalies in North Atlantic SST are associated with a hemi-spheric wave-number-one SLP structure in the atmosphere, which is amplified through atmosphere-ocean interactions in the North Pacific. This pattern projects on NAO, but is dif-ferent.
For observational time scale, Mann and Emanuel (2006) have questioned the evidence of the AMO in its influence on tropical Atlantic SST variations, including the area of our Cariaco sediment core position. They claim, that inter-decadal SST flucations in the tropical Atlantic are radiatively forced and not a result of the AMO. Because the Cariaco sed-iment core time series is negatively correlated with most of the North Atlantic SST during the instrumental period, the AMO is a detectable signal in Cariaco basin. However, only a part of the Cariaco sediment core is explained by AMO. The remaining part of the variability can be related to pro-cesses that are independent of AMO (e.g. Lohmann et al., 2004; Dima et al, 2005a), in a similar way as the part of trop-ical Atlantic hurricane variability that are connected with ra-diatively forced SST anomalies. Also, parts of AMO and the radiatively forced signal can vary, by chance, in phase during the observational period.
In summary we conclude that the signature of multi-decadal climate variability represents a clear and persistent pattern that can be revealed in different quantities, observa-tional evidences, model results, and proxy time series. Al-though similar in its SLP signature with the NAO (dipole over the North Atlantic), it is characterized by its own cli-mate pattern, modulating the Atlantic clicli-mate system via its long persistent and large-scale pattern with strong impacts on the hydrology and terrestrial eccosystems of the Euro-Atlantic sector. The different pattern might be related to a lag-relation between NAO and the phase of maximum
ampli-tude of AMO. The connection of monoploar SST and dipolar SLP over the North Atlantic, as seen from our AGCM model simulations, implies a predictable SLP pattern for the multi-decadal mode, which is one part of the mechanism, involv-ing sea ice and THC variations. Hence, additional analyses of especially long proxy time series and selected model ex-periments could shed more light on the open question about possible causes of the multidecadal mode in order to under-stand past, present, and future climate change.
Acknowledgements. This work has been funded by the German Federal Ministry of Education and Research through the DEKLIM project “Climate Transitions” and the Deutsche Forschungsgemein-schaft through SFB 512 “Tiefdruckgebiete und Klimasystem des Nordatlantiks”. Proxy data and instrumental data sets provided by D. E. Black, T. Felis, A. Kaplan, J. Luterbacher, K. E. Trenberth, and D. A. Paolino are gratefully acknowledged. We are grateful to K. Arpe and E. Roeckner for providing us with the ECHAM4 simulation data and to M. Dima for valuable discussions. We thank two anonymous reviewers and R. Greatbatch for their constructive and helpful comments.
Edited by: T. van Ommen
References
Arpe, K., Bengtsson, L., Golitsyn, G. S., Mokhov, I. I., Semenov, V. A., and Sporyshev, P. V.: Connection between Caspian Sea level variability and ENSO, Geophys. Res. Lett., 27, 2693–2697, 2000.
Baliunas, S., Frick, P., Sokoloff, D., and Soon, W.: Time scales and trends in the Central England Temperature data (1659–1990): A wavelet analysis, Geophys. Res. Lett., 24, 1351–1354, 1997. Black, D. E., Peterson, L. C., Overpeck, J. T., Kaplan, A., Evans,
M. N., and Kashgarian, M.: Eight centuries of North Atlantic Ocean atmosphere variability, Science, 286, 1709–1713, 1999. Claussen, M., Mysak, L. A., Weaver, A. J., Crucifix, M., Fichefet,
T., Loutre, M.-F., Weber, S. L., Alcamo, J., Alexeev, V. A., Berger, A., Calov, R., Ganopolski, A., Goosse, H., Lohmann, G., Lunkeit, F., Mokhov, I. I., Petoukhov, V., Stone, P., and Wang, Zh.: Earth System models of intermediate complexity: Closing the gap in the spectrum of climate system models, Clim. Dyn., 18, 579–586, 2002.
Cook, E. R., D’Arrigo, R. D., and Briffa, K. R.: A reconstruction of the North Atlantic Oscillation using tree-ring chronologies from North America and Europe, The Holocene, 8, 9–17, 1998. Crowley, T. J.: North Atlantic deep water cools the Southern
Hemi-sphere Paleoceanography, 7, 489–497, 1992.
Delworth, T. L. and Greatbatch, R. J.: Multidecadal thermohaline circulation variability driven by atmospheric surface flux forcing, J. Clim., 13(9), 1481–1495, 2000.
Delworth, T. L. and Mann, M. E.: Observed and simulated multi-decadal variability in the Northern Hemisphere, Clim. Dyn., 16, 661–676, 2000.
Deser, C. and Blackmon, M.: Surface climate variations over the North Atlantic ocean during winter: 1900–1989, J. Clim., 6, 1743–1753, 1993.
Dickson, R. R., Meincke, J., Malmberg, S.-A., and Lee, A. J.: The ‘Great Salinity Anomaly’ in the northern North Atlantic 1968– 1982, Prog. Oceanog., 20, 103–151, 1988.
Dima, M. and Lohmann, G.: Fundamental and derived modes of climate variability, Application to biennial and interannual timescale, Tellus, 56A, 229–249, 2004.
Dima, M. and Lohmann, G.: A hemispheric mechanism for the At-lantic multidecadal oscillation, J. Clim., in press, 2007. Dima, M., Lohmann, G., and Dima, I.: Solar induced and internal
climate variability at decadal timescales, Int. J. Climatol., 25(6), 713–733, 2005a.
Dima, M., Felis, T., Lohmann, G., and Rimbu, N.: Distinct modes of bidecadal and multidecadal variability in a climate reconstruc-tion of the last centuries from the South Pacific coral, Clim. Dyn., 25(2/3), 329–336, doi:10.1007/s00382-005-0043-2, 2005b. Eden, C. and Jung, T.: North Atlantic interdecadal variability:
Oceanic response to the North Atlantic Oscillation (1865–1997), J. Clim., 14, 676–691, 2001.
Eliasen, E., Machenhauer, B., and Rasmussen, E.: On a numeri-cal method for integration of the hydrodynaminumeri-cal equations with a spectral representation of the horizontal fields, Inst. of Theor. Met., 2, Univ. of Copenhagen, 37pp, 1970.
Enfield, D. B., Mestas-Nunez, A. M., and Trimble, P. J.: The At-lantic multidecadal oscillation and its relation to rainfall and river flows in the continental U.S., Geophys. Res. Lett., 28, 2077– 2081, 2001.
Eshel, G. and Farrell, B. F.: Mechanisms of eastern Mediterranean rainfall variability, J. Atmos. Sci., 57, 3219–3232, 2000. Felis, T., P¨atzold, J., Loya, Y., Fine, M., Nawar, A. H., and
We-fer, G.: A coral oxygen isotope record from the northern Red Sea documenting NAO, ENSO, and North Pacific teleconnec-tions on Middle East climate variability since the year 1750, Pa-leoceanography, 15, 679–694, 2000.
Felis, T., Lohmann, G., Kuhnert, H., Lorenz, S. J., Scholz, D., P¨atzold, J., Al-Rousan, S. A., and Al-Moghrabi, S. M.: Increased seasonality in Middle East temperatures during the last inter-glacial period, Nature, 429, 164–168, 2004.
Fischer, H. and Mieding, B.: A 100 year ice core record of annual to multidecadal variations in atmospheric circulation over the North Atlantic, Clim. Dyn., 25, 65–74, doi:10.007/s00382-005-0011-x, 2005.
Folland, C. K., Parker, D. E., and Kates, F. E.: Worldwide ma-rine temperature fluctuations 1856–1991, Nature, 310, 670–673, 1984.
Fraedrich, K., Kirk, E., and Lunkeit, F.: Portable University Model of the Atmosphere. Deutsches Klimarechenzentrum, Tech. Rep. 16, 37pp, (Available online at http:/www/dkrz.de/forschung/ reports.html), 1998.
Fraedrich, K., Kirk, K., Luksch, U., and Lunkeit, F.: The Portable University Model of the Atmosphere (PUMA): Storm track dy-namics and low frequency variability, Meteorol. Zeitschrift, 14, 735–745, 2005a.
Fraedrich, K., Jansen, H., Kirk, E., Luksch, U., and Lunkeit, F.: The Planet Simulator: Towards a user friendly model, Meteorol. Zeitschrift, 14, 299–304, 2005b.
Fraedrich, K., Jansen, H., Kirk, E., and Lunkeit, F.: The Planet Simulator: Green planet and desert world, Meteorol. Zeitschrift, 14, 305–314, 2005c.
Franzke, C., Fraedrich, K., and Lunkeit, F.: Low frequency
variabil-ity in a simplified atmospheric global circulation model: Storm track induced ‘spatial resonance’, Q. J. R. Meteorol. Soc., 126, 2691–2708, 2000.
Frisius, T., Lunkeit, F., Fraedrich K., and James, I. A.: Storm-track organization and variability in a simplified atmospheric global circulation model (SGCM), Q. J. R. Meteorol. Soc., 124, 1019– 1043, 1998.
Hibler, W. D. and Johnsen, S. J.: The 20-year cycle in Greenland ice core records, Nature, 280, 481–483, 1979.
Hilmer, M. and Jung, T.: Evidence for a recent change in the link between the North Atlantic Oscillation and Arctic sea ice export, Geophys. Res. Lett., 27, 989–992, 2000.
Hoskins, B. J. and Simmons, A. J.: A multi-layer spectral model and the semi-implicit method, Q. J. R. Meteorol. Soc., 101, 637– 655, 1975.
Jones, P. D. and Mann, M. E.: Climate over past millenia, Rev. Geophys., 42, RG2002, doi:10.1029/2003RG000143, 2004. Kaplan, A., Cane, M. A., Kushnir, Y., Clement, A., Blumenthal, M.,
and Rajagopalan, B.: Analyses of global sea surface temperature 1856–1991, J. Geophys. Res., 103, 567–589, 1998.
Kerr, R.: A North Atlantic climate pacemaker for the centuries, Sci-ence, 288, 1984–1986, 2000.
Kuo, H. L.: On formation and intensification of tropical cy-clones through latent heat release by cumulus convection, J. At-mos. Sci., 22, 40–63, 1965.
Kuo, H. L.: Further studies of the parameterization of the influence of cumulus convection on large-scale flow, J. Atmos. Sci., 31, 1232–1240, 1974.
Kushnir, Y.: Interdecadal variations in North Atlantic sea surface temperature and associated atmospheric conditions, J. Clim., 7, 141–157, 1994.
Latif, M., Arpe, K., and Roeckner, E.: Oceanic control of decadal North Atlantic sea level pressure variability in winter, Geophys. Res. Lett., 27, 727–730, 2000.
Latif, M., B¨oning, C., Willebrand, J., Biastoch, A., Dengg, J., Keenlyside, N., and Schweckendiek, U.: Is the thermohaline cir-culation changing?, J. Clim., 19, 4631–4637, 2006.
Lohmann, G., Rimbu, N., and Dima, M.: Climate signature of solar irradiance variations: Analysis of long-term instru-mental and historical data, Int. J. Clim., 24, 1045–1056, doi:10.1002/joc.1054, 2004.
Luterbacher, J., Xoplaki, E., Dietrich, D., Rickli, R., Jacobeit, J., Beck, C., Gyalistras, D., Schmutz, C., and Wanner, H.: Recon-struction of Sea Level Pressure fields over the Eastern North At-lantic and Europe back to 1500, Clim. Dyn., 18, 545–561, 2002. Mahasenan, N., Watts, R. G., and Dowlatabadi, H.: Low-frequency oscillations in temperatuproxy records and implications for re-cent climate changes, Geophys. Res. Lett., 24, 563–566, 1997. Mann, M. E. and Emanuel, K. A.: Atlantic hurricane trends linked
to climate change, EOS, 87(24), 233–244, 2006.
Mann, M. E., Park, J., and Bradley, R. S.: Global interdecadal and century-scale climate oscillations during the past five centuries, Nature, 378, 266–270, 1995.
Mann, M. E., Bradley, R. S., and Hughes, M. K.: Global-scale tem-perature patterns and climate forcing over the past six centuries, Nature, 392, 779–787, 1998.
Minobe, S.: A 50–70 year climate oscillation over the North Pa-cific and over North America, Geophys. Res. Lett., 24, 683–686, 1997.
Mitchell, T. D. and Jones, P. D.: An improved method of construct-ing a database of monthly climate observations and associated high-resolution grids, Int. J. Climatol., 25, 693–712, 2005. Orszag, S. A.: Transform method for calculation of vector coupled
sums: Application to the spectral form of the vorticity equation, J. Atmos. Sci., 27, 890–895, 1970.
Pohlmann, H., Botzet, M., Latif, M., Roesch, A., Wild, M., and Tschuck, P.: Estimating the long-term predictability potential of a coupled AOGCM, J. Clim., 17, 4463–4472, 2004.
Rayner, N. A., Horton, E. B., Parker, D. E., Folland, C., and Hack-ett, R. B.: Version 2.2 of the Global sea-Ice and Sea Surface Tem-perature data set, 1903–1994, Clim. Res. Tech. Note. 74, Hadley Centre, U.K. Meteorol. Off., Bracknell, England, 1996. Rayner, N. A., Parker, D. E., Horton, E. B., Folland, C.,
Alexan-der, L. V., Rowell, D. P., Kent, E. C., and Kaplan, A.: Global analyses of sea surface temperature, sea ice, and night marine air temperature since the late nineteenth century, J. Geophys. Res., 108(D14), 4407, doi:10.1029/2002JD002670, 2003.
Rimbu, N., Lohmann, G., Felis, T., and P¨atzold, J.: Arctic Oscilla-tion signature in a Red Sea coral, Geophys. Res. Lett., 28, 2959– 2962, 2001.
Robertson, A. W., Mechoso, C. R., and Kim, Y.-J.: The influence of Atlantic sea surface temperature anomalies on the North Atlantic Oscillation, J. Clim., 13, 122–138, 2000.
Rodwell, M. J., Rowell, D. P., and Folland, C. K.: Oceanic forc-ing of the wintertime North Atlantic Oscillation and European climate, Nature, 398, 320–323, 1999.
Roeckner, E., Arpe, K., Bengtsson, L., Brinkop, S., D¨umenil, L., Esch, M., Kirk, E., Lunkeit, F., Ponater, M., Rockel, B., Sausen, R., Schlese, U., Schubert, S., and Windelband, M.: Simulation of present-day climate with the ECHAM model: Impact of model physics and resolution, MPI Report 9, ISSN 0937-1060, Max-Planck-Institut for Meteorology, Hamburg, Germany, 171 pp, 1992.
Roeckner, E., Arpe, K., Bengtsson, L., Christoph, M., Claussen, M., D¨umenil, L., Esch, M., Giorgetta, M., Schlese, U., and Schulzweida, U.: The atmospheric general circulation model ECHAM4: Model description and simulation of present-day cli-mate, MPI Report 218, Max-Planck-Institute for Meteorology, Hamburg, Germany, 90 pp, 1996.
Romanova, V., Lohmann, G., Grosfeld, K., and Butzin, M.: The relative role of oceanic heat transport and orog-raphy on glacial climate, Quat. Sci. Rev., 25, 832–845, doi://10.1016/j.quascirev/2005.07.007, 2006a.
Romanova, V., Lohmann, G., and Grosfeld, K.: Effect of land albedo, CO2, orography, and oceanic heat transport on extreme climates, Clim. Past, 2, 31–42, 2006b.
Schlesinger, M. E. and Ramankutty, N.: An oscillation in the global climate system of period 65–70 years, Nature, 367, 723–726, 1994.
Shabalova, V. and Weber, S. L.: Patterns of temperature variability on multidecadal to centennial time scales, J. Geophys. Res., 104, 31 023–31 041, 1999.
Stocker, T.: The seesaw effect, Nature, 524, 498–499, 1998. Sutton, R. T. and Hodson, D. L. R.: Influence of the ocean on North
Atlantic climate variability 1871–1999, J. Clim., 16, 3296–3313, 2003.
Trenberth, K. E. and Paolino, D. A.: The Northern Hemisphere sea level pressure data set: Trends, errors and discontinuities, Mon. Wea. Rev., 108, 855–872, 1980.