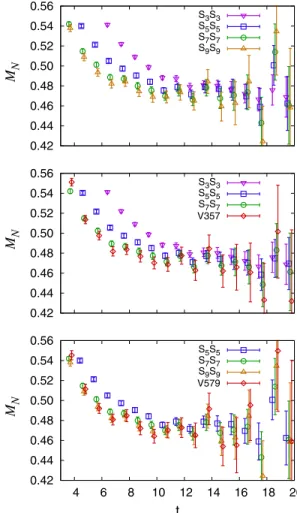
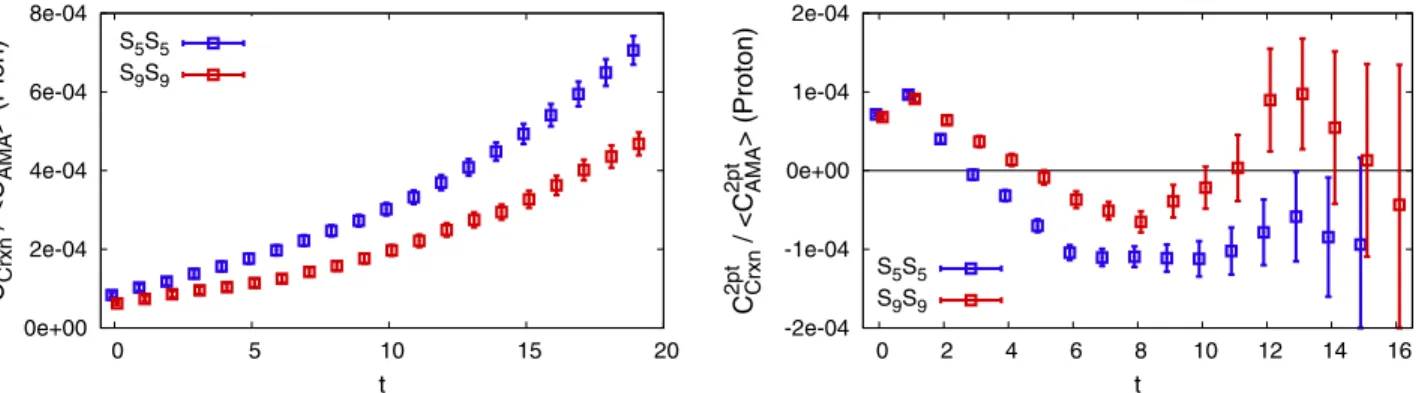
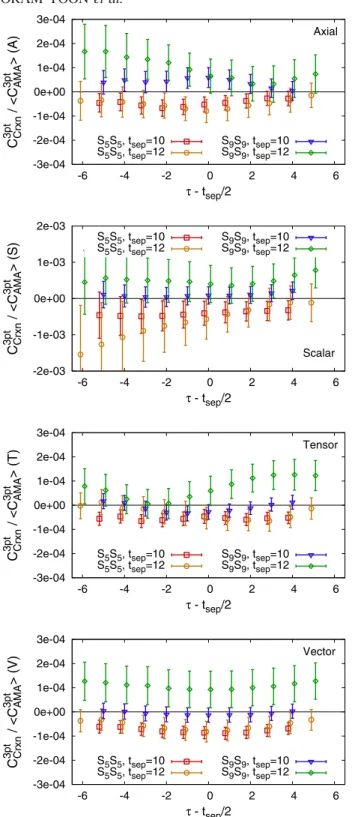
Controlling excited-state contamination in nucleon matrix elements
Texte intégral
Figure


Documents relatifs
Finally it should be noted that the rise of the fluorescence intensity and the collapse of the blue edge of the fluorescence band of O5b are associated with different time
5 We present picosecond pump-probe experiment performed on catechol to see if the number of vibrational quanta observed in the internal distribution of the H-loss product
This may be due to some remaining parallel centres or to a non- resolved magnetic substructure in the MCD bands, very-much smaller but similar to that found below for
distribution of the y-rays emitted by the stopped nuclei, by using a thick F2Ba target to stop the recoil-. ing
Also shown are the calculated projected phase space factor in solid curves. The difference between this curve and the
2014 Standard minimal two-state Hamiltonian (spin-boson model) for a particle in a symmetric double-well potential, interacting with a bath, is complemented by a
The 780 nm E-S-A- remains higher than the 1012 nm G-S-A- but it is only 20% of 830 nm E-S-A- Indeed, a 780 nm upconversion pumping of Pr~+ doped Z-B-L-A- fiber requires a more
L’archive ouverte pluridisciplinaire HAL, est destinée au dépôt et à la diffusion de documents scientifiques de niveau recherche, publiés ou non, émanant des
