An ab initio study of multiple phonon scattering
resonances in silicon germanium alloys
The MIT Faculty has made this article openly available. Please share
how this access benefits you. Your story matters.
Citation Mendoza, Jonathan, Keivan Esfarjani, and Gang Chen. “An Ab
Initio Study of Multiple Phonon Scattering Resonances in Silicon Germanium Alloys.” Journal of Applied Physics 117, no. 17 (May 7, 2015): 174301.
As Published http://dx.doi.org/10.1063/1.4919661
Publisher American Institute of Physics (AIP)
Version Author's final manuscript
Citable link http://hdl.handle.net/1721.1/96934
Terms of Use Creative Commons Attribution-Noncommercial-Share Alike
An ab initio study of multiple phonon scattering
resonances in silicon germanium alloys
Jonathan Mendoza1, Keivan Esfarjani2,3, Gang Chen1
1. Department of Mechanical Engineering, Massachusetts Institute of Technology, Cambridge, Massachusetts, 02139, USA
2. Department of Mechanical and Aerospace Engineering, Rutgers University, Piscataway, New Jersey, 08854, USA
3. Institute for Advanced Materials, Devices and Nanotechnology, Rutgers University, Piscataway, New Jersey, 08854, USA
Abstract:
We have computed phonon scattering rates and density of states in silicon germanium alloys using Green’s function calculations and density functional theory. This method contrasts with the virtual crystal approximation (VCA) used in conjunction with Fermi’s golden rule, which cannot capture resonance states occurring through the interaction of substitutional impurities with the host lattice. These resonances are demonstrated by density of states and scattering rate calculations in the dilute limit and show broadening as the concentration increases. Although these deviations become significant from the VCA at high frequencies, the relaxation times obtained for these phonon modes are small in both the full scattering theory and the VCA, resulting in their negligible contribution to thermal transport.
I. Introduction:
Understanding how phonon scattering contributes to heat transport in solid materials provides a framework to synthesize materials with exceptionally low thermal conductivities for thermoelectric energy conversion applications.1,2 By
conductance,3 one can engineer disorders through alloying,4 interface roughening,5
or nanostructures6,7,8 to suppress the dominant phonon modes, leading to a
decrease in thermal conductivity.
Alloying has yielded great success in reducing phonon thermal conductivity due to the effects of impurity scattering. Modeling alloy scattering’s effects upon thermal conductivity currently relies upon the virtual crystal approximation (VCA) and Rayleigh scattering law, where the scattering rate scales with the fourth power of frequency.4 The VCA4,9 replaces the disordered crystal with a homogenous
system of averaged masses and interatomic force constants. It is currently unclear how and to what extent the VCA and Rayleigh scattering law fail for alloys at high frequencies, although thermal conductivity fitting based on a phenomenological model4 has led to good agreement with experiment.
The advent of first principles methods10–13 allowed for mode-by-mode
computation of harmonic properties as well as inelastic scattering rates due to anharmonicity, which led to an accurate prediction of thermal conductivity of crystalline materials. Garg et al. extended the first-principles framework to alloys using the VCA and found good agreements between the measured and calculated thermal conductivity of SixGe1-x.14 The same approach was applied to other
disordered systems such as PbTe/Se,15 Bi1-xSbxTe3,16 and Mg2SixSn1-x.17 However,
the scattering rates of these systems used first order perturbation theory (single scattering) despite the presence of large impurity concentrations. As the concentration of impurities in an alloy leaves the dilute limit, multiple scattering and resonant scattering can occur. There have been no rigorous studies on the validity of VCA and multiple scattering effects on phonon thermal transport. Kundu et al. studied multiple scattering phenomena of Si and Ge nanoparticles embedded in a Si0.5Ge0.5 alloy by using Green’s functions to calculate nanoparticle scattering in
the homogenized medium defined by the VCA.18
In this paper, we investigate the failure of VCA in alloys by using full-order scattering theory through the computation of Green’s function matrix elements in the spatial representation.19 Through the general scattering theory formalism
distribution of scattering centers embedded in a host medium. This formalism has been used to study nanostructures embedded in graphene20 and Si0.5Ge0.5 alloy.18 In
this work we will focus on scattering due to mass disorder and neglect the effects of inelastic phonon-phonon scattering. By computing the Green’s function of the system perturbed by disorder, local phonon density of states are obtained and compared to the VCA.4,9 We found that although the VCA approximation and first
order perturbation theory clearly fails at high frequency, the large scattering rates in this regime calculated from both the VCA approximation and the multiple scattering theory means that these high frequency phonons do not contribute much to heat conduction, and hence explains why the VCA approximation together with the first order perturbation theory still leads to satisfactory comparison with experimental data on the thermal conductivity of alloys. The multiple scattering picture facilitates an understanding of phonon transport processes in disordered materials.
II. Scattering Theory Described through Green’s Function:
Phonon dynamics are governed by the eigenvalue equation 2Mu = Ku where
M is the mass matrix, K is the force constant matrix which couples the vibrational degrees of freedom, and is the eigenvalue corresponding to the frequency of a particular phonon mode.21 The inversion of this eigenvalue equation yields the
unperturbed Green’s function of a given phonon branch and frequency. The unperturbed Green’s function can be expressed in the spatial representation as,
𝐺0+(𝒙, 𝒚; 𝜔2) = ∑ ⟨𝒙∣𝒌⟩⟨𝒌∣𝒚⟩ 𝜔2−𝜔2(𝒌)+𝑖𝜖
𝒌
(1)
where |k> is the phonon wavevector eigenstate, |x> and |y> are the displacement vectors of the atom located at the coordinate x and y in the tight binding representation, 2 is a complex scalar, and 2(k) is the dispersion relation of a
particular phonon branch.
In the tight binding representation, diagonal disorder corresponds to a perturbation in the mass of a host atom. More explicitly, this disorder can be
defined as a diagonal matrix in the impurity subspace V = -(m’-m)2/m where m is
the mass of the original atom and m’ is the mass of the substitution. Introducing the T-matrix to describe elastic transitions between momentum eigenstates,
𝑇(𝜔2) = 𝑉 + 𝑉𝐺
0𝑉 + ⋯ = (1 − 𝑉𝐺0)−1𝑉
(2)
we can compute the Green’s function of the perturbed system as 𝐺(𝜔2) = 𝐺
0+ 𝐺0𝑇𝐺0
(3)
noting that the frequency arguments on the right hand side are implicit. Each successive term in the expansion of (2) corresponds to the single scattering process, double scattering process, etc. between the impurity degrees of freedom and the medium. Since mass disorder breaks the translational symmetry of the system, the diagonal elements of the perturbed Green’s function are coordinate dependent. Additionally, since the density of states can be defined as,
𝜌(𝒙 ; 𝜔2) = −1
𝜋 𝐼𝑚(𝐺(𝒙, 𝒙; 𝜔
2))
(4)
a spatially dependent density of states, the local DOS, can be defined from the diagonal terms of the perturbed Green’s function. Due to the analytical structure of the T-matrix, resonance states may occur as VG0 ~ 1. Physically, this resonance
stems from the constructive interference of the multiple scattering processes of a system of impurities. Using the optical theorem, the impurity scattering rate for a particular branch can be computed as
𝜏𝑖𝑚𝑝−1 = 𝛺𝑓𝑖𝑚𝑝
2𝜔2𝑉𝑖𝑚𝑝𝐼𝑚[⟨𝒌|𝑇(𝜔2)|𝒌⟩]
(5)
where Ω is the volume of the unit cell, fimp is impurity concentration, and Vimp is the
volume of the impurity.18–20 The presence of the T-matrix implicitly in (4) and
explicitly in (5) can lead to a resonant local density of states and scattering rate. The unperturbed Green’s functions can be obtained from the phonon dispersion solved by the diagonalization of the dynamical matrix. The dynamical matrix of Si is constructed from the second-order interatomic force constants following the work of Ref. [10]. The actual integration method to perform Eq. (1) is
best achieved by using the tetrahedron interpolation method.22 The tetrahedron
method computes the imaginary part of the Green’s function while the real part is obtained through the Kramers-Kronig relations. The Green’s function matrix elements were computed on a k-mesh of 20x20x20, 30x30x30, and 40x40x40 in size in order to determine convergence behavior. The matrix elements converged at the 20x20x20 grid density; consequently, all of the calculations in this work use the 20x20x20 grid.
Perturbations corresponding to diagonal disorder (mass mismatch) were implemented on a finite diamond cubic lattice that contained up to 500 impurities. We assumed that the Germnaium impurity atoms did not change the lattice constant of the system for an arbitrary degree of impurity concentration. Due to discrete translational symmetry, all of the Green’s function matrix elements were precomputed to save time during the configurational averaging of 200 samples. The computation of the T-matrix, perturbed Green’s function, scattering rate, and local density of states then follow from the computation described earlier.
To verify the geometric series representation of the perturbation series of the T-matrix, the scattering rate of a single impurity was compared to the Born approximation used by Tamura23 which in this work is achieved by truncating the
series to first-order. The T-matrix can also be justified by computing the angular dependent scattering amplitudes of a 2 nm x 2 nm x 2 nm Ge nanoparticle at long wavelengths in order to see Rayleigh scattering behavior. For acoustic branch frequencies lower than ~ 1 THz, an isotropic scattering amplitude is obtained, which corresponds to the Rayleigh limit (first-order). At larger frequencies, the scattering profile becomes more and more anisotropic.24
FIG. 1. Local density of states (LDOS) of the TA1 phonon branch for a single Ge impurity embedded in a Si lattice (blue). The Si neighbor (red) is the nearest neighbor to the impurity. The Si density of states (green) is shown for comparison. The normalization is chosen such that the integral of the TA1 bulk density of states (in THz) is unity. The inset provides a visual representation of the Ge impurity embedded in the Si lattice. The Si neighbor corresponds to the adjacent Si atom in the inset.
III. Results and Discussion:
Resonances arise from the multiple scattering interaction by impurities embedded in a bulk crystal. Mathematically, this arises from the singularity through the denominator of the T-matrix. Resonances should correspond to strong deviations in the scattering rate and density of states calculations obtained from the VCA. To see the effects of resonant scattering, we first calculate the LDOS of a single impurity. Figure 1 shows the LDOS for a Ge atom embedded in a Si host. The resonance dominates the LDOS since the second term in Eq. (3) is so much larger than the first. The resonant frequency is ~2.2 THz for the TA1 branch and coincides with the resonance in the scattering rate (Fig.2). The LDOS for the nearest neighbor Si provides insight into the coupling between an impurity and its host crystal. The LDOS exists as a hybridization of the resonant state and the original Si DOS. As one
moves further away from the impurity, the strength of the resonance becomes weaker and the LDOS starts to look more like the original band structure. A calculation of the LDOS of the surrounding atoms allows for a determination of the length scale with which the resonance of the impurity atom couples to degrees of freedom within the bulk system.
Introducing more than one impurity can make the analysis of the scattering calculations nontrivial if the inter-impurity spacing becomes too small. As the space between impurities decreases, the off-diagonal matrix elements of the Green’s function become comparable to the diagonal terms, resulting in a T-matrix that cannot be put into block diagonal form. In other words, a system, in high enough impurity concentration, cannot be decomposed into clusters of scattering centers. Figure 2 demonstrates the difference between a single Ge impurity that is resonantly interacting with the Si host lattice and two Ge impurities that are spaced close enough together that they can no longer be treated as being independent of one another due to multiple scattering.
FIG. 2. Scattering rate of a TA1 phonon by a single Ge impurity (solid line) and two Ge impurities (dashed line) spaced 0.5 nm apart. The magnitude of the scattering rates are normalized by the number of impurities.
The pronounced difference between the scattering rate of a single impurity and two closely spaced impurities highlights the effect of strong coupling in the impurity subspace. This coupling causes the resonance to split to frequencies above and below the original resonant frequency. Calculations were also performed for a system of three closely spaced impurities. The effect of multiple scattering causes an even greater splitting in the three-impurity system for the same inter-impurity spacing.
The resonances from multiple scattering demonstrated by the scattering rate computations yield insight into the behavior of alloys, especially at high frequencies and alloy concentrations. In the dilute limit, the T-matrix should be approximately diagonal, allowing for relaxation time computations to be performed as a sum over independent scattering centers. As the alloy concentration increases, the mean impurity spacing decreases, resulting in a broadening of resonance impurity modes over a wide range of frequencies. The average local density of states
𝜌𝑎𝑣𝑔(𝜔2) = 𝑁1∑𝑥∈𝐷−1𝜋 𝐼𝑚[𝐺(𝒙, 𝒙; 𝜔2)]
(6)
FIG. 3. Averaged local density of states for a single configuration of Ge impurities at 20% concentration for the acoustic phonon branches.
is able to capture the resonance splitting behavior. The averaged local density of states of a single configuration for the three acoustic branches is shown in Fig. 3 for a 20 percent Ge alloy concentration. The 20 percent alloy concentration is a clear departure from the dilute limit, which yields an averaged LDOS that is a weighted superposition of the original Si DOS and Ge resonance. Since the Ge impurity resonance is at a frequency far below band edge for the LA branch, it does not affect this branch as much as the two transverse branches.
The original Si band structure is still retained at frequencies above and below the range of frequencies corresponding to the resonant splitting. By further increasing the alloy concentration, the original Si bandstructure is obfuscated by the overwhelming influence of the strongly coupled Ge resonances. Calculations above 50 percent concentration demonstrate no signs of the underlying Si host lattice, corresponding to a failure of perturbation theory. Furthermore, at large enough concentrations, it is unjustified to naively choose Si as the host crystal. High-frequency phonons in a strongly disordered system will be scattering off of Si and Ge atoms.
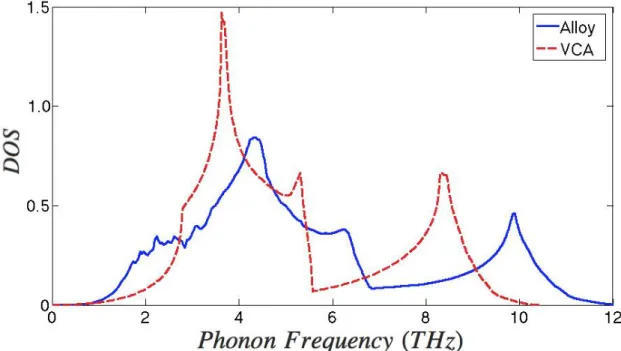
Figure 4 demonstrates the comparison of the ensemble averaged local density of states of a 20 percent impurity concentration system with the density of states obtained through the VCA. The DOS agrees well at long wavelengths since the phonons cannot probe the local inhomogeneity of the disordered system. Mathematically this corresponds to a diagonal T-matrix at small frequencies, which allows for the contributions of impurities to be individually summed over, providing the same configurationally averaged Green’s function as the one obtained from the VCA. It is therefore justifiable to assume that these phonons are governed by the effective medium represented by the VCA.
At the THz range, however, the effects of resonances cause strong deviations from the VCA. The resonance broadening destroys the 2 behavior corresponding
to non-dispersive phonon modes. Additionally, failures of the VCA are also captured at even higher frequencies. Since the differences in force constants are much
smaller than the mass differences of Si and Ge, the VCA merely rescales the DOS to lower frequencies. This uniform scaling over the entire range of phonon frequencies contradicts the results from explicit Green’s function calculations beyond the long wavelength regime.
These findings imply more accurate methods to accurately calculate scattering rates due to nanoparticles embedded in alloy systems. Previous works computed the T-matrix from green’s function using the VCA.18 Unfortunately, this
method does not appropriately capture the high frequency scattering rates due to the deviations of the Green’s function demonstrated by Fig. 3 and Fig. 4. In order to improve the calculations, the configurationally averaged Green’s function matrix elements should be explicitly computed from Eq. 3 as performed in this work. These matrix elements for the Green’s function should then serve as inputs to the T-matrix calculation of an embedded nanoparticle. These corrections should become significant for cases where there are large discrepancies between the VCA and an explicit computation for the Green’s function, which primarily occurs when impurities resonantly interact with the host system.
Even though the resonance broadening stemming from the Ge impurities generate large discrepancies in the DOS for frequencies larger than 1.2 THz, these modes do not contribute significantly to the thermal conductivity due to the large elastic scattering rate which roughly scales as ~ 4.
FIG. 4. Configurational averaged density of states computed using the perturbed Green’s function (blue) vs. density of states obtained through the virtual crystal approximation (red).
In other words, despite the existence of nontrivial behavior stemming from multiple scattering at high frequencies, the impurities act as a low-pass filter, preventing these modes from contributing to thermal transport.
Although not implemented in this work, the scattering theory formalism allows for off-diagonal disorder, which will be necessary for systems with small mass mismatch.25 Additionally, we can also increase the accuracy of thermal
conductivity calculations by analyzing angle-dependent scattering rates. In a sufficiently disordered system, anisotropic scattering profiles render the relaxation time approximation26 (RTA) inaccurate. Consider an extreme example of a
disordered system that exhibits coherent backscattering due to the onset of localization; the RTA treats backscattered phonons with equal weight despite having a larger effect upon diffusive thermal transport. Multiple scattering theory can therefore be used to justify the validity of the RTA.
IV. Conclusion
scattering in Si-Ge alloys in order to examine the validity of the VCA that has been used in all of the past treatments of phonon heat conduction in alloy systems. The Green’s function approach allows inclusion of multiple scattering and resonant effects that are absent from the VCA approach. A Ge atom embedded in a Si host creates a local resonance state, which splits into multiple states as the Ge concentration increases. The configurationally averaged DOS is distinctly different from that of the VCA approximation at high frequencies. However, at these high frequencies, the relaxation times obtained for these phonon modes are small in both the full scattering theory and the VCA, resulting in their negligible contribution to thermal transport.
Acknowledgment:
We would like to thank Jivtesh Garg, Vazrik Chiloyan, and Sangyeop Lee for fruitful discussions. Funding support for this work was provided by the “Solid State Solar-Thermal Energy Conversion Center (S3TEC)”, an Energy Frontier Research Center funded by the U.S. Department of Energy, Office of Science, Office of Basic Energy Sciences, under Award Number: DE- SC0001299/DE-FG02-09ER46577.
References:
1 H.J. Goldsmid, Introduction to Thermoelectricity (Springer Science & Business
Media, 2009), p. 258.
2 M. Zebarjadi, K. Esfarjani, M.S. Dresselhaus, Z.F. Ren, and G. Chen, Energy &
Environmental Science 5, 5147 (2012).
3 T. Gibbons and S. Estreicher, Physical Review Letters 102, 255502 (2009). 4 B. Abeles, Physical Review 131, 1906 (1963).
5 A.I. Hochbaum, R. Chen, R.D. Delgado, W. Liang, E.C. Garnett, M. Najarian, A.
Majumdar, and P. Yang, Nature 451, 163 (2008).
6 B. Poudel, Q. Hao, Y. Ma, Y. Lan, A. Minnich, B. Yu, X. Yan, D. Wang, A. Muto, D.
Vashaee, X. Chen, J. Liu, M.S. Dresselhaus, G. Chen, and Z. Ren, Science (New York, N.Y.) 320, 634 (2008).
7 G. Joshi, X. Yan, H. Wang, W. Liu, G. Chen, and Z. Ren, Advanced Energy Materials 1,
643 (2011).
8 N. Mingo, D. Hauser, N.P. Kobayashi, M. Plissonnier, and A. Shakouri, Nano Letters 9, 711 (2009).
9 R.J. Elliott, J.A. Krumhansl, and P.L. Leath, Reviews of Modern Physics 46, 465
(1974).
10 K. Esfarjani and H.T. Stokes, Physical Review B 77, 144112 (2008).
11 K. Esfarjani, G. Chen, and H.T. Stokes, Physical Review B 84, 085204 (2011). 12 D.A. Broido, M. Malorny, G. Birner, N. Mingo, and D.A. Stewart, Applied Physics
Letters 91, 231922 (2007).
13 D.A. Broido, A. Ward, and N. Mingo, Physical Review B 72, 014308 (2005). 14 J. Garg, N. Bonini, B. Kozinsky, and N. Marzari, Physical Review Letters 106,
045901 (2011).
15 Z. Tian, J. Garg, K. Esfarjani, T. Shiga, J. Shiomi, and G. Chen, Physical Review B 85,
184303 (2012).
16 N.A. Katcho, N. Mingo, and D.A. Broido, Physical Review B 85, 115208 (2012). 17 W. Li, L. Lindsay, D. a. Broido, D. a. Stewart, and N. Mingo, Physical Review B 86,
174307 (2012).
18 A. Kundu, N. Mingo, D.A. Broido, and D.A. Stewart, Physical Review B 84, 125426
(2011).
19 E. Economou, Green’s Functions in Quantum Physics, 3rd ed. (Springer, New York,
1984).
20 N. Mingo, K. Esfarjani, D.A. Broido, and D.A. Stewart, Physical Review B 81,
045408 (2010).
21 C. Kittel, Introduction to Solid State Physics, 8th ed. (Wiley, New York, 1976). 22 P. Lambin and J.P. Vigneron, Physical Review B 29, 3430 (1984).
23 S.I. Tamura, Physical Review B 27, 858 (1983).
25 N.A. Katcho, J. Carrete, W. Li, and N. Mingo, Physical Review B 90, 094117 (2014). 26 M. Omini and A. Sparavigna, Nuovo Cimento D Serie 19, 1537 (1997).
List of Figure Captions:
FIG. 1. Local density of states (LDOS) of the TA1 phonon branch for a single Ge impurity embedded in a Si lattice.
FIG. 2. Scattering rate of a TA1 phonon by a single Ge impurity and two Ge impurities spaced 0.5 nm apart.
FIG. 3. Averaged local density of states for a single configuration of Ge impurities at 20% concentration for the acoustic phonon branches.
FIG. 4. Configurational averaged density of states computed using the perturbed Green’s function vs. density of states obtained through the virtual crystal
List of Figures:
FIG. 1. Local density of states (LDOS) of the TA1 phonon branch for a single Ge impurity embedded in a Si lattice (blue). The Si neighbor (red) is the nearest neighbor to the impurity. The Si density of states (green) is shown for comparison. The normalization is chosen such that the integral of the TA1 bulk density of states (in THz) is unity. The inset provides a visual representation of the Ge impurity embedded in the Si lattice. The Si neighbor corresponds to the adjacent Si atom in the inset.
FIG. 2. Scattering rate of a TA1 phonon by a single Ge impurity (solid line) and two Ge impurities (dashed line) spaced 0.5 nm apart. The magnitude of the scattering rates are normalized by the number of impurities.
FIG. 3. Averaged local density of states for a single configuration of Ge impurities at 20% concentration for the acoustic phonon branches.
FIG. 4. Configurational averaged density of states computed using the perturbed Green’s function (blue) vs. density of states obtained through the virtual crystal approximation (red).