Automated conservation assessment of the orchid
family with deep learning
Alexander Zizka
,
1,2Daniele Silvestro
,
3,4Pati Vitt
,
1,5and Tiffany M. Knight
1,6,71German Center for Integrative Biodiversity Research (iDiv) Halle-Jena-Leipzig, Deutscher Platz 5e, Leipzig, 04103, Germany 2Naturalis Biodiversity Centre, P.O. Box 9517, Leiden, 2300RA, the Netherlands
3Department of Biology, University of Fribourg, 1700 Fribourg, Ch. de Musee 10, Switzerland
4Gothenburg Global Biodiversity Center, University of Gothenburg, Box 461, Gothenburg, 405 30, Sweden 5Plant Biology and Conservation, Northwestern University, Evanston, IL 60208, U.S.A.
6Institute of Biology, Martin Luther University Halle-Wittenberg, Am Kirchtor 1, 06108 Halle (Saale), Germany
7Department of Community Ecology, Helmholtz Centre for Environmental Research - UFZ, Theodor-Lieser-Strasse 4, 06120 Halle (Saale), Germany
Abstract: International Union for Conservation of Nature (IUCN) Red List assessments are essential for priori-tizing conservation needs but are resource intensive and therefore available only for a fraction of global species richness. Automated conservation assessments based on digitally available geographic occurrence records can be a rapid alternative, but it is unclear how reliable these assessments are. We conducted automated conservation assessments for 13,910 species (47.3% of the known species in the family) of the diverse and globally distributed orchid family (Orchidaceae), for which most species (13,049) were previously unassessed by IUCN. We used a novel method based on a deep neural network (IUC-NN). We identified 4,342 orchid species (31.2% of the evaluated species) as possibly threatened with extinction (equivalent to IUCN categories critically endangered [CR], endangered [EN], or vulnerable [VU]) and Madagascar, East Africa, Southeast Asia, and several oceanic islands as priority areas for orchid conservation. Orchidaceae provided a model with which to test the sensitivity of automated assessment methods to problems with data availability, data quality, and geographic sampling bias. The IUC-NN identified possibly threatened species with an accuracy of 84.3%, with significantly lower geographic evaluation bias relative to the IUCN Red List and was robust even when data availability was low and there were geographic errors in the input data. Overall, our results demonstrate that automated assessments have an important role to play in identifying species at the greatest risk of extinction.
Keywords: biodiversity, data quality, IUC-NN, IUCN Red List, machine learning, Orchidaceae, sampling bias Evaluación Automatizada de la Conservación de la Familia Orchidaceae mediante Aprendizaje Profundo
Resumen: Los análisis de la Lista Roja de la Unión Internacional para la Conservación de la Naturaleza (UICN) son esenciales para la priorización de las necesidades de conservación, pero requieren de muchos recursos y por lo tanto están disponibles sólo para una fracción de la riqueza mundial de especies. Las evaluaciones automati-zadas de la conservación basadas en los registros disponibles de presencia geográfica pueden ser una alternativa rápida pero no está claro cuán confiables son estas evaluaciones. Realizamos evaluaciones automatizadas de la conservación para 13,910 especies (47.3% de las especies conocidas de la familia) de la diversa y mundialmente distribuida familia de las orquídeas (Orchidaceae), en la cual la mayoría de las especies (13,049) no tenían una valoración previa por parte de la UICN. Usamos un método novedoso basado en una red neural profunda (IUC-NN). Identificamos 4,342 especies de orquídeas (31.2% de las especies evaluadas) como posiblemente amenazadas por la extinción (equivalente a las categorías de la UICN en peligro crítico [CR], en peligro [EN] o vulnerable
Address correspondence to: A. Zizka, email [email protected]
Article impact statement: An automated conservation assessment with deep learning reveals global centers of orchid extinction risk.
Paper submitted June 11, 2020; revised manuscript accepted August 17, 2020.
This is an open access article under the terms of the Creative Commons Attribution-NonCommercial License, which permits use, distribution and reproduction in any medium, provided the original work is properly cited and is not used for commercial purposes.
[VU]) y a Madagascar, África Occidental, el sudeste de Asia y varias islas oceánicas como áreas prioritarias para la conservación de orquídeas. La familia Orchidaceae proporcionó un modelo con el cual probar la sensibilidad de los métodos de evaluación automatizada ante problemas con la disponibilidad de datos, la calidad de los datos y los sesgos de muestreo geográfico. La IUC-NN identificó posibles especies amenazadas con una certeza de 84.3% con un sesgo de evaluación geográfica significativamente más bajo en relación con la Lista Roja de la UICN y mostró solidez incluso cuando la disponibilidad de datos fue baja y hubo errores geográficos en los datos de entrada. En general, nuestros resultados demostraron que las evaluaciones automatizadas tienen un papel importante que desempeñar en la identificación de especies con mayor riesgo de extinción.
Palabras clave:aprendizaje mecánico, biodiversidad, calidad de datos, IUC-NN, Lista Roja UICN, Orchidaceae, sesgo de muestreo
Introduction
Prioritizing the use of conservation resources is essen-tial to counter the current global biodiversity crisis (Ro-drigues et al. 2006). The scheme the International Union for the Conservation of Nature (IUCN) uses to devise its global red list (RL) is the most widely used tool for evaluation of species’ risk of extinction and is based on rigorous criteria and the best available scientific informa-tion (Rodrigues et al. 2006; Pfab et al. 2011). Through a standardized method, the IUCN scores species’ popu-lation size, range size, popupopu-lation trends (decline or in-crease), and threats to place species in extinction risk categories (Collen et al. 2016; IUCN Standards and Peti-tions Subcommittee 2017). Due to the rigor of the pro-cess, IUCN requires extensive data, expertise, and time (Roberts et al. 2016); thus, only a fraction of species are listed for many taxa (e.g., plants) and geographic areas (i.e., the tropics). For example, only around 10% of flowering plant species are listed on the IUCN RL (www.iucn.org).
Orchidaceae is a diverse, globally important plant fam-ily in great need of conservation assessment and prior-itization (Cribb et al. 2003; Swarts & Dixon 2017; Fay 2018). There are approximately 29,000 orchid species. They occur on all continents except Antarctica, have a variety of life forms, from terrestrial to epiphytic (Givnish et al. 2016). Many orchid species are local endemics, and their distributions are constrained by edaphic environ-ments and their relationships with mycorrhizal fungi and specialist pollinators (McCormick & Jacquemyn 2014; Gaskett & Gallagher 2018). Orchids are economically important in horticulture and in the floral, pharmaceu-tical, and food industries (Subedi et al. 2013; Hinsley et al. 2018), and many species are threatened by land conversion and illegal harvesting (Hinsley et al. 2017; Fay 2018). Their global trade is so problematic that the Convention on Intentional Trade in Endangered Species of Wild Fauna and Flora lists all orchid species with ac-cepted names (Hinsley & Roberts 2018). Thus, there is an urgent need for identifying the most endangered species to prioritize in situ protection and ex situ conservation programs.
The need to speed up conservation assessments has triggered the development of automation methods, of-ten based on digitally available species distribution data (e.g., from www.gbif.org). These automated assessments (AAs) can facilitate the prioritization of species for full assessments through a triage approach, automate aspects of a full red-list assessment, and provide preliminary best estimates of extinction risk until further analyses become available. There are 2 distinct types of methods available: index based and prediction based. Index-based methods apply multiple indices to characterize a species range size and apply IUCN Criterion B thresholds to classify species into IUCN RL categories. Multiple index-based methods (Bachman et al. 2011; Cardoso 2017; Dauby et al. 2017; Schmidt et al. 2017) are used to support the IUCN RL assessment process or, with additional assump-tions on habitat destruction and threat, as stand-alone preliminary assessments (Schmidt et al. 2017; Cosiaux et al. 2018; Zizka et al. 2020b). Prediction-based meth-ods combine existing IUCN RL assessments with species traits to predict the conservation status of not evalu-ated or data-deficient species (Bland et al. 2015; Pelletier et al. 2018; González-del-Pliego et al. 2019; Lughadha et al. 2019) and include machine learning algorithms. Prediction-based methods may be based on the same indices on species’ ranges as index-based methods, but they also incorporate additional traits, such as climatic niche, biomes, human footprint index, geographic re-gion, or traits related to species morphology or physi-ology (Bland et al. 2015; Di Marco & Santini 2015).
Although existing AA methods can separate threat-ened (IUCN RL categories CR, EN, and VU) from not threatened (near threatened [NR] and least concern [LC]) species with an accuracy of 80–95% in animals (Bland et al. 2015), accuracy appears to be lower for or-chids (51–84% in a taxonomically and geographically lim-ited sample of 116 species from New-Guinea [Lughadha et al. 2019]). A known problem with index-based AAs is that their dependency on data availability means they overestimate the extinction risk of species with few occurrence records (Rivers et al. 2011). However, the dependency on data availability remains untested for prediction-based methods. Furthermore, it is currently
unknown how robust AAs are to erroneous geographic input data and geographic sampling bias (Walker et al. 2020).
We used AA to determine the conservation status of 13,910 orchid species (47.3% of all known species). We used digitally available occurrence data and tested the sensitivity of the results to method choice, data availabil-ity, errors in the geographic input data, and sampling bias. Specifically, we addressed 3 questions. First, how threatened are orchids and where are the global centers of extinction risk for orchid species? Based on the IUCN RL, we expected approximately 30% of orchids to be identified as possibly threatened (equivalent to the IUCN RL categories CR, EN, or VU). Second, how accurate are different AA methods? Based on the existing smaller-scale studies, we expect an accuracy of 60–90% (Lughadha et al. 2019) and a susceptibility to overestimate the threat status of narrow-ranged species. Third, how robust are AAs to limitations in data availability, variable data qual-ity, and geographic sampling biases? Digitally available species occurrence records are often biased toward cer-tain geographic regions (Meyer et al. 2016; Daru et al. 2018; Zizka et al. 2020a) and contain erroneous or very imprecise coordinates (Zizka et al. 2019, 2020c). There-fore, we expected a bias of AA toward well-sampled geo-graphic areas and life forms and an increase in accuracy with geographic cleaning (i.e., removing records with er-roneous coordinates, e.g., coordinates in the sea).
Methods
Orchid Extinction Risk
To address question 1, we used the taxonomy of the World Checklist of Selected Plant Families (WCSP 2019), and obtained records of orchid species on 26 August 2019 from the Global Biodiversity Information Facility (www.gbif.org, 2019). We then obtained full IUCN as-sessments (IUCN 2019) and standardized them into the 5 most relevant threat categories: CR, EN, VU, NT, and LC. We excluded species assessed under red-list versions older than 3.1 and species assessed as data deficient.
We implemented a deep neural network algorithm (Goodfellow et al. 2016)—IUC-NN—as an R package (IUCNN, available at https://github.com/azizka/IUCNN) based on the Python (version 3.7) TensorFlow (https:// www.tensorflow.org) library to predict the conservation status of unevaluated orchid species. We based the pre-dictions on 4 groups of features, derivable from digitally available occurrence records: geographic (mean latitude and longitude, longitudinal and latitudinal range, extent of occurrence [EOO], area of occupancy [AOO], number of locations [sensu IUCN], and occurrence records); cli-matic (mean of 19 bioclim variables [Karger et al. 2017]); biome (presence in 14 biomes [Olson et al. 2001]); and
anthropogenic (mean Human Footprint Index [Wildlife Conservation Society & International Earth Science In-formation Network 2005]).
We trained IUC-NN on all species with an IUCN RL as-sessment and available occurrence records. Prior to the training, we randomly split the data set into a training set (90% of the entries) and a test set (10%). We used 20% of the training set for validation. Because the size of the data set was comparatively small, we performed cross-validation by shifting the validation set 5 times to quantify the average validation cross-entropy loss and ac-curacy. We then used the neural network with the lowest cross-entropy loss across a range of models with differ-ent numbers of hidden layers and subsets of features to predict the conservation status of all orchid species at 2 levels: binary (possibly threatened vs. not threatened) and detailed (CR, EN, VU, NT, and LC). See Supporting Information for details on the network architecture and training. We combined the IUC-NN assessments with dis-tribution data from WCSP to show the number and pro-portion of possibly threatened species and of evaluated species per geographic region (TDWG-level 3) (TDWG, International Working Group on Taxonomic Databases).
Because different habitats warrant different conserva-tion approaches, we also summarized the number of or-chid species and the fraction of threatened species in major biomes of the world. We classified species into biomes with the speciesgeocodeR package 2.0-10 (Töpel et al. 2017), if at least 5% of a species’ records occurred in this biome.
Accuracy of AA
To address question 2, we performed AAs of all species with an IUCN RL status and occurrence records with 3 index-based methods: ConR 1.2.2 (Dauby et al. 2017), speciesgeocodeR 2.0-10 (SPGC) (Schmidt et al. 2017; Töpel et al. 2017), and rCAT 0.1.5 (Moat 2017). ConR, SPGC, and rCAT calculate EOO and AOO based on geo-graphic occurrences and use thresholds of IUCN Crite-rion B to classify species into IUCN RL categories. Ad-ditionally, ConR calculates the number of locations at which a species occurs. We compared the accuracy of all 4 AA methods on both the binary and detailed levels. We used the existing IUCN RL as the standard. We com-puted full error matrices for both levels of assessment. For the binary assessment, we also calculated the fraction of false positives (not threatened species classified as pos-sibly threatened) and false negatives (threatened species classified as not threatened) produced with AA. See Sup-porting Information for details on the index-based AAs. Because the IUCN RL is biased both geographically and taxonomically (IUCN 2020), we repeated ConR accuracy tests with 4 additional reference data sets: a random sub-sample of IUCN RL (i.e., sub-sampled red list index [SRLI]) (Royal Botanic Gardens Kew 2010); species IUCN RL
assessed after 2008 (IUCN2008); species with at least 15
occurrence records available for AA (IUCN15), because
this number has been suggested as a minimum for AA (Rivers et al. 2011); and global conservation assessments from the ThreatSearch literature database (BGCI 2018). We tested these alternative references exclusively with ConR because we expected the other index-based meth-ods to yield similar results and the alternative data sets included too few species to train IUC-NN models.
Reliability of AA
To address question 3, we examined how the accuracy of AA depended on the number of occurrence records avail-able per species, different levels of geographic cleaning of the input data, and evenness of geographic sampling. See Supporting Information for details on the individual tests.
To test the effect of the number of available records on accuracy of AA, we used binomial regressions and logit link in the stats::glm function in R.
We compared the accuracy of ConR at levels of data curation in the occurrence records: raw, data down-loaded from GBIF scrubbed taxonomically; intermedi-ate, raw data subjected to automated removal of records with common geographic errors (Zizka et al. 2020c); and filtered, intermediate data with additional removal of records outside the known occurrence range of species from WCSP (2019). We ran this test only with ConR be-cause we expected the 2 other index-based methods to yield similar results and because we expected IUC-NN to be more robust against erroneous coordinates because the features used for IUC-NN prediction were mean val-ues across all records of a species.
To compare the presence of bias among AA and IUCN RL, we determined whether the observed differences in the statistical distribution of species over growth form types and geographic regions among all orchid species, IUCN RL assessed species, and species in our AA were greater than expected by random chance based on a null model in which we randomly permuted bias measure-ments among model types.
We performed all analyses in R (R Core Team 2019) and Python. Analyzed data and scripts are available (Sup-porting Information below).
Results
Orchid Extinction Risk
We obtained 3,321,927 records with complete names for 19,034 taxa from GBIF. Of those, we retained 3,050,875 records/17,971 species for the raw data set; 1,188,658 records/16,935 species for the intermediate data set, and 999,476 records/14,148 species for the
fil-tered data set (mean = 63 records/species, median = 4 records/species, 3296 species had >15 records). See Supporting Information for the effect of individual fil-ters. We obtained IUCN RL assessments for 1,404 species and retained 861 species (49.7% of them threatened) that had occurrence records available from GBIF and were as-sessed under the IUCN RL categories and criteria version 3.1.
We generated IUC-NN assessments for 13,910 species (47.3% of all species in the family [Supporting Infor-mation]). On the binary level, 9,772 (68.9%) species were classified as not threatened and 4,415 (31.1%) were classified as possibly threatened. On the detailed level, 10,733 species (75.7%) were classified as LC, 51 species (0.4%) as NT, 70 species (0.5%) as VU, 2,610 species (18.4%) as EN, and 723 species (5.1%) as CR. Because the accuracy of the binary assessments was higher, we focused the visualization of our results and discussion on these and provide results for the detailed assessment in the Supporting Information.
We identified 3 continental-level centers for orchid conservation with high numbers and proportions of pos-sibly threatened orchid species: northern South Amer-ica, East AfrAmer-ica, and Southeast Asia (Fig. 1a). Regions with the most possibly threatened species were Mada-gascar (646 species), Colombia (427), Borneo (369), and south-central China (364) (Fig. 1a). Of those ar-eas with >10 species, the 12 most relevant included 6 islands—La Réunion (73% of species possibly threat-ened), Mauritius (62%), Comoros (56%), Taiwan (51%), Seychelles (50%), and the Christmas Islands (50%)—and 6 continental regions—Madagascar (86%), south-central China (58%), Tibet (54%), Nepal (50%), Vietnam (49%), and eastern Himalayas (48%) (Fig. 1b & Supporting Information).
The number of possibly threatened orchid species was highest in the Tropical and Subtropical Moist Broadleaf Forest biome (3,254 species), following the general di-versity pattern of orchids (Fig. 2 & Supporting Infor-mation). In contrast, the proportion of possibly threat-ened species was highest in the Temperate Conifer For-est biome (45.8% of 365 species).
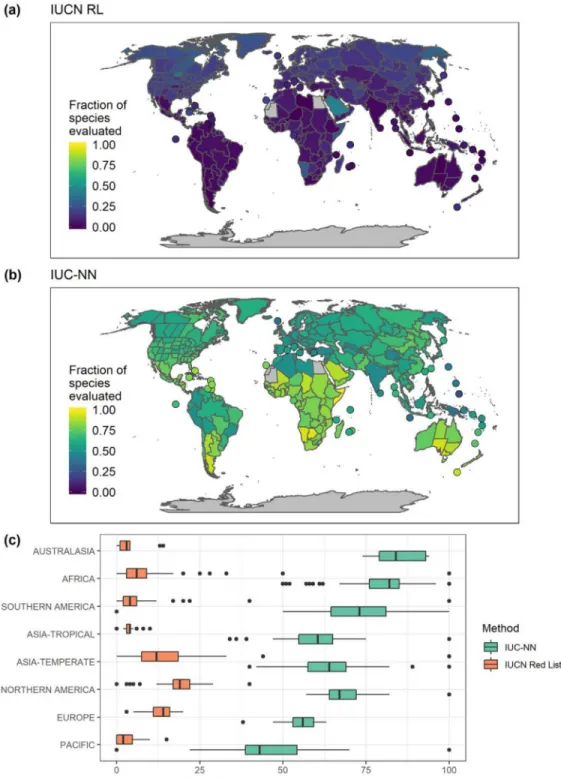
The IUC-NN increased the proportion of species eval-uated across regions by a median of 53% (Fig. 3). The largest increase in continental areas (TDWG level 3) was in Gambia (from 0% of species evaluated to 100%), south-ern Australia (from 1% to 94%), and southsouth-ern Argentina (from 0% to 92%).
Accuracy of AA
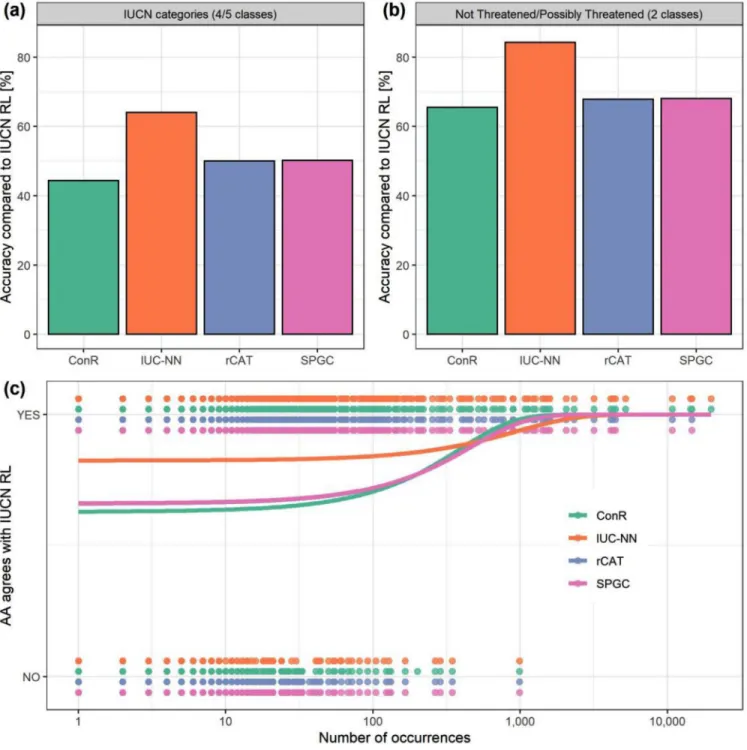
The accuracy of AA methods varied from 44.3% to 84.3%. As expected, accuracy was greater with binary assess-ments separating possibly threatened from not threat-ened species (65.5–84.3%) (Fig. 4b) than with the de-tailed assessments (44.3–64%) (Fig. 4a & Supporting
Figure 1. Global conservation status of orchids: (a) number of possibly threatened species per TDWG
(https:// www.tdwg.org/ ) geographic region, (b) proportion of possibly threatened species relative to the number of evaluated species (points, small islands and archipelagos with>10 known; red outlines, in [a] areas with the highest number and in [b] areas with the highest fraction of possibly threatened species). Regions refer to TDWG level 1.
Information). At both levels, accuracy was similar for the index-based methods but higher for IUC-NN (Fig. 4).
The best IUC-NN model considered binary threat levels, used only geographic features, and reached a test accuracy of 84.3% (88% positive predictive value and 79% negative predictive value) (Table 1). Adding other features decreased the validation accuracy, but it remained within approximately 5% of the best model (Supporting Information). The best IUC-NN model on the detailed level included geographic features and the Human Footprint Index and reached a test accuracy of 64% (Supporting Information). The accuracy was
generally high for CR, EN, and LC classes and low for the intermediate VU and NT classes (Supporting Infor-mation). Accuracy was highest for species the IUCN con-sidered threatened by natural systems modification and energy production and mining and lowest for species threatened by human intrusion and disturbance and pol-lution (Supporting Information). Relative to the IUCN RL, the accuracy of index-based methods to identify pos-sibly threatened and not threatened species was higher with IUCN15(69.9%, n= 359) and ThreatSearch (78.6%,
n = 14), similar with IUCN2008 (64.4%, n = 810), and
lower with SRLI (57.1%, n= 261) (Supporting Informa-tion).
Figure 2. Threat status of orchid species in different biomes (Olson et al. 2001).
Table 1. Confusion matrices for different automated assessments of automated conservation assessment methods compared with the IUCN Red List assess-ments. IUCN designation Automated method Spatial cleaning not threatened possibly
threatened Method type∗
ConR
not threatened full 75.1 24.9 index
possibly threatened full 38.8 61.2 index
not threatened medium 75.1 24.9 index
possibly threatened medium 36.4 63.6 index
not threatened raw 73.8 26.2 index
possibly threatened raw 35.3 64.7 index
rCat
not threatened full 68.3 31.7 index
possibly threatened full 32.5 67.5 index
speciesgeocodeR
not threatened full 68.5 31.5 index
possibly threatened full 32.4 67.6 index
IUC-NN best model
not threatened full 78.9 21.1 prediction
possibly threatened full 11.8 88.2 prediction
IUC-NN all features
not threatened full 81.6 18.4 prediction
possibly threatened full 29.4 70.6 prediction
∗For index-based methods, the results are for all species with digitally available occurrence records (n= 866). For prediction-based methods (IUC-NN), results are from the test data set (n= 89).
The training and cross-validation of the IUC-NN model took <24 h, and the IUC-NN assessments for all species based on the trained network took about 0.0005 s/species on a standard laptop. For the index-based meth-ods, the median computation time was 0.02 s/species for rCAT, 0.13 s for SPGC, and 0.31 s for ConR on a standard laptop (n = 945). Computation time increased as the number of records increased, in particular for ConR
(Sup-porting Information) (e.g., maximum 33.3 h for
Gym-nadenia conopseawith 31,055 records).
Reliability of AA
The accuracy of all index-based methods depended sig-nificantly on the number of records available (rCAT and SPGC: p = 0.016; ConR: p = 0.0056, n = 861), but
Figure 3. The fraction of orchid species per geographic region evaluated for their conservation status: (a) IUCN Red List, (b) IUC-NN (prediction-based automated conservation assessment), and (c) proportion of species evaluated on the continental scale under both schemes (data points, geographic [TDWG, https:// www.tdwg.org/ ] region; y-axis, number of percentage points by which IUC-NN increased the fraction of species evaluated).
this was not the case for IUC-NN (p = 0.14, n = 861) (Fig. 4c). The geographic filtering of the input data af-fected the accuracy of ConR only marginally (ranges: 65.5–68% among methods with the filtered data set,
67.1–68.7% with the intermediate data set, and 67.3– 67.4% with the raw data set).
The sampling intensity of the geographic input data was highest in Central and northern Europe, southern
Figure 4. The accuracy of different methods for automated conservation assessment (AA) (ConR, rCAT, and SPGC) compared with the IUCN Red List (RL): (a) accuracy when placing species into IUCN categories critically
endangered, endangered, vulnerable, not threatened, and least concern (last 2 are combined for the index-based methods), (b) accuracy of identification of species as possibly threatened or not threatened, and (c) probability of classifying species accurately as possibly threatened or not threatened depending on the number of occurrence records available per species (n= 861). In (c), the x-axis is not logarithmic and the curves for rCAT and SPGC are identical.
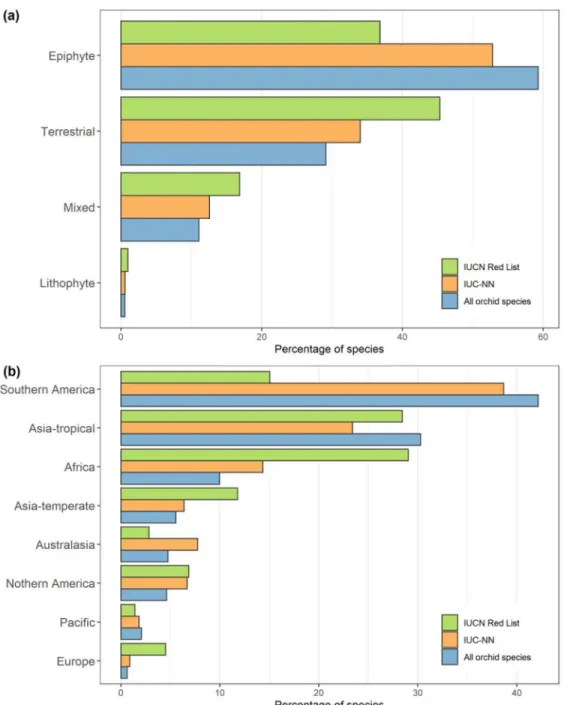
Australia, and northern and Central America and was low in Southeast Asia (Supporting Information). We found a difference in the evaluation frequency between the IUCN RL and AAs based on life form and geography. Terrestrial species were overrepresented on the IUCN RL (Fig. 5a), as were species from Africa, temperate Asia, and Europe
(Fig. 5b). Despite the strong bias in the availability of species occurrence data, we found significantly lower evaluation bias for AAs than for the IUCN RL with respect to life form (epiphytic, lithophytic, terrestrial, mixed [p= 0.00465]) and geographic region (p = 0.01855 [see Supporting Information for the interaction]).
Figure 5. Percentage of all orchid species, orchid species as assessed by the International Union for Conservation of Nature (IUCN), and orchid species as assessed with deep neural network (IUC-NN) categorized by (a) life form and (b) geography.
Discussion
Orchid Extinction Risk
We evaluated the extinction risk of 47.3% of all known orchid species and classified 4,342 orchid species (31.2% of the evaluated species) as possibly threatened, which is comparable to the recent estimate of 29.5% of global land plant species (Pelletier et al. 2018). On a more de-tailed scale, we classified 718 species (5.2%) as CR, 2,567 species (18.5%) as EN, and 68 species (0.5%) as VU (ques-tion 1). Because we could only evaluate species with
occurrence information, it is likely that an even greater proportion of the species we were unable to evaluate are possibly threatened. Indeed, the unsampled species are likely to be rare and therefore infrequently encountered or identified. We also found that extinction risk was not distributed equally across orchid’s growth forms, biomes, and geographic regions.
The distribution of the evaluated possibly threatened orchids was related to total species richness. There were large numbers of possibly threatened species in the species-rich tropics, especially the Neotropics, which is
an important center of diversification for orchids. There are over 11,000 species (Givnish et al. 2016) in the Oriental and Papua-Melanesian biogeographic regions. These centers of orchid extinction risk coincide well with known areas of endemism, and hence small range sizes, for all plants (Kier et al. 2009). In relation to to-tal species richness, we identified Madagascar, oceanic islands, and parts of East Asia as centers of possibly threatened species. For a continent, the North Ameri-can orchid flora is surprisingly depauperate (Gaskett & Gallagher 2018); few species in this region were pos-sibly threatened (Figs. 1 & 2). The pattern was similar for northern Europe and Asia, although there were some possibly threatened species in northern Asia. This gen-eral pattern may be associated with the climate of these northern temperate regions, concomitant with a high proportion of terrestrial species.
Our results confirmed that many orchid species need conservation (Dixon 2003; Fay 2018; Wraith & Pickering 2018; Liu et al. 2020). There is an abundance of expertise and information available to successfully implement con-servation strategies for both terrestrial (Swarts & Dixon 2009, 2017) and epiphytic species (Cribb et al. 2003; Swarts & Dixon 2017; Fay 2018). Most species face more than 1 threat and have limited distributions (Wraith & Pickering 2018). Until now, what has been lacking is a large-scale assessment of the conservation status of this large and highly diverse family, particularly for understud-ied species and geographic regions.
Benefits and Challenges of AAs
Identifying potentially threatened species at an accuracy of over 84% (64% for all 5 IUCN categories), IUC-NN outperformed methods based on range size indices and IUCN Criterion B, which had an accuracy of 65–68% (44– 50% for all categories) (question 2). The accuracy of IUC-NN in identifying possibly threatened species compared with the expert-verified IUCN RL assessments indicated that IUC-NN could be used for conservation science and practice.
The major advantages of AAs are that they are orders of magnitude faster than full IUCN RL assessments (Sup-porting Information), objective and reproducible, and based solely on digitally available data. The IUC-NN (as other prediction-based methods) has the added benefit that it integrates a large variety of different data types from different sources (Bland et al. 2015). Furthermore, IUC-NN was less sensitive than index-based methods to limited data and had fewer false positives (Table 1 & Fig. 4) (see also Rivers et al. [2011] and Lughadha et al. [2019]).
The accuracy of IUC-NN was similar to the perfor-mance of prediction-based methods with other taxa (e.g., amphibians [González-del-Pliego et al. 2019],
mam-mals [Bland et al. 2015], nonorchid monocots [Darrah et al. 2017], and land plants [Lughadha et al. 2019]). However, the misclassification rate of approximately 15% is undesirable when making specific conservation de-cisions. A close examination of the species that IUC-NN misclassified most severely (wrong with the binary model and wrong with the maximum number of cate-gories in the detailed model) (n= 11) (Supporting Infor-mation) provides insight into the main causes of misclas-sification. The 4 species for which IUC-NN overestimated extinction risk, Ancistrorhynchus parviflorus, Disperis
elaphoceras, Oligophyton drummondii, and Tridactyle
stevartiana, are all known from only a few locations in protected areas in East Africa and are listed as LC on the IUCN RL based on the assumption that protected areas guarantee effective and long-term protection. For the 7 species for which IUC-NN underestimated the extinction risk (Anguloa cliftonii, Brachionidium pteroglossum,
Bulbophyllum sceliphron, Caladenia hastata,
Paphio-pedilum schoseri, P. supardii, and Vanilla cribbiana), the IUCN RL assessment included information regarding human changes to the local environment, severe collec-tion pressure for the horticultural trade, or observed pop-ulation declines. In particular, the terrestrial orchid C.
hastata is already the focus of recovery efforts (IUCN 2020). B. sceliphron may be more threatened than its current category indicates and is in need of further as-sessment according to the IUCN.
Including data on species trade, land use, or life his-tory, once they are available, may help increase the ac-curacy of IUC-NN and overcome dependency on threat category (Supporting Information). Additionally, combin-ing the binary and detailed model, the results of which were contradictory in some cases (Supporting Informa-tion), may increase the performance of IUC-NN. We sug-gest that labeling species where the binary and detailed model disagree as data deficient might reduce the num-ber of false predictions. Future developments of IUC-NN will quantify the estimation of threat as a continuous pa-rameter to increase the accuracy for intermediate threat levels and will implement Bayesian neural networks to quantify uncertainties in the prediction (Silvestro & An-dermann 2020).
Our results suggest that IUC-NN is robust to geo-graphic errors in the input data and to limited data avail-ability and reduces evaluation bias relative to the IUCN RL (question 3) (Fig. 5). The lower geographic bias of the AAs was expected because of the smaller sample size of the IUCN RL assessments and because IUCN RL assessments are often based on opinions of taxonomic specialists and projects with restricted geographic fo-cus. The data underlying AAs are certainly not free from bias (Meyer et al. 2016; Daru et al. 2018; Zizka et al. 2020a) (Supporting Information), but physical accessi-bility and socioeconomic factors may influence the pro-cess of IUCN RL assessments more strongly than the
collection of occurrence records needed for AAs, exac-erbating bias in IUCN RL.
Cleaning spatial data did surprisingly little to improve the accuracy of AAs (Table 1), which is in agreement with recent results with other taxonomic groups (Zizka et al. 2020c).This may be due to the overall low number of records available for many orchid species. If the number of records is low, they likely only represent a fraction of a species’ ranges and therefore AAs will underestimate the EOO. Because the EOO is purely a measure of range size, the removal of records by spatial cleaning may not affect assessment results (because the estimated EOO was low already) or even lead to incorrect classifications (if the cleaning decreased the EOO to below the threshold for the next RL category). However, the exact reasons for the low impact of spatial cleaning may differ on a case-by-case basis.
The advantages of IUC-NN come at the price of ap-plying complex statistical machinery and moving beyond strict adherence of IUCN criteria, which warrants some caution (Walker et al. 2020). Our results showed that AAs need improvement for them to be able to estimate threat categories reliably, but that they identify possibly threatened species reasonably well in a short time. We see the major application of IUC-NN is in integrating di-verse data into preliminary conservation assessments to rapidly identify species in need of a full IUCN RL assess-ment, or, until such full assessments are available, acting as data-driven baseline to identify species or areas in need of conservation (Fig. 1). This approach is particularly valuable for the species-rich, but poorly studied, tropical regions (Mounce et al. 2018), where even preliminary assessments will be useful for informing conservation. A particular strength of IUC-NN is that it can be trained for other taxonomic groups or regions, which will speed the conservation assessment of all species.
Acknowledgments
We thank WCSP for provision of the species list and information on life form and geographic distribution and all data contributors and publishers contributing to GBIF’s efforts to collect, digitize, store, and pub-lish orchid records. We thank A. T. Clark for discus-sion and help on the permutation test and 3 anonymous reviewers for helpful comments on previous versions of the manuscript. The scientific results were in part computed at the High-Performance Computing (HPC) Cluster EVE, a joint effort of both the Helmholtz Cen-tre for Environmental Research – UFZ (http://www.ufz. de/) and the German Centre for Integrative Biodiver-sity Research (iDiv) Halle-Jena-Leipzig (http://www.idiv-biodiversity.de/). A.Z. and P.V. acknowledge funding by sDiv, the Synthesis Center for Biodiversity Sciences – a unit of the German Centre for Integrative Biodiversity
Re-search (iDiv) Halle-Jena-Leipzig – funded by the German Research Foundation (FZT 118). T.M.K. acknowledges funding from the Alexander von Humboldt Foundation in the framework of the Alexander von Humboldt Profes-sorship. D.S. received funding from the Swiss National Science Foundation (PCEFP3_187012; FN-1749) and the Swedish Research Council (VR: 2019–04739).
Open access funding enabled and organized by Projekt DEAL.
Supporting Information
Supplementary methods related to the sensitivity analy-ses (Appendix S1), information on geographic cleaning, detailed IUCN category predictions, computation time and occurrence sampling (Appendix S2), conservation assessments for 13,910 orchid species translation of the article (Appendix S3), results on the impact of feature choice on IUC-NN performance (Appendix S4), and per species comparison of IUC-NN and IUCN RL (Appendix S5) are available online. Data and analysis scripts are available from zenodo (10.5281/zenodo.3862199). The authors are solely responsible for the content and func-tionality of these materials. Queries (other than absence of the material) should be directed to the corresponding author.
Literature Cited
Bachman SP, Moat J, Hill A, Torre J de la, Scott B. 2011. Supporting Red List threat assessments with GeoCAT: geospatial conservation assessment tool. ZooKeys150:117–126.
BGCI. 2018. ThreatSearch online database. Botanic Gardens Conserva-tion InternaConserva-tional, Richmond, United Kingdom.
Bland LM, Collen B, Orme CDL, Bielby J. 2015. Predicting the conserva-tion status of data-deficient species. Conservaconserva-tion Biology29:250–
259.
Cardoso P. 2017. red - an R package to facilitate species red list as-sessments according to the IUCN criteria. Biodiversity Data Journal
5:e20530.
Collen B, et al. 2016. Clarifying misconceptions of extinction risk as-sessment with the IUCN Red List. Biology Letters12:20150843.
Cosiaux A, Gardiner LM, Stauffer FW, Bachman SP, Sonké B, Baker WJ, Couvreur TLP. 2018. Low extinction risk for an important plant resource: conservation assessments of continental African palms (Arecaceae/Palmae). Biological Conservation221:323–333.
Cribb P, Kell S, Dixon K, Barrett R. 2003. Orchid conservation: a global perspective. Pages 1–24 in Cribb P, Kell S, Dixon K, Barrett R, edi-tors. Orchid conservation. Natural History Publications, Kota Kina-balu, Sabah.
Darrah SE, Bland LM, Bachman SP, Clubbe CP, Trias-Blasi A. 2017. Using coarse-scale species distribution data to predict extinction risk in plants. Diversity and Distributions23:435–447.
Daru BH, et al. 2018. Widespread sampling biases in herbaria revealed from large-scale digitization. New Phytologist217:939–955.
Dauby G, et al. 2017. ConR: an R package to assist large-scale mul-tispecies preliminary conservation assessments using distribution data. Ecology and Evolution7:11292–11303.
Di Marco M, Santini L. 2015. Human pressures predict species’ geo-graphic range size better than biological traits. Global Change Biol-ogy21:2169–2178.
Dixon KW. 2003. Orchid conservation. Natural History Publications, Borneo.
Fay MF. 2018. Orchid conservation: how can we meet the challenges in the twenty-first century? Botanical Studies59:1–16.
Gaskett AC, Gallagher RV. 2018. Orchid diversity: spatial and climatic patterns from herbarium records. Ecology and Evolution8:11235–
11245.
Givnish TJ, et al. 2016. Orchid historical biogeography, diversification, Antarctica and the paradox of orchid dispersal. Journal of Biogeog-raphy43:1905–1916.
Global Biodiveristy Information Facility (www.gbif.org). 2019. GBIF occurrence download. Available from https://doi.org/10.15468/dl. 4bijtu. (accessed August 2019).
González-del-Pliego P, Freckleton RP, Edwards DP, Koo MS, Scheffers BR, Pyron RA, Jetz W. 2019. Phylogenetic and trait-based prediction of extinction risk for data-deficient amphibians. Current Biology
29:1557–1563.
Goodfellow I, Bengio Y, Courville A. 2016. Deep learning. MIT Press, Cambridge, Massachusetts.
Hinsley A, et al. 2018. A review of the trade in orchids and its impli-cations for conservation. Botanical Journal of the Linnean Society
186:435–455.
Hinsley A, Nuno A, Ridout M, John FAVS, Roberts DL. 2017. Estimat-ing the extent of CITES noncompliance among traders and end-consumers; lessons from the global orchid trade. Conservation Let-ters10:602–609.
Hinsley A, Roberts DL. 2018. The wild origin dilemma. Biological Con-servation217:203–206.
IUCN (International Union for Conservation of Nature). 2019. The IUCN Red List of threatened species, Orchidaceae. Available from https://www.iucnredlist.org/ (accessed August 2019).
IUCN (International Union for Conservation of Nature). 2020. Website. Available from https://www.iucnredlist.org/ (accessed June 2020). IUCN (International Union for Conservation of Nature) Standards and
Petitions Subcommittee. 2017. Guidelines for using the IUCN Red List — categories and criteria. Version 13. IUCN, Gland, Switzer-land.
Karger DN, Conrad O, Böhner J, Kawohl T, Kreft H, Soria-Auza RW, Zimmermann NE, Linder HP, Kessler M. 2017. Climatologies at high resolution for the earth’s land surface areas. Scientific Data4:
1–20.
Kier G, Kreft H, Lee TM, Jetz W, Ibisch PL, Nowicki C, Mutke J, Barthlott W. 2009. A global assessment of endemism and species richness across island and mainland regions. Proceedings of the National Academy of Sciences of the United States of America
106:9322–9327.
Liu H, Liu Z, Jin X, Gao J, Chen Y, Liu Q, Zhang D-Y. 2020. Assessing conservation efforts against threats to wild orchids in China. Biolog-ical Conservation243:108484.
Lughadha EN, et al. 2019. The use and misuse of herbarium specimens in evaluating plant extinction risks. Philosophical Transactions of the Royal Society B: Biological Sciences374:20170402.
McCormick MK, Jacquemyn H. 2014. What constrains the distribution of orchid populations? New Phytologist202:392–400.
Meyer C, Weigelt P, Kreft H. 2016. Multidimensional biases, gaps and uncertainties in global plant occurrence information. Ecology Let-ters19:992–1006.
Moat J. 2017. rCAT: conservation assessment tools. R package version 0.1.5.
Mounce R, Rivers MC, Sharrock S, Smith P, Brockington S. 2018. Com-paring and contrasting threat assessments of plant species at the global and sub-global level. Biodiversity and Conservation27:907–
930.
Olson DM, et al. 2001. Terrestrial ecoregions of the world: a new map of life on Earth. Bioscience51:933–938.
Pelletier TA, Carstens BC, Tank DC, Sullivan J, Espíndola A. 2018. Pre-dicting plant conservation priorities on a global scale. Proceedings of the National Academy of Sciences of the United States of America
115:13027–13032.
Pfab MF, Victor JE, Armstrong AJ. 2011. Application of the IUCN Red Listing system to setting species targets for conservation planning purposes. Biodiversity and Conservation20:1001–1012.
R Core Team. 2019. R: a language and environment for statisti-cal computing. R Foundation for Statististatisti-cal Computing, Vienna, Austria.
Rivers MC, Taylor L, Brummitt NA, Meagher TR, Roberts DL, Lughadha EN. 2011. How many herbarium specimens are needed to detect threatened species? Biological Conservation144:2541–2547.
Roberts DL, Taylor L, Joppa LN. 2016. Threatened or data deficient: as-sessing the conservation status of poorly known species. Diversity and Distributions22:558–565.
Rodrigues ASL, Pilgrim JD, Lamoreux JF, Hoffmann M, Brooks TM. 2006. The value of the IUCN Red List for conservation. Trends in Ecology & Evolution21:71–76.
Royal Botanic Gardens Kew. 2010. Plants under pressure—a global as-sessment: the first report of the IUCN sampled red list index for plants. Royal Botanic Gardens, Kew,Richmond, United Kingdom. Schmidt M, et al. 2017. Diversity, distribution and preliminary
conser-vation status of the flora of Burkina Faso. Phytotaxa Monographs
304:1–215.
Silvestro D, Andermann T. 2020. Prior choice affects ability of Bayesian neural networks to identify unknowns. arXiv, https://doi.org/arXiv:2005.04987.
Subedi A, Kunwar B, Choi Y, Dai Y, van Andel T, Chaudhary RP, de Boer HJ, Gravendeel B. 2013. Collection and trade of wild-harvested orchids in Nepal. Journal of Ethnobiology and Ethnomedicine9:64.
Swarts ND, Dixon KW. 2009. Perspectives on orchid conservation in botanic gardens. Trends in Plant Science14:590–598.
Swarts N, Dixon K. 2017. Conservation methods for terrestrial orchids. J. Ross Publishing, Fort Lauderdale, Florida.
Töpel M, Zizka A, Calió MFMF, Scharn R, Silvestro D, Antonelli A. 2017. SpeciesGeoCoder: fast categorization of species occurrences for analyses of biodiversity, biogeography, ecology, and evolution. Systematic Biology66:145–151.
Walker BE, Leão TCC, Bachman SP, Bolam FC, Nic Lughadha E. 2020. Caution needed when predicting species threat status for conser-vation prioritization on a global scale. Frontiers in Plant Science
11:1–4.
WCSP. 2019. World checklist of selected plant families. Facilitated by the Royal Botanic Gardens, Kew. Available from http://wcsp. science.kew.org/ (accessed September 2018).
Wildlife Conservation Society - WCS, International Earth Science Infor-mation Network - CIESIN - Columbia University. 2005. Last of the wild project: global human footprint dataset (Geographic). NASA (SEDAC), Palisades, New York.
Wraith J, Pickering C. 2018. Quantifying anthropogenic threats to or-chids using the IUCN Red List. Ambio47:307–317.
Zizka A, et al. 2019. Coordinatecleaner: standardized cleaning of oc-currence records from biological collection databases. Methods in Ecology and Evolution10:744–751.
Zizka A, Antonelli A, Silvestro D. 2020a. Sampbias, a method for quanti-fying geographic sampling biases in species distribution data. Ecog-raphy43:1–7.
Zizka A, Azevedo J, Leme E, Neves B, Ferreira A, Caceres D, Zizka G. 2020b. Biogeography and conservation status of the pineap-ple family (Bromeliaceae). Diveristy and Distributions 26:183–
195.
Zizka A, et al. 2020c. No one-size-fits-all solution to clean GBIF. https://doi.org/10.1101/2020.03.12.974543.