HAL Id: hal-00301414
https://hal.archives-ouvertes.fr/hal-00301414
Submitted on 8 Sep 2004HAL is a multi-disciplinary open access
archive for the deposit and dissemination of sci-entific research documents, whether they are pub-lished or not. The documents may come from teaching and research institutions in France or abroad, or from public or private research centers.
L’archive ouverte pluridisciplinaire HAL, est destinée au dépôt et à la diffusion de documents scientifiques de niveau recherche, publiés ou non, émanant des établissements d’enseignement et de recherche français ou étrangers, des laboratoires publics ou privés.
A transboundary transport episode of nitrogen dioxide
as observed from GOME and its impact in the Alpine
region
D. Schaub, A. K. Weiss, J. W. Kaiser, A. Petritoli, A. Richter, B. Buchmann,
J. P. Burrows
To cite this version:
D. Schaub, A. K. Weiss, J. W. Kaiser, A. Petritoli, A. Richter, et al.. A transboundary transport episode of nitrogen dioxide as observed from GOME and its impact in the Alpine region. Atmospheric Chemistry and Physics Discussions, European Geosciences Union, 2004, 4 (5), pp.5103-5134. �hal-00301414�
ACPD
4, 5103–5134, 2004 A transboundary transport episode of NO2observed from GOME D. Schaub et al. Title Page Abstract Introduction Conclusions References Tables Figures J I J I Back Close Full Screen / EscPrint Version Interactive Discussion
© EGU 2004 Atmos. Chem. Phys. Discuss., 4, 5103–5134, 2004
www.atmos-chem-phys.org/acpd/4/5103/ SRef-ID: 1680-7375/acpd/2004-4-5103 © European Geosciences Union 2004
Atmospheric Chemistry and Physics Discussions
A transboundary transport episode of
nitrogen dioxide as observed from GOME
and its impact in the Alpine region
D. Schaub1, A. K. Weiss1, J. W. Kaiser2, A. Petritoli3, A. Richter4, B. Buchmann1, and J. P. Burrows4
1
Swiss Federal Laboratories for Materials Testing and Research (EMPA), Ueberlandstrasse 129, CH-8600 Duebendorf, Switzerland
2
Remote Sensing Laboratories, University of Zurich, Winterthurerstrasse 190, CH-8057 Zurich, Switzerland
3
Institute of Atmospheric Science and Climate (ISAC-CNR), Via Gobetti 101, I-40129 Bologna, Italy
4
Institute of Environmental Physics, University of Bremen, P.O. Box 33 04 40, 28334 Bremen, Germany
Received: 21 June 2004 – Accepted: 16 August 2004 – Published: 8 September 2004 Correspondence to: D. Schaub ([email protected])
ACPD
4, 5103–5134, 2004 A transboundary transport episode of NO2observed from GOME D. Schaub et al. Title Page Abstract Introduction Conclusions References Tables Figures J I J I Back Close Full Screen / EscPrint Version Interactive Discussion
© EGU 2004 Abstract
High tropospheric NO2 amounts are occasionally detected by satellite-borne spec-trometers even though clouds shield the highly polluted boundary layer. We present a method to investigate such events and apply the model to the high NO2 vertical tropospheric column densities (VTCs) over middle Europe observed from the Global
5
Ozone Monitoring Experiment (GOME) instrument on 17 February 2001. Our case study shows that pollution originally residing near the ground has been advected to higher tropospheric levels by a passing weather front. With backward trajectories, the NO2source region is located in central Germany, the Ruhr area and adjacent parts of the Netherlands and Belgium. The highly polluted air masses are traced by forward
tra-10
jectories starting from the GOME columns to move further to the Alpine region. Their impact on the air quality there is modeled by combining the NO2 VTCs observed by GOME with the trajectory calculations and a given NO2lifetime. Considering ground-based in-situ measurements in the Alpine region we conclude that for this episode, 50% to 90% of the NO2concentration recorded at the sites can be attributed to
trans-15
boundary transport during the frontal passage.
1. Introduction
Nitrogen dioxide (NO2) plays a key role in photochemical air pollution. Its amount and distribution is of significance directly for air quality and human health and indirectly as an ozone precursor (e.g. Seinfeld and Pandis, 1998). NO2 is formed according to the
20
photochemical equilibrium on a time scale of minutes from the primarily emitted nitro-gen oxide (NO), the bulk of which is of anthroponitro-genic origin (Brasseur et al., 2003). The NO2 concentration at any time and place is determined by the emission of NOx (≡NO+NO2), its production and loss reactions as well as meteorological transport and dilution. NO2 is removed from the troposphere by the reaction with the OH radical to
25
sur-ACPD
4, 5103–5134, 2004 A transboundary transport episode of NO2observed from GOME D. Schaub et al. Title Page Abstract Introduction Conclusions References Tables Figures J I J I Back Close Full Screen / EscPrint Version Interactive Discussion
© EGU 2004 faces and aerosol (Dentener and Crutzen, 1993). Overall, NOx and thus NO2 exhibit
a relatively short but highly variable and condition dependent lifetime in the planetary boundary layer (PBL). Leue et al. (2001) used vertical tropospheric NO2column densi-ties observed from GOME over the eastern coast of North America to estimate an NO2 lifetime of 27 h in the PBL. Following the plume leaving the coast of India,
Kunhikrish-5
nan et al. (2004) estimated a lifetime of 18 h. However, NO2has a longer lifetime in the middle and upper troposphere, being of the order of several days to a week (Jaegl ´e et al., 1998; Seinfeld and Pandis, 1998). Thus, NO2 may be transported over larger distances once it is lifted to higher tropospheric levels, for example by frontal systems. Numerical model results have shown synoptic-scale vertical advection to be a
signif-10
icant transport mechanism for nitrogen oxides (Hov and Flatoy, 1997). In agreement with this, more than 50% of a passive tracer released in the boundary layer was found to be transported to the free troposphere within 24 h during a frontal passage (Donnell et al., 2001). Aircraft campaigns have verified that significant quantities of trace gases are lifted up from the PBL into the free troposphere by a warm conveyor belt
associ-15
ated with the frontal system (Bethan et al., 1998). The importance of synoptic uplift and subsequent long-range transport of trace gases for air pollution monitoring was shown by Stohl et al. (2002). These results illustrated transport phenomena at the time scale of hours to days (the synoptic scale) being relevant for the observed NO2distribution and for air quality policy, where accurate source attribution and impact assessment is
20
required.
The retrieval of the tropospheric NO2column from space-borne instrumentation has become available since the launch of the GOME instrument (Burrows et al., 1999) aboard the European Space Agency (ESA) satellite ERS-2 (Earth Remote Sensing Satellite). During the ESA-DUP project POLPO (Pollution Hot Spot Monitoring from
25
GOME Applied to the Po-basin), high values of tropospheric NO2 columns detected from space were found to comprise a mixture of local emissions and advected NO2 (Weiss et al., 2002). Furthermore, GOME measurements were successfully used to observe intercontinental transport events of nitrogen dioxide (Spichtinger et al., 2001;
ACPD
4, 5103–5134, 2004 A transboundary transport episode of NO2observed from GOME D. Schaub et al. Title Page Abstract Introduction Conclusions References Tables Figures J I J I Back Close Full Screen / EscPrint Version Interactive Discussion
© EGU 2004 Wenig et al., 2003; Stohl et al., 2003). Therefore, combining satellite and ground-based
data with transport models is useful to observe transport phenomena influencing the NO2distribution.
In the present case study, an episode of “intracontinental” transport of nitrogen diox-ide is investigated. The tropospheric NO2retrieved from GOME (Richter and Burrows,
5
2002) is combined with ground-based in-situ measurements and numerical weather model data. In this manner, the frontal transport of NO2within Europe and the result-ing impact in the Alpine region is identified. In addition, the relative amounts of local and advected NO2are estimated by employing a simple transport model based on tra-jectories, the GOME NO2 vertical tropospheric columns (VTCs) and an assumed NO2
10
lifetime. The intention is to use the NO2information available from GOME and remain independent of emission inventories. Thus, the NO2emissions are assumed to be pro-portional to the population density. The latter is added up along backward trajectories and serves as a proxy for the NO2 emissions. A method is developed to convert the proxies into NO2concentration by employing the GOME NO2VTCs.
15
2. Measurement data
2.1. GOME measurements
The GOME instrument aboard ESA’s ERS-2 satellite measures upwelling radiance from the atmosphere and extraterrestrial solar irradiance. The amount and distribution of a variety of significant atmospheric trace constituents may be retrieved from these
20
observations (Burrows et al., 1999). It was designed and optimized primarily to mea-sure the global ozone distribution, but also the amounts of the trace gases BrO, OCIO, H2O, HCHO and NO2can be obtained.
The GOME instrument comprises a nadir-viewing spectrometer which observes si-multaneously the entire spectral range between 240 and 793 nm at channel dependent
25
ACPD
4, 5103–5134, 2004 A transboundary transport episode of NO2observed from GOME D. Schaub et al. Title Page Abstract Introduction Conclusions References Tables Figures J I J I Back Close Full Screen / EscPrint Version Interactive Discussion
© EGU 2004 gases, their vertical columns are retrieved (e.g. Richter and Burrows, 2002). Because
of its sun-synchronous polar orbit, GOME measurements in middle latitudes are always taken in the late morning local time. With its swath width of 960 km (single ground pixel size is 320 km across track and 40 km along track) GOME reaches full coverage at the mid-latitudes within 2–3 days.
5
The NO2 vertical tropospheric column density (VTC) data used in this study were provided by the University of Bremen (see Richter and Burrows, 2002, for full descrip-tion). Uncertainties in the VTCs are due to the NO2fitting algorithm, instrument char-acteristics, the method of the stratosphere-troposphere separation and atmospheric parameters such as the NO2profile, the surface spectral reflectance, the aerosol
load-10
ing and the clouds. These atmospheric parameters account for the largest part of the uncertainties. Richter and Burrows (2002) carried out a detailed error analysis for the NO2VTCs and found a total uncertainty of up to a factor of 2. In order to reduce the un-certainty, the GOME data used in the present study were reprocessed with an adapted cloud top height (CTH) and an assumed location of the NO2layer. Furthermore, di
ffer-15
ent scenarios for the structure of the cloud cover (closed cloud cover and partly cloudy taking into account cloud mask data) are used.
2.2. Ground-based in-situ measurements
The Swiss National Air Pollution Monitoring Network (NABEL) provides long-term am-bient air measurements (EMPA, 2002; BUWAL, 2002). To investigate the impact of
20
the mesoscale transport process, rural and remote sites located in the Swiss Plateau or elevated and north-exposed stations are suitable as the air mass inflow during this episode is from northern to north-eastern direction.
Data from the following sites (Fig. 1) are used in this study:
1. Rigi (47◦040N, 8◦280E, 1030 m a.s.l.): A rural site that is well suited for detection
25
of events advected from northern direction, because it is situated on a north-exposed mountain slope. In winter, local influences arising from thermal transport
ACPD
4, 5103–5134, 2004 A transboundary transport episode of NO2observed from GOME D. Schaub et al. Title Page Abstract Introduction Conclusions References Tables Figures J I J I Back Close Full Screen / EscPrint Version Interactive Discussion
© EGU 2004 are rare.
2. Chaumont (47◦030N, 6◦590E, 1140 m a.s.l.): This site is also situated at an ele-vated location at some distance from cities and is surrounded by meadows and grassland. The nearest industrial enterprises are situated 5 to 10 km away. 3. Taenikon (47◦280N, 8◦540E, 540 m a.s.l.): A site that samples air from the Swiss
5
Plateau. The surroundings are dominated by agriculture and forests, the highway A1 lies in north-eastern direction at a distance of 4 km.
4. Zugspitze (47◦250N, 10◦590E, 2963 m a.s.l.): This site is located at the northern rim of the Alps and, therefore, suitable for the detection air masses advected from the North (Umweltbundesamt, 2002). It is used because no measurements from
10
the high-alpine site Jungfraujoch are available during the time of the case study. At these sites, nitrogen oxides are measured with the chemiluminescence detec-tors Monitor Labs (ML) 8841 (Rigi), ML 9841 A (Chaumont), ECO Physics CLD 700 (Taenikon) and TE 42 Thermo Environmental Systems/TECAN (Zugspitze). All mea-surement devices are equipped with a molybdenum converter. It should be noted that
15
these catalytic surface converters may reduce not only NO2, but other nitrogen species such as PAN, HNO2and HNO3to NO. Generally, the PAN mixing ratio can be expected to be small during winter conditions. Wunderli and Gehrig (1991) found a mean Febru-ary PAN mixing ratio at Davos (Switzerland, 1640 m a.s.l.) of 0.1 ppb. Under cold and clear weather conditions, however, elevated PAN mixing ratios were measured in
win-20
ter with an evening maximum at Davos of 0.6 ppb. HNO2is rapidly transformed to OH and NO by photolysis and mixing ratios are normally below the detection limit during the day (Winer and Biermann, 1994). Maximum February/March HNO3concentrations were found to be in the order of 0.3 ppb at Jungfraujoch (Zellweger et al., 2003) and 0.8 ppb in Duebendorf (Zellweger et al., 1999) at 3580 m a.s.l. and 430 m a.s.l.,
re-25
spectively. As the NO2 mixing ratios are between 5 and 30 ppb in this case study, we consider the interference of the above discussed nitrogen species to be negligible.
ACPD
4, 5103–5134, 2004 A transboundary transport episode of NO2observed from GOME D. Schaub et al. Title Page Abstract Introduction Conclusions References Tables Figures J I J I Back Close Full Screen / EscPrint Version Interactive Discussion
© EGU 2004
3. Methods
3.1. Trajectory calculations
Backward and forward trajectories are used to investigate the origin of the detected air masses in the studied GOME columns, their further movement to the Alpine re-gion, and their impact there. The trajectories are based on analyzed wind fields with
5
a six hour temporal and 1◦×1◦ geographical resolution provided by the model of the European Centre for Medium-Range Weather Forecast (ECMWF). Three dimensional kinematic backward and forward trajectories are calculated with the software package “Lagranto” (Wernli and Davies, 1997). Their length is chosen to be long enough for source and impact analysis (several days). The NO2 distribution within the GOME
10
columns is unknown. Therefore, the backward/forward trajectory arrival/starting points cover the GOME columns both horizontally and vertically in order to account for its whole tropospheric volume (320 km×40 km× tropopause height). The arrival/starting time point for this episode is chosen to be on 17 February 2001, 09:00 UTC.
For a first assessment of the source regions and the further air mass movement
15
(Sects. 4.3 and 4.4), each column is covered with 70 arrival/starting points; 10 levels from 900 hPa up to 400 hPa in 50 hPa steps, each level containing 7 points. For a more detailed transport assessment (Sect. 3.2 and 4.6), a much higher density of backward and forward trajectories is calculated for each GOME column with 128 (4 along track ×32 across track) arrival/starting points in the horizontal for 23 height levels between
20
950 hPa and 400 hPa in 25 hPa steps (resulting in a total of 2944 trajectories per col-umn).
3.2. Transport model based on trajectories and GOME observations
A simple transport model based on backward and forward trajectories, the GOME NO2 VTCs, population distribution data, and an assumed NO2 lifetime is employed to
esti-25
re-ACPD
4, 5103–5134, 2004 A transboundary transport episode of NO2observed from GOME D. Schaub et al. Title Page Abstract Introduction Conclusions References Tables Figures J I J I Back Close Full Screen / EscPrint Version Interactive Discussion
© EGU 2004 gion. The method comprising three steps is discussed in detail in the following sections
and is illustrated in Fig. 2. Firstly, the population number is added up and transported along the backward trajectories (as a proxy for NO2 emissions) and is corrected for the NO2lifetime (Sect. 3.2.1). Secondly, above an effective cloud top height, the NO2 proxies (population number) are summed vertically and converted to number of NO2
5
molecules employing the GOME NO2 VTCs (Sect. 3.2.2). Thirdly, the further move-ment of the NO2 polluted air masses is traced with forward trajectories, corrected for NO2lifetime and converted into NO2mixing ratio when trajectories reach ground near levels (Sect. 3.2.3).
3.2.1. Pollution uptake and NO2lifetime correction
10
The NO2uptake along the backward trajectories is simulated by passing the trajecto-ries over a 1◦×1◦ resolved population grid (UNEP, 1997) assuming the NO2 emission to be proportional to the population in the respective grid cell. Following the trajectory forward in time, pollution is taken up when the trajectory reaches a ground near level (50 hPa above model ground). In this case, the number of the population in the
respec-15
tive grid cell is added to the trajectory as a proxy for NO2emissions. Further, the NO2 proxy transported along the trajectory is decreasing every time step according to an assumed NO2lifetime of 24 h.
3.2.2. Conversion of NO2proxies to number of NO2molecules
Each backward trajectory arrives in the appropriate GOME column containing a
pop-20
ulation number as a proxy for NO2. This quantity is converted to a number of NO2 molecules by applying a conversion factor deduced from relating the GOME measure-ment with the appropriate proxy values. However, two main issues complicate this approach:
1. The sensitivity of the GOME instrument for NO2within the column is not constant.
25
ACPD
4, 5103–5134, 2004 A transboundary transport episode of NO2observed from GOME D. Schaub et al. Title Page Abstract Introduction Conclusions References Tables Figures J I J I Back Close Full Screen / EscPrint Version Interactive Discussion
© EGU 2004 decreases for NO2situated above or within the cloud (Hild et al., 2002).
2. Ground near air mass trajectories based on a 1◦×1◦ resolved wind field might not properly reproduce the frontal movement.
To account for both, we define an effective cloud top height (CTHef f) to be the lowest height in the troposphere above which the NO2 contributes significantly to the GOME
5
signal. Because GOME sees to some extent into the clouds, the CTHef f is lower than the real CTH. The CTHef f is assumed to be constant across the considered GOME pixels (Fig. 3a) and the population numbers above it are added up to column values per GOME pixel. Linearly fitting the proxy VTCs with the GOME NO2 VTCs yields the adequate CTHef f where the explained variance (R2) maximizes. The population
10
numbers of each trajectory are subsequently converted to number of NO2 molecules with the conversion factor. The latter corresponds to the ratio between the the sum of the considered proxy VTCs and the sum of the appropriate GOME NO2VTCs.
3.2.3. Pollution propagation, NO2 lifetime and conversion to NO2 mixing ratios at ground stations
15
The NO2molecules are propagating along the forward trajectories to the Alpine region. Again, the NO2 loading is decreasing every time step according to an assumed NO2 lifetime of 24 h. When a trajectory reaches near ground levels over a 0.5◦×0.5◦ grid superimposed over the Alpine region, the value is assigned to this grid cell. For the measurement sites in Taenikon and at Rigi and Chaumont, the near ground level is
20
defined to be 50 hPa deep. For the more elevated Zugspitze station, a layer from 50 to 100 hPa from model ground is used. In a last step, the hourly resolved numbers of molecules in the grid cells corresponding to the measurement sites are recalculated to mixing ratios using temperature and pressure data and the vertical box extension of 50 hPa.
ACPD
4, 5103–5134, 2004 A transboundary transport episode of NO2observed from GOME D. Schaub et al. Title Page Abstract Introduction Conclusions References Tables Figures J I J I Back Close Full Screen / EscPrint Version Interactive Discussion
© EGU 2004 3.2.4. Errors of the method
Main error sources of the described approach are (i) the assumption of a constant chemical lifetime of NO2 of 24 h, (ii) the fact that a single air mass trajectory does not implicitly account for dilution, (iii) the uncertainties in the GOME NO2 VTCs, and (iv) the error associated with the assumption of the population distribution being a
5
representative proxy for NOxemissions.
(i) Assuming a constant lifetime for NO2 is a strong simplification given its complex atmospheric chemistry. However, a relatively long lifetime of 24 h is chosen because the photolysis is relatively weak in winter due to the increased solar zenith angle (Dick-erson et al., 1982; Parrish et al., 1983; Wiegand and Bofinger, 2000), and the NOx
10
equilibrium is heavily biased towards NO2. Furthermore, the loss of NOx by reaction with OH is slow because the amount of OH is low in winter (Seinfeld and Pandis, 1998). (ii) The dilution is to some extent taken into account by the large number of trajec-tories and their divergence. Furthermore, the effect of dilution can be expected to be rather weak for the studied episode, because the frontal transport lifts up an extended
15
air mass having enhanced NO2concentrations and, thus, relatively small concentration gradients.
(iii) For the present study the GOME error is reduced compared to the standard processing by reprocessing the data (Sect. 4.1).
(iv) A basic assumption is that the population distribution constitutes a proxy for NOx
20
emissions. This seems plausible taking into account the fact that NOx is mainly of anthropogenic origin (Brasseur et al., 2003).
ACPD
4, 5103–5134, 2004 A transboundary transport episode of NO2observed from GOME D. Schaub et al. Title Page Abstract Introduction Conclusions References Tables Figures J I J I Back Close Full Screen / EscPrint Version Interactive Discussion
© EGU 2004 4. Case study – results and discussion
4.1. GOME observation on 17 February 2001
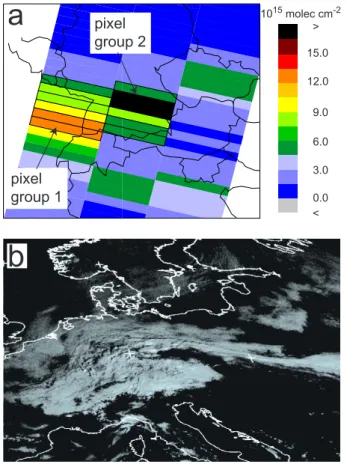
GOME recorded high NO2 VTC values over central Europe on 17 February 2001 (Fig. 3a). As can be seen in the Meteosat image (Fig. 3b), clouds shielded the ground. Therefore, a significant amount of nitrogen dioxide has to be located within and/or
5
above the cloud cover. However, as pointed out by Richter and Burrows (2002), Leue et al. (2001) and Hild et al. (2002), the albedo effect of underlying clouds can increase the NO2signal. Therefore, a reprocessing of the GOME NO2VTCs is carried out using an assumed NO2 layer, the CTH, and the structure of the cloud cover. A closed cloud cover is assumed in the reprocessing version A. In version B, cloud mask information
10
is used and the total tropospheric column (where cloud free) and above cloud columns are combined. The CTH is estimated from live cams in the Alps to be located at an altitude of 3000 m a.s.l. The NO2 is assumed to occur in a layer between 4000 and 6000 m a.s.l., whereas for standard processing an a priori NO2profile with a constant mixing ratio in the lowermost 1.5 km of the troposphere is used (Richter and Burrows,
15
2002). In fact, the real vertical NO2 distribution is not known, but an inaccurate esti-mation of this layer turned out to be not very critical. The two reprocessing scenarios A and B yielded quite similar column values as shown in Table 1. Furthermore, the reprocessing results in distinctly lower values than the standard processing, which is due to the above mentioned albedo effect of the clouds (Richter and Burrows, 2002;
20
Leue et al., 2001; Hild et al., 2002). For the further analysis, the overall cloudy case is used.
4.2. Meteorological situation
After a frontal passage on 13 February, a high pressure system installed over southern England and moved slowly to the east, causing the inflow of dry continental polar air
25
ACPD
4, 5103–5134, 2004 A transboundary transport episode of NO2observed from GOME D. Schaub et al. Title Page Abstract Introduction Conclusions References Tables Figures J I J I Back Close Full Screen / EscPrint Version Interactive Discussion
© EGU 2004 1985). The flat pressure distribution associated with the high pressure system led to
stagnating air over middle Europe. On the 16th, a cold-front formed over north-eastern Europe and moved southward, developing to an occlusion during 17 February (Fig. 4). Cold-fronts are often associated with lightning activity, the latter being known to be an in-situ source of NOx in the free troposphere (e.g. Huntrieser et al., 2002). During
5
the time of our case study, however, no lightning activity was recorded (Wetterzentrale Karlsruhe), and NO2production by lightning can, therefore, be excluded.
4.3. Backward trajectories – NO2source
The source region of the air pollution detected by the GOME instrument is analyzed with backward trajectories (Fig. 5), focusing on the two NO2 pixel groups (each
com-10
posed of two GOME pixels as defined in Fig. 3a) over the border triangle of France, Germany and Switzerland (pixel group 1) and over south-eastern Germany (pixel group 2).
The trajectories indicate that the air masses arriving in the GOME columns are ad-vected from western directions above the Northern Atlantic. They descend over
South-15
ern Scandinavia and the North Sea and subsequently turn clockwise over the region of the Netherlands, Belgium and Germany. This is a result of the presence of the high pressure system which installed over Europe before the frontal passage (Fig. 4). Near the ground, the vertical distribution of the trajectories is investigated in detail, because the residence time of an air parcel within the PBL potentiates the uptake of
20
anthropogenic NO2. To find the potential source regions, only trajectories residing at a ground distance of less than 100 hPa for at least one (hourly) time step are consid-ered (Fig. 5). Further, in the horizontal projections, time steps along these trajectories are omitted when their distance from ground exceeds 150 hPa. The narrow spatial dis-tances of the hourly time steps (red dots in Fig. 5) show that the air was rather stagnant
25
during 15 and 16 February. As a result, the air parcels were exposed to NOxemissions for several hours in the highly populated region of the Netherlands, Belgium, Central Germany and the Ruhr area, the latter known to be one of the European hot spot
re-ACPD
4, 5103–5134, 2004 A transboundary transport episode of NO2observed from GOME D. Schaub et al. Title Page Abstract Introduction Conclusions References Tables Figures J I J I Back Close Full Screen / EscPrint Version Interactive Discussion
© EGU 2004 gions concerning NO2 pollution (e.g. Weiss et al., 2002). The air mass trajectories
then exhibit a sudden movement to southern direction associated with frontal uplifting (Fig. 5). These air masses are highly likely to be responsible for the enhanced NO2 in the pixel groups 1 and 2. The ground near pollution reaches heights of up to 500 hPa above surface pressure (Fig. 5). This corresponds to lifting up to up to 5000 m above
5
model ground. Even higher levels were reached by air formerly traveling at a ground distance of more than 100 hPa.
Comparing the backward calculations for GOME pixel groups 1 and 2 indicates that the air from pixel group 2 over south-eastern Germany is more affected by polluted PBL air, because the density of the trajectories at less than 50 hPa is higher, and their
10
uplifting takes place later. This explains the higher NO2VTCs in these GOME columns. 4.4. Forward trajectories – impact in the Alpine region
The forward trajectories show that the polluted air masses detected by GOME move to the Alpine region including Switzerland (Fig. 6). For both GOME pixel groups, the forward trajectories’ distance to the ground decreases again. This is explained by both
15
an effective subsidence and the increasing altitude of the ground in southern direction. The air masses reach heights below 100 hPa over the Alpine region (Fig. 6). The for-ward trajectories from GOME pixel group 1 stay relatively bundled and reach Switzer-land in its north-western part. The trajectories from GOME pixel group 2, however, show a much larger spread and the polluted air reaching Switzerland can therefore be
20
expected to be more diluted.
4.5. In-situ measurements in the Alpine region
The February 2001 time series of NO2measurements from the NABEL and Zugspitze stations indicate several events with high NO2, the two most outstanding ones around 7–8 and 17–18 February (Fig. 7). The highest NO2 mixing ratio of this month was
25
ACPD
4, 5103–5134, 2004 A transboundary transport episode of NO2observed from GOME D. Schaub et al. Title Page Abstract Introduction Conclusions References Tables Figures J I J I Back Close Full Screen / EscPrint Version Interactive Discussion
© EGU 2004 The NO2 measurements at Chaumont and Zugspitze reached their maximum values
at the same time with 27 ppb and 6 ppb, respectively. At the Taenikon station, the highest value was measured on 8 February (29 ppb), but the value on the evening of the 17th is, nevertheless, a distinct event with 26 ppb NO2. What makes the event on 17–18 February special is the fact that all four stations show an almost simultaneous
5
and significant increase in their nitrogen dioxide mixing ratios. This is in contrast to the event on 7–8 February, when very high NO2values are limited to Taenikon. There, local pollution events are frequent due to the relatively near highway and the inversion layer above the Swiss Plateau which increases pollution concentrations especially in winter.
10
The simultaneous pollution event on 17th and 18th and the similar mixing ratios at the Swiss sites cannot be explained by local sources, because these are strongly different in the north of each of the considered measurement stations. Furthermore, thermal uplifting, which is typical for elevated sites, is not likely to occur during the night and early morning hours, when the maximum NO2mixing ratios were observed. Thus,
15
the higher NO2amounts measured at the elevated stations are expected to be due to larger scale meteorological transport of pollution. It is noteworthy that the maximum NO2mixing ratios of 26 ppb measured in Taenikon, 27 ppb at Chaumont and 30 ppb at Rigi are quite similar, even though the annual mean NO2amounts show a pronounced decrease with increasing height (Taenikon: 7.0 ppb, Rigi: 4.8 ppb, Chaumont: 3.7 ppb;
20
BUWAL, 2002). These similar mixing ratios indicate a rather well mixed and extended air mass, the latter additionally confirmed by the simultaneous increasing mixing ratio at Zugspitze which is located about 290 km away from Rigi. These findings agree well with the above described air masses that have taken up pollution over an extended region and having been transported over mesoscale distances of several hundred kilometers.
ACPD
4, 5103–5134, 2004 A transboundary transport episode of NO2observed from GOME D. Schaub et al. Title Page Abstract Introduction Conclusions References Tables Figures J I J I Back Close Full Screen / EscPrint Version Interactive Discussion
© EGU 2004 4.6. Transport model
4.6.1. Effective cloud top height and conversion with GOME observations
Our method proposed in Sect. 3.2 and illustrated in the flow chart of Fig. 2 is used to model the transport of NO2for this case study. The core element of it is the conversion of population numbers assigned to the trajectories as a proxy for NO2 to number of
5
NO2molecules considering the CTHef f. Figure 8 illustrates an intermediate step where the population numbers assigned to the trajectories are added up above CTHef f to a 2-dimensional proxy for the NO2 VTCs. This is done for different CTHef fs ranging between 750 and 875 hPa. Especially when CTHef f is in the range of 800 to 875 hPa (which is lower than the real CTH), the modeled NO2distribution resembles the GOME
10
observation. The band structure of high NO2present in Fig. 8 agrees with the shape of the occlusion in Fig. 4 and indicates the uplift of previously ground-near pollution.
The conversion factor is the ratio between the sum of the 12 GOME NO2 VTCs (Fig. 3a) and the sum of the 12 vertical columns of the proxies (calculated above the CTHef f for each of the 12 GOME pixel locations shown in Fig. 3a). The explained
15
variance (R2) of the linear fit between the two quantities for different CTHef f is shown in Fig. 9. As the R2 culminates at about 840 hPa, we use this CTHef f as the relevant level for our further calculation and use the 825 and 850 hPa levels to determine the sensitivity of our model with respect to CTHef f. The conversion function (Fig. 9) lets us expect that small changes at this level do not have a large impact on the results.
20
With the conversion factor associated with 840 hPa, the population number of every trajectory is converted to an NO2amount, which further propagates along the forward trajectory.
4.6.2. Comparing in-situ measurements and modeled impact
The model results are shown, together with the measured time series of NO2, in Fig. 10.
25
ACPD
4, 5103–5134, 2004 A transboundary transport episode of NO2observed from GOME D. Schaub et al. Title Page Abstract Introduction Conclusions References Tables Figures J I J I Back Close Full Screen / EscPrint Version Interactive Discussion
© EGU 2004 surprisingly well. The measured variations in the NO2 mixing ratio are reproduced
by the model and the modeled maximum value of about 4 ppb is in the order of the measured value of 6 ppb. Assuming that no local pollution occurred at this high-alpine site, the bulk of the 6 ppb NO2 can be considered as being due to frontal transport. This implies, that the model approach somewhat underestimates the transported NO2.
5
The time displacement of the modeled relative to the measured time series of about 1 to 2 h is most likely explained by inaccuracies in the ground-near trajectories.
The model output for Taenikon is less correlated with the measurement. At the begin-ning of the episode, the increasing mixing ratios are well shown by the model results, but the nearly constant values during the night are overestimated. However, the time
10
range of the overall event is reproduced well and the order of magnitude of the NO2 mixing ratio is matched.
For the two elevated sites at Rigi and Chaumont, the time series modeled for the grid cells corresponding to the sites did not explain the measured NO2 time series ad-equately. Taking into account adjacent grid cells, the time series found there match the
15
measured mixing ratios much better, which might be due to uncertainties in the ground near trajectories. The latter explanation is additionally supported by the fact that for both stations, the corresponding adjacent grid cells are found to be shifted towards the Swiss Plateau. This favors the following explanation: the air mass flow is approximately parallel to the mountain ridges on which the two stations are located (the Jura
Moun-20
tains for Chaumont and the foothills of the Alps for Rigi, Fig. 6). However, the complex Swiss topography strongly affecting the flow is not properly resolved in the ECMWF model with a resolution of 1◦×1◦, displacing the ground near trajectories somewhat. The modeled NO2in the appropriate adjacent grid cells (Fig. 10) explain the shapes of the measured NO2time series at Rigi and Chaumont quite reasonable although for the
25
Chaumont station, the modeled mixing ratios are distinctly lower than the measured values. A reason for that could be that the Chaumont station is most affected by air masses from pixel group 1 (Figs. 1, 3a, and 6). Figure 6 indicates that the air from pixel group 2 has to cover a larger distance to reach this most western station and can,
ACPD
4, 5103–5134, 2004 A transboundary transport episode of NO2observed from GOME D. Schaub et al. Title Page Abstract Introduction Conclusions References Tables Figures J I J I Back Close Full Screen / EscPrint Version Interactive Discussion
© EGU 2004 therefore, be expected to have a minor influence. The colors of pixel group 1 in Fig. 8
further show that the NO2 proxies for these two pixels might be somewhat underes-timated by our method, because for this pixel group with the second highest column values (Fig. 3a), we would expect higher population numbers. This underestimation is probably due to the assumption of a cloud cover with a uniform height.
5
However, during the investigated episode, roughly 50 to 90% of the measured NO2 are found to be caused by transboundary transport (Fig. 10). This seems plausible tak-ing into account that the mean NO2mixing ratios are much lower. The latter are deter-mined by averaging the NO2mixing ratios over the February months of the years 1999 to 2001 for the four stations (with the investigated period from 17 February, 0:00 MET,
10
to 18 February, 12:00 MET, excluded). Typical nighttime NO2mixing ratios from 0.5 ppb at Zugspitze to about 5 ppb for the elevated sites at Rigi and Chaumont are found. Only the Swiss Plateau station Taenikon shows evening mixing ratios exceeding 10 ppb. Al-together we conclude from the comparison of the measured with the modeled NO2 mixing ratios that the GOME NO2 VTCs combined with our simple model can explain
15
the exceptional events with high mixing ratios measured at the four sites.
5. Summary and conclusions
The origin and impact of air pollution observed by GOME above a cloud cover has been investigated in a case study. The suggested method to model the NO2transport is based on trajectory analysis. The NO2 uptake is assumed to be proportional to
20
the population density and is further propagated along trajectories (and corrected for lifetime) to constitute a proxy for the NO2 amount. The GOME measurements are used to convert these proxies to NO2 concentrations using an effective cloud height. The impact of the pollution transport to the remote alpine area has been modeled and compared with the ground-based measurements.
25
In the case study of 17 February 2001, it is shown that polluted boundary layer air was lifted up by a frontal system. This led to nitrogen dioxide being located within
ACPD
4, 5103–5134, 2004 A transboundary transport episode of NO2observed from GOME D. Schaub et al. Title Page Abstract Introduction Conclusions References Tables Figures J I J I Back Close Full Screen / EscPrint Version Interactive Discussion
© EGU 2004 and/or above an extended cloud cover and therefore being detectable by the GOME
instrument. Employing backward trajectories, the source region of the NO2 pollution is identified as being in the central part of Germany, the Ruhr area, and adjacent re-gions in the Netherlands and Belgium. Forward trajectory calculations indicate the subsequent movement of the polluted air masses to the Alpine region and predict that
5
measurement stations in Switzerland and southern Germany must be affected by the frontal transported NO2. The rural in-situ measurements used in this study observed enhanced NO2mixing ratios during the night, thus confirming the prediction. Employ-ing a simple model based on air mass trajectories and the GOME observations, we estimate that at least 50% of the NO2peak mixing ratios measured at the stations
dur-10
ing the frontal passage can be attributed to transboundary transport. Thus, although NO2is usually considered to be a short lived trace gas mainly being influenced by local sources and sinks, this study shows that significant amounts can be transported over mesoscale distances of several 100 km under favorable meteorological conditions.
Although the time resolution of the GOME measurements is limited, this case study
15
demonstrates the gain of a synergistic use of satellite observations and meteorolog-ical data, as atmospheric transport of pollutants can be followed over time and in 3-dimensional space. When the GOME instrument observes a cloudy scene, the lowest part of the troposphere is shielded from the measurement device observing in the visi-ble spectral range. Pollution can directly be detected only within and above the clouds.
20
Nevertheless, together with meteorological data such as trajectories, the polluted air masses are traceable backward and forward in time giving evidence of transboundary pollution transport. Clearly, in the future, spatially and temporally higher resolved mea-surements from space (possibly geostationary) with instrumentation similar to that of GOME would facilitate and enhance the assessment of air quality.
25
Acknowledgements. This work was partly funded by the European Space Agency (ESA), the
Swiss Federal Agency for Environment, Forest and Landscape (SAEFL) and the Swiss Fed-eral Institute for Materials Testing and Research (EMPA). We gratefully acknowledge H. Wernli (ETH Zurich) for the software package “Lagranto” and for his support concerning trajectory
cal-ACPD
4, 5103–5134, 2004 A transboundary transport episode of NO2observed from GOME D. Schaub et al. Title Page Abstract Introduction Conclusions References Tables Figures J I J I Back Close Full Screen / EscPrint Version Interactive Discussion
© EGU 2004
culation. We further acknowledge the Swiss National Air Pollution Monitoring Network (NABEL) and the Umweltbundesamt (Germany) for providing ground-based measurements, MeteoSwiss for the weather charts, the European Centre for Medium-Range Weather Forecast (ECMWF) for providing meteorological wind fields and the British Atmospheric Data Centre (BADC) for the Meteosat images.
5
References
Bethan, S., Vaughan, G., Gerbig, C., Volz-Thomas, A., Richer, H., and Tiddeman, D. A.: Chem-ical air mass differences near fronts, J. Geophys. Res., 103, 13 413–13 434, 1998.
Brasseur, G. P.: Atmospheric chemistry in a changing world, Springer Verlag, Berlin, 2003. Burrows, J. P., Weber, M., Buchwitz, M., Rozanov, V., Ladst ¨atter-Weissenmayer, A., Richter, A.,
10
DeBeek, R., Hoogen, R., Bramstedt, K., Eichmann, K. U., Eisinger, M., and Perner, D.: The global ozone monitoring experiment (GOME): Mission concept and first scientific results, J. Atmos. Sci., 56, 151–175, 1999.
BUWAL: NABEL – Luftbelastung 2001, Schriftenreihe Umwelt Nr. 343, 2002.
Dentener, F. J. and Crutzen, P. J.: Reaction of N2O5 on tropospheric aerosols: impact on the
15
global distributions of NOx, O3and OH, J. Geophys. Res., 98, 7149–7163, 1993.
Dickerson, R. R., Stedman, D. H., and Delany, A. C.: Direct measurements of ozone and nitrogen-dioxide photolysis rates in the troposphere, J. Geophys. Res., 87, 4933–4946, 1982.
Donnell, E. A., Fish, D. J., Dicks, E. M., and Thorpe, A. J.: Mechanisms for pollutant transport
20
between the boundary layer and the free troposphere, J. Geophys. Res., 106, 7847–7856, 2001.
EMPA: Technischer Bericht zum Nationalen Beobachtungsnetz f ¨ur Luftfremdstoffe (NABEL), Duebendorf, 2002.
Hild, L., Richter, A., Rozanov, V., and Burrows, J. P.: Air mass factor calculations for GOME
25
measurements of lightning-produced NO2, Adv. Space Res., 29, 1685–1690, 2002.
Hov, O. and Flatoy, F.: Convective redistribution of ozone and oxides of nitrogen in the tropo-sphere over Europe in summer and fall, J. Atmos. Chem., 28, 319–337, 1997.
Huntrieser, H., Feigl, C., Schlager, H., Schroder, F., Gerbig, C., van Velthoven, P., Flatoy, F.,
Thery, C., Petzold, A., Holler, H., and Schumann, U.: Airborne measurements of NOx, tracer
ACPD
4, 5103–5134, 2004 A transboundary transport episode of NO2observed from GOME D. Schaub et al. Title Page Abstract Introduction Conclusions References Tables Figures J I J I Back Close Full Screen / EscPrint Version Interactive Discussion
© EGU 2004
species, and small particles during the European lightning nitrogen oxides experiment, J. Geophys. Res., 107, art. no. 4113, 2002.
Jaegl ´e, L., Jacob, D. J., Wang, Y., Weinheimer, A. J., Ridley, B. A., Campos, T. L., Sachse,
G. W., and Hagen, D. E.: Sources and chemistry of NOx in the upper troposphere over the
United States, Geophys. Res. Lett., 25, 1705–1708, 1998.
5
Kramm, G., Dlugi, R., Dollard, G. J., Foken, T., M ¨olders, N., M ¨uller, H., Seiler, W., and Sievering, H.: On the dry deposition of ozone and reactive nitrogen species, Atmos. Envir., 29, 3209– 3231, 1995.
Kunhikrishnan, T., Lawrence, M. G., von Kuhlmann, R., Richter, A., Ladst ¨atter-Weissenmayer,
A., and Burrows, J. P.: Analysis of tropospheric NOx over Asia using the model of
atmo-10
spheric transport and chemistry (MATCH-MPIC) and GOME-satellite observations, Atmos. Envir., 38, 581–596, 2004.
Leue, C., Wenig, M., Wagner, T., Klimm, O., Platt, U., and Jahne, B.: Quantitative analysis
of NOx emissions from Global Ozone Monitoring Experiment satellite image sequences, J.
Geophys. Res., 106, 5493–5505, 2001.
15
MeteoSwiss: Alpine Weather Statistics (Alpenwetterstatistik – Witterungskalender: Beschrei-bung der einzelnen Parameter), MeteoSwiss, Switzerland, 1985.
Parrish, D. D., Murphy, P. C., Albritton, D. L., and Fehsenfeld, F. C.: The measurement of the
photo-dissociation rate of NO2in the atmosphere, Atmos. Envir., 17, 1365–1379, 1983.
Richter, A. and Burrows, J. P.: Tropospheric NO2from GOME measurements, Adv. Space Res.,
20
29, 1673–1683, 2002.
Seinfeld, J. H. and Pandis, S. N.: Atmospheric chemistry and physics – from air pollution to climate change, John Wiley & Sons, New York, 1998.
Spichtinger, N., Wenig, M., James, P., Wagner, T., Platt, U., and Stohl, A.: Satellite detection of a continental-scale plume of nitrogen oxides from boreal forest fires, Geophys. Res. Lett.,
25
28, 4579–4582, 2001.
Stohl, A., Eckhardt, S., Forster, C., James, P., and Spichtinger, N.: On the pathways and timescales of intercontinental air pollution transport, J. Geophys. Res., 107, art. no. 4684, 2002.
Stohl, A., Huntrieser, H., Richter, A., Beirle, S., Cooper, O. R., Eckhardt, S., Forster, C., James,
30
P., Spichtinger, N., Wenig, T., Wagner, T., Burrows, J. P., and Platt, U.: Rapid intercontinental air pollution transport associated with a meteorological bomb, Atmos. Chem. Phys., 3, 969– 985, 2003.
ACPD
4, 5103–5134, 2004 A transboundary transport episode of NO2observed from GOME D. Schaub et al. Title Page Abstract Introduction Conclusions References Tables Figures J I J I Back Close Full Screen / EscPrint Version Interactive Discussion
© EGU 2004
Umweltbundesamt: Jahresbericht 2001 aus dem Messnetz des Umweltbundesamtes, 69, Berlin, 2002.
UNEP: Global Population Distribution Database,http://grid2.cr.usgs.gov/globalpop, 1997.
Weiss, A. K., Petritoli, A., Schaub, D., and Bonasoni, P.: DUP-POLPO Case Study Collection, ESA, Frascati, 2002.
5
Wenig, M., Spichtinger, N., Stohl, A., Held, G., Beirle, S., Wagner, T., Jahne, B., and Platt, U.: Intercontinental transport of nitrogen oxide pollution plumes, Atmos. Chem. Phys., 3, 387–393, 2003.
Wernli, H. and Davies, H. C.: A Lagrangian-based analysis of extra-tropical cyclones, 1. The method and some applications, Q. J. R. Meteo., 123, 467–489, 1997.
10
Wetterzentrale Karlsruhe: Archiv der Europablitzkarten, http://www.wetterzentrale.de/
topkarten/tkbeoblar.htm.
Wiegand, A. N. and Bofinger, N. D.: Review of empirical methods for the calculation of the
diurnal NO2photolysis rate coefficient, Atmos. Envir., 34, 99–108, 1999.
Winer, A. M. and Biermann, H. W.: Long path length differential optical-absorption spectroscopy
15
(DOAS) measurements of gaseous HONO, NO2and HCHO in the California south coast air
basin, Res. Chem. In., 20, 423–445, 1994.
Wunderli, S. and Gehrig, R.: Influence of temperature on formation and stability of surface PAN and ozone – a 2-year field-study in Switzerland, Atmos. Envir., 25, 1599–1608, 1991.
Zellweger, C., Ammann, M., Hofer, P., and Baltensperger, U.: NOyspeciation with a combined
20
wet effluent diffusion denuder – aerosol collector coupled to Ion chromatography, Atmos.
Envir., 33, 1131–1140, 1999.
Zellweger, C., Forrer, J., Hofer, P., Nyeki, S., Schwarzenbach, B., Weingartner, E., Ammann,
M., and Baltensperger U.: Partitioning of reactive nitrogen (NOy) and dependence on
mete-orological conditions in the lower free troposphere, Atmos. Chem. Phys., 3, 779–796, 2003.
ACPD
4, 5103–5134, 2004 A transboundary transport episode of NO2observed from GOME D. Schaub et al. Title Page Abstract Introduction Conclusions References Tables Figures J I J I Back Close Full Screen / EscPrint Version Interactive Discussion
© EGU 2004
Table 1. GOME NO2vertical tropospheric column densities (VTCs) for the standard processing
and the two reprocessing scenarios A and B. The NO2 VTCs are the average values for the
two pixel groups shown in Fig. 3a.
standard processing reprocessing A reprocessing B NO2profile standard a priori profile, constant NO2layer between 4000 NO2layer between 4000
mixing ratio in the lowermost 1.5 km and 6000 m a.s.l. and 6000 m a.s.l. (Richter and Burrows, 2002)
cloud cover – closed cloud cover partly cloudy cloud top height – 3000 m a.s.l. 3000 m a.s.l. NO2VTCs 38 (pixel group 1) 13 (pixel group 1) 12 (pixel group 1) [×1015molec cm−2] 64 (pixel group 2) 17.5 (pixel group 2) 16.5 (pixel group 2)
ACPD
4, 5103–5134, 2004 A transboundary transport episode of NO2observed from GOME D. Schaub et al. Title Page Abstract Introduction Conclusions References Tables Figures J I J I Back Close Full Screen / EscPrint Version Interactive Discussion © EGU 2004 50km N Chaumont rural 1140 m asl Rigi rural 1030 m asl Taenikon rural 540 m asl Zugspitze high-alpine 2960 m asl Austria Italy Germany France Switzerland
Fig. 1. The location of the three remote ground-based measurement stations operated by the
Swiss National Air Pollution Monitoring Network (NABEL) and the Zugspitze station (Umwelt-bundesamt, 2002) which are used in this case study.
ACPD
4, 5103–5134, 2004 A transboundary transport episode of NO2observed from GOME D. Schaub et al. Title Page Abstract Introduction Conclusions References Tables Figures J I J I Back Close Full Screen / EscPrint Version Interactive Discussion
© EGU 2004
Fig. 2. Flow chart illustrating the proposed method (Sect. 3.2) to model NO2mixing ratios at ground, employing population numbers assigned to the trajectories and subsequent conversion
with GOME NO2vertical tropospheric column densities (VTCs). (CTHef f = effective cloud top
ACPD
4, 5103–5134, 2004 A transboundary transport episode of NO2observed from GOME D. Schaub et al. Title Page Abstract Introduction Conclusions References Tables Figures J I J I Back Close Full Screen / EscPrint Version Interactive Discussion © EGU 2004 1015 molec cm-2 > < 0.0 3.0 6.0 9.0 12.0 15.0
a
pixel group 2 pixel group 1Fig. 3. (a) GOME track on 17 February 2001, showing high NO2 VTCs above clouds. For the highest values (pixel groups 1 and 2, each consisting of 2 GOME pixels) trajectories are discussed qualitatively. The transport model calculation is based on all of the 12 framed pixels
found relevant for the investigated air mass.(b) Meteosat visible wavelength image detected at
ACPD
4, 5103–5134, 2004 A transboundary transport episode of NO2observed from GOME D. Schaub et al. Title Page Abstract Introduction Conclusions References Tables Figures J I J I Back Close Full Screen / EscPrint Version Interactive Discussion
© EGU 2004
Fig. 4. Weather maps showing the southward moving cold front on 16 February 2001 (left)
ACPD
4, 5103–5134, 2004 A transboundary transport episode of NO2observed from GOME D. Schaub et al. Title Page Abstract Introduction Conclusions References Tables Figures J I J I Back Close Full Screen / EscPrint Version Interactive Discussion
© EGU 2004
-80 -60 -40 -20 0 hours before arrival in the GOME column 0
100 200 300 400
trajectory height above model ground [hPa]
500
-100
a
-80 -60 -40 -20 0 hours before arrival in the GOME column 0
100 200 300 400
trajectory height above model ground [hPa]
500
-100
b
Fig. 5. Backward trajectories arriving on 17 February 2001, 9:00 UTC, in the two GOME pixel
groups 1(a) and 2 (b) defined in Fig. 3a. The colored dots mark hourly trajectory time steps
with a trajectory height above model ground of less than 150 hPa (blue), less than 100 hPa (green) and less than 50 hPa (red), respectively. For clarity, in the horizontal projections, only trajectories with a distance from ground of less than 100 hPa for at least one hourly time step are shown and trajectory points exceeding 150 hPa ground distances are omitted. The source
regions of the detected NO2 are likely to be located where the trajectories reside near the
ACPD
4, 5103–5134, 2004 A transboundary transport episode of NO2observed from GOME D. Schaub et al. Title Page Abstract Introduction Conclusions References Tables Figures J I J I Back Close Full Screen / EscPrint Version Interactive Discussion
© EGU 2004
10 20 30 40
hours after start in the GOME column 0
100 200 300 400
trajectory height above model ground [hPa]
0
a
0 10 20 30 40
hours after start in the GOME column 0
100 200 300 400
trajectory height above model ground [hPa]
b
Fig. 6. The forward trajectories of the two GOME pixel groups 1 and 2 (defined in Fig. 3a)
start-ing on 17 February 2001, 9:00 UTC, indicate the polluted air masses proceed to Switzerland and the Alpine region and further to south-west.
ACPD
4, 5103–5134, 2004 A transboundary transport episode of NO2observed from GOME D. Schaub et al. Title Page Abstract Introduction Conclusions References Tables Figures J I J I Back Close Full Screen / EscPrint Version Interactive Discussion
© EGU 2004
Fig. 7. NO2 mixing ratios measured at the NABEL ground stations Chaumont, Rigi and Taenikon and at the high-alpine site at Zugspitze in February 2001.
ACPD
4, 5103–5134, 2004 A transboundary transport episode of NO2observed from GOME D. Schaub et al. Title Page Abstract Introduction Conclusions References Tables Figures J I J I Back Close Full Screen / EscPrint Version Interactive Discussion © EGU 2004 CTHeff = 750 hPa [x 103] > < 5 30 120 10 1 60 assigned population numbers [x 103] > < 5 30 120 10 1 60 assigned population numbers CTHeff = 775 hPa CTHeff = 800 hPa [x 103] > < 5 30 120 10 1 60 assigned population numbers [x 103] > < 5 30 120 10 1 60 assigned population numbers CTHeff = 825 hPa CTHeff = 850 hPa [x 103] > < 5 30 120 10 1 60 assigned population numbers [x 103] > < 5 30 120 10 1 60 assigned population numbers CTHeff = 875 hPa
Fig. 8. Population numbers (assigned to the backward trajectories as a proxy for NOx
emis-sions) added up above different CTHef f between 750 hPa and 875 hPa to a 2-dimensional proxy
ACPD
4, 5103–5134, 2004 A transboundary transport episode of NO2observed from GOME D. Schaub et al. Title Page Abstract Introduction Conclusions References Tables Figures J I J I Back Close Full Screen / EscPrint Version Interactive Discussion
© EGU 2004
Fig. 9. Explained variance R2 of the linear fit between the vertical column proxies and the
GOME NO2 VTCs (solid line) and the respective conversion factors (dashed line) for different
ACPD
4, 5103–5134, 2004 A transboundary transport episode of NO2observed from GOME D. Schaub et al. Title Page Abstract Introduction Conclusions References Tables Figures J I J I Back Close Full Screen / EscPrint Version Interactive Discussion
© EGU 2004
Fig. 10. NO2mixing ratios measured during the investigated episode (black) and results of the
model assessment of the advected additional NO2 (red). The thick red curve corresponds to
the optimal CTHef f (840 hPa), the thin curves result from the adjacent (trajectory) levels in 825
(upper curve) and 850 hPa (lower curve). For the Zugspitze and Taenikon stations, the time series from the grid cells containing the measurement sites are used, whereas for Rigi and Chaumont, adjacent grid cells show more reliable results (see text).