HAL Id: hal-01022704
https://hal.archives-ouvertes.fr/hal-01022704
Submitted on 16 Jul 2014
HAL is a multi-disciplinary open access
archive for the deposit and dissemination of
sci-entific research documents, whether they are
pub-lished or not. The documents may come from
teaching and research institutions in France or
L’archive ouverte pluridisciplinaire HAL, est
destinée au dépôt et à la diffusion de documents
scientifiques de niveau recherche, publiés ou non,
émanant des établissements d’enseignement et de
recherche français ou étrangers, des laboratoires
Nicolas Palix, Gaël Thomas, Suman Saha, Christophe Calvès, Gilles Muller,
Julia Lawall
To cite this version:
Nicolas Palix, Gaël Thomas, Suman Saha, Christophe Calvès, Gilles Muller, et al.. Faults in Linux
2.6. ACM Transactions on Computer Systems, Association for Computing Machinery, 2014, 32 (2),
pp.1–40. �10.1145/2619090�. �hal-01022704�
Faults in Linux 2.6
NICOLAS PALIX, Grenoble - Alps University/UJF, LIG-Erods
GAËL THOMAS, SUMAN SAHA, CHRISTOPHE CALVÈS, GILLES MULLER and JULIA LAWALL, Inria/UPMC/Sorbonne University/LIP6-Regal
In August 2011, Linux entered its third decade. Ten years before, Chou et al. published a study of faults found by applying a static analyzer to Linux versions 1.0 through 2.4.1. A major result of their work was that the drivers directory contained up to 7 times more of certain kinds of faults than other directories. This result inspired numerous efforts on improving the reliability of driver code. Today, Linux is used in a wider range of environments, provides a wider range of services, and has adopted a new development and release model. What has been the impact of these changes on code quality?
To answer this question, we have transported Chou et al.’s experiments to all versions of Linux 2.6, released between 2003 and 2011. We find that Linux has more than doubled in size during this period, but the number of faults per line of code has been decreasing. And the fault rate of drivers is now below that of other directories, such as arch. These results can guide further development and research efforts for the decade to come. To allow updating these results as Linux evolves, we define our experimental protocol and make our checkers available.
Categories and Subject Descriptors: D.4 [Operating Systems]: Reliability General Terms: Reliability, Experimentation, Measurement
Additional Key Words and Phrases: Linux, fault-finding
ACM Reference Format:
Nicolas Palix, Gaël Thomas, Suman Saha, Christophe Calvès, Gilles Muller and Julia Lawall. 2013. Faults in Linux 2.6 ACM Trans. Comput. Syst. 32, 2, Article 4 (June 2014), 41 pages.
DOI:http://dx.doi.org/10.1145/2619090
1. INTRODUCTION
The Linux operating system is widely used, on platforms ranging from embedded sys-tems, to personal computers, to servers and supercomputers. As an operating system (OS) with a traditional monolithic kernel, Linux is responsible for the security and integrity of the interactions between the software and the underlying hardware. There-fore, its correctness is essential. Linux also has a large developer base, as it is open source, and is rapidly evolving. Thus, it is critical to be able to continually assess and control the quality of its code.
Over 10 years ago, in 2001, Chou et al. published a study of the distribution and lifetime of certain kinds of faults1in OS code, focusing mostly on the x86 code in the
Linux kernel [Chou et al. 2001], in versions up to 2.4.1. The ability to collect fault information automatically from such a large code base was revolutionary at the time, and this work has been highly influential. Indeed, their study has been cited over 580 times, according to Google Scholar, and has been followed by the development of a whole series of strategies for automatically finding faults in systems code [Aiken et al. 2007; Li and Zhou 2005; Searls 2004; The Kernel Janitors 2010; Wheeler 2006]. The statistics reported by Chou et al. have been used for a variety of purposes, including providing evidence that driver code is unreliable [Herder et al. 2009; Swift et al. 2006], and evidence that certain OS subsystems are more reliable than others [Depoutovitch and Stumm 2010].
1
Chou et al. used the terminology “errors.” In the software dependability literature [IEEE Std 982.2 1988], however, this term is reserved for incorrect states that occur during execution, rather than faults in the source code, as were investigated by Chou et al. and are investigated here.
Linux, however, has changed substantially since 2001, and thus it is worth examining the continued relevance of Chou et al.’s results. In 2001, Linux was a relatively young OS, having first been released only 10 years earlier, and was primarily used by specialists. Today, well-supported Linux distributions are available, targeting servers, embedded systems, and the general public [Fedora 2013; Ubuntu 2013]. Linux code is changing rapidly, and only 30% of the code in the Linux 2.6.33 kernel is more than five years old [Corbet 2010a; Corbet 2010b]. As of 2014, Linux supports 29 architectures, up from 13 in Linux 2.4.1 (2001) and 24 in Linux 3.0 (2011), and the developer base has grown commensurately. The development model has also changed substantially. Until Linux 2.6.0, which was released at the end of 2003, Linux releases were split into stable versions, which were installed by users, and development versions, which accommodated new features. Since Linux 2.6.0 this distinction has disappeared; releases in the 2.6 and 3 series occur every three months, and new features are made available whenever they are ready. Finally, a number of fault finding tools have been developed that target Linux code. Patches are regularly submitted for faults found using checkpatch [Checkpatch 2006], Coccinelle [Padioleau et al. 2008], Coverity [Coverity 2008], smatch [The Kernel Janitors 2010] and Sparse [Searls 2004; Sparse 2003].
In this paper, we transport the experiments of Chou et al. to the versions of Linux 2.6, in order to reevaluate their results in the context of the recent state of Linux development. Because Chou et al.’s fault finding tool and checkers were not released, and their results were released on a local web site that is no longer available, it is impossible to exactly reproduce their results on recent versions of the Linux kernel.2To
provide a baseline that can be more easily updated as new versions are released, we propose an experimental protocol based on the open source tools Coccinelle [Padioleau et al. 2008], for automatically finding faults in source code, and Herodotos [Palix et al. 2010a], for tracking these faults across multiple versions of a software project. We validate this protocol by replicating Chou et al.’s experiments as closely as possible on Linux 2.4.1 and then apply our protocol to all versions of Linux 2.6 released between December 2003 and May 2011. Finally, the next Linux version, Linux 3.0 (released July 2011), is also covered as a potential starting point for future studies. Note however that the change in version numbering is aesthetic and to celebrate the 20th
anniversary of Linux3, and so the difference between 2.6.39 and 3.0 is in principle no greater or
lesser than the difference between any other 2.6 version and its successor. To ensure the perenity and reproducibility of our work, our tools and results are available in the appendices4 of a research report [Palix et al. 2010c] hosted in an open archival
repository.
The contributions of our work are as follows:
— We provide a repeatable methodology for finding faults in Linux code, based on open source tools, and a publicly available archive containing our complete results. — We show that the faults kinds considered 10 years ago by Chou et al. are still relevant,
because such faults are still being introduced and fixed, in both new and existing files. These fault kinds vary in their impact, but we have seen many patches for these kinds of faults submitted to the Linux kernel mailing list [LKML 2013] and have not seen any receive the response that the fault was too trivial to fix.
2Chou et al.’s work did lead to the development of the commercial tool Coverity, but using it requires signing an
agreement not to publish information about its results (http://scan.coverity.com/policy.html#license).
3See https://lkml.org/lkml/2011/5/29/204 and https://lkml.org/lkml/2011/7/21/455 4
One may have to open the detailed view to see the appendices. The version 2 of the appendices corresponds to the data and tools of the preliminary version of this work [Palix et al. 2011]. Version 3 updates the data and tools used for this paper.
— We show that while the rate of introduction of such faults continues to rise, the rate of their elimination is rising slightly faster, resulting in a kernel that is becoming more reliable with respect to these kinds of faults. This is in contrast with previous results for earlier versions of Linux, which found that the number of faults was rising with the code size.
— We show that the rate of the considered fault kinds is falling in the drivers directory, which suggests that the work of Chou et al. and others has succeeded in directing attention to driver code. The directories arch (HAL) and fs (file systems) now show a higher fault rate, and thus it may be worthwhile to direct research efforts to the problems of such code.
— We show that the lifespan of faults in Linux 2.6 is comparable to that observed by Chou et al. for earlier versions. Chou et al. observed a lifespan of 2.5 or 1.8 years according to how faults not yet fixed at the end of the considered period are taken into account. For Linux 2.6, we observe an average fault lifespan between 2.5 and 3.0 years. The Linux 2.6 median lifespan ranges between 1.5 and 2.2 years and thus has increased since the period considered by Chou et al., where the reported median was 1.25 years. However, the median age of faults has decreased by 6 months over the Linux 2.6 versions. Moreover, we find that fault kinds that are more likely to have a visible impact during execution have a much shorter average lifespan, of as little as one year.
— Although fault-finding tools are now being used regularly in Linux development, they seem to have only had a small impact on the kinds of faults we consider. Research is thus needed on how such tools can be better integrated into the development process. Our experimental protocol exploits previously collected information about false positives, reducing one of the burdens of tool use, but we propose that approaches are also needed to automate the fixing of faults, and not just the fault finding process.
The rest of this paper is organized as follows. Section 2 briefly presents our experi-mental protocol based on Coccinelle and Herodotos. Section 3 gives some background on the evolution of Linux. Section 4 establishes a baseline for our results, by comparing our results for Linux 2.4.1 with those of Chou et al. Section 5 presents a study of Linux 2.6, considering the kinds of code that contain faults, the distribution of faults across Linux code, and the lifetime of faults. Section 6 correlates the faults with other factors related to the Linux development model such as the activity of the developers, the structure of the code and its evolution. Section 7 evaluates the interest and applicability of the study to new code. Section 8 presents some limitations of our approach. Finally, Section 9 describes related work and Section 10 presents our conclusions. Throughout the paper, our main findings are shown in italics.
2. EXPERIMENTAL PROTOCOL
In the laboratory sciences there is a notion of experimental protocol, giving all of the information required to reproduce an experiment. We believe that there is a need for such a protocol in the study of software as well. For a study of faults in operating systems code, such a protocol should include the definition of the fault finding tools and checkers, as each of these elements substantially affects the results. In this section, we first present our checkers (Section 2.1), then describe how we calcuate the fault rate (Section 2.2), and finally describe the tools (Section 2.3) that we have used in the fault finding and validation process. All of our results, as well as the scripts used and the source code of the tool used, Coccinelle and Herodotos, are available on the open access archive HAL [Palix et al. 2010c] and on the publicly available project website [Palix et al. 2010b].
2.1. Fault finding checkers
The exact definitions of the checkers used by Chou et al. are not publicly available. Based on the descriptions of Chou et al., we have implemented our interpretations of their Block, Null, Var, Inull, Range, Lock, Intr, LockIntr, Float, and Size checkers. We omit the Real checker, related to the misuse of realloc, and the Param checker, related to dereferences of user-level pointers, as in both cases, we did not have enough information to define checkers that found any faults. For instance, to perform memory reallocation, there is no krealloc function in Linux 2.4.1, as there is in recent kernel versions; We tried looking for other memory reallocation function, e.g. skb_realloc_headroom, but the checker did not find any fault. In the description of each checker, the initial citation in italics is the description provided by Chou et al.
Block. “To avoid deadlock, do not call blocking functions with interrupts disabled or
a spinlock held.”Implementing this checker requires knowing the set of functions that
may block, the set of functions that disable interrupts, and the set of functions that take spinlocks. These functions vary across Linux versions. Identifying them precisely requires a full interprocedural analysis of the Linux kernel source code, including a precise alias analysis, as these operations may be performed via function pointers. To our knowledge, Chou et al.’s tool xgcc did not provide these features in 2001, and thus we assume that these functions were identified based on their examination of the source code and possibly heuristics for collecting functions with particular properties. We take the same approach, but add a simple interprocedural analysis, based on the iterative computation of a transitive closure through the call graph. This iterative analysis implies that our Block checker automatically takes into account the new blocking functions that are added in each version.
To identify blocking functions, we consider two kinds of functions as the starting point of our interprocedural analysis. First, we observe that basic memory allocation functions, such as the kernel function kmalloc, often take as argument the constant GFP_KERNEL when they are allowed to block until a page becomes available. Thus, we consider that a function that contains a call with GFP_KERNEL as an argument may block. Second, we observe that blocking is directly caused by calling the function schedule. Given this initial list of blocking functions, we then iteratively augment the list with the names of functions that call functions already in the list without first explicitly releasing locks or turning on interrupts, until reaching a fixed point.
To identify functions that turn off interrupts and take locks, we rely on our knowl-edge of a set of commonly used functions for these purposes, listed in the appendix. BlockIntr checks for the case where a blocking function is called while interrupts are disabled. However, we observe that blocking with interrupts turned off is not necessarily a fault, and indeed core Linux scheduling functions, such as interruptible_sleep_on, call schedule with interrupts turned off. We have taken this issue into account when checking for false positives. Analogously, we consider the case where a blocking function is called while holding a spinlock, which is always a fault. We refer to this checker as BlockLock to highlight the different design.
Null. “Check potentially NULL pointers returned from routines.” To collect a list of the functions that may return NULL, we follow the same iterative strategy as for the Block checker, with the starting point of the iteration being the set of functions that explicitly return NULL. Once the transitive closure is computed, we check the call sites of each collected function to determine whether the returned value is compared to NULL before it is used.
Var. “Do not allocate large stack variables (> 1K) on the fixed-size kernel stack.” Our checker looks for local variables that are declared as large arrays, e.g., 1,024 or more
elements for a char array. Many array declarations express the size of the array using macros, or even local variables, rather than explicit constants. Because Coccinelle does not expand macros, and indeed some macros may have multiple definitions across different architectures, we consider only array declarations where the size is expressed as an explicit constant.
Inull. “Do not make inconsistent assumptions about whether a pointer is NULL.” We distinguish two cases: IsNull, where a null test on a pointer is followed by a dereference of the pointer, and NullRef, where a dereference of a pointer is followed by a null test on the pointer. The former is always an error, while the latter may be an error or may simply indicate overly cautious code, if the pointer can never be NULL. Still, at least one NullRef fault has been shown to allow an attacker to obtain root access [Spencer 2009]. This kind of code is unstable [Wang et al. 2013], implying that compiler optimisations can introduce vulnerabilities.
Range. “Always check bounds of array indices and loop bounds derived from user
data.” We recognize the functions memcpy_fromfs, copy_from_user and get_user as
giving access to user data. Possible faults are cases where a value obtained using one of these functions is used as an array index, with no prior test on its value, and where some value is checked to be less than a value obtained using one of these functions, as would occur in validating a loop index.
Lock and Intr. “Release acquired locks; do not double-acquire locks (Lock).” “Restore
disabled interrupts (Intr).”In early versions of Linux, locks and interrupts were
man-aged separately: typically interrupts were disabled and reenabled using cli and sti, respectively, while locks were managed using operations on spinlocks or semaphores. In Linux 2.1.30, however, functions such as spin_lock_irq were introduced to combine locking and interrupt management. Thus, our Lock checker is limited to operators that only affect locks (spinlocks and, from Linux 2.6.16, mutexes), our Intr checker is limited to operators that only disable interrupts, and for the combined operations, we introduce a third checker, LockIntr. The considered functions are listed in the appendix.
Free. “Do not use freed memory.”Like the Null checker, this checker first iteratively collects functions that always apply either kfree or some collected function to some parameter, and then checks each call to either kfree or a collected function for a use of the freed argument after the call.
Float. “Do not use floating point in the kernel.”Most uses of floating point in kernel code are in computations that are performed by the compiler and then converted to an integer, or are in code that is part of the kernel source tree, but is not actually compiled into the kernel. Our checker only reports a floating point constant that is not a subterm of an arithmetic operation involving another constant, and thus may end up in the compiled kernel code.
Size. “Allocate enough memory to hold the type for which you are allocating.”Because our checker works at the source code level without first invoking the C preprocessor, it is not aware of the sizes of the various data types on a particular architecture. We thus focus on the information apparent in the source code, considering the following two cases. In the first case, one of the basic memory allocation functions, kmalloc or kzalloc, is given a size argument involving a sizeof expression defined in terms of a type that is different from the type of the variable storing the result of the allocation. To reduce the number of false positives, the checker ignores cases where one of the types involved represents only one byte, such as char, as these are often used for allocations of unstructured data. We consider as a fault any case where there is no clear relationship between the types, whether the allocated region is too large or too small. In the second
Table I. Assessment of the difficulty of finding and fixing faults, and the potential of a fault to cause a crash or hang at runtime
Find Fix Impact
Block Hard Hard Low
Null Hard Hard Low
Var Easy Easy Low
IsNull Easy Easy Low NullRef Easy Hard Low
Range Easy Easy Low
Find Fix Impact
Lock Easy Easy High
Intr Easy Easy High
LockIntr Easy Easy High
Free Hard Easy High
Float Easy Hard High
Size Easy Easy High
case, there is an assignment where the right hand side involves taking the size of the left hand side expression itself, rather than the result of dereferencing that expression. In this case, the allocated region has the size of a pointer, which is typically significantly smaller than the size intended.
These faults vary in how easy they are to find in the source code, how easy they are to fix once found, and the likelihood of a runtime impact. Table I summarizes these properties for the various fault kinds, based on our observations in studying the code. Faults involving code within a single function are often easy for both maintainers and tools to detect, and thus we designate these as “Easy.” Finding “Hard” faults requires an interprocedural analysis to identify functions that have specific properties. Interprocedural analysis requires more effort or expertise from a maintainer, or more complexity in a tool. Fixing a fault may require only an easy local change, as in Size, where the fix may require only changing the argument of sizeof to the type of the allocated value. Cases that require creating new error handling code, such as Null, or choosing between several alternative fixes (e.g., moving a dereference or dropping an unnecessary null test), such as NullRef, are more difficult. Instances of fault kinds that entail more difficult fixes may benefit less from the use of tools, as the tool user may not have enough expertise to choose the correct fix. Finally, we indicate a low impact when a crash or hang is only likely in an exceptional condition (e.g., for Null or IsNull faults in error-handling code), and high when it is likely in normal execution.
2.2. Assessing the fault rate
The maximum number of faults that code can contain is the number of occurrences of code relevant to the fault, i.e. where a given kind of fault may appear. For example, the number of Block faults is limited by the number of calls to blocking functions. We follow Chou et al. and refer to these occurrences of relevant code as notes. Then,
fault rate = faults/notes
We find the notes associated with each of our checkers as follows. For Block, Null, and Free, a note is a call to one of the functions collected as part of the transitive closure in the fault-finding process. For Var, a note is a local array declaration. For Inull (IsNull and NullRef), a note is a null test of a value that is derefenced elsewhere in the same function. For Range and for Lock, Intr, or LockIntr, a note is a call to one of the user-level access functions or locking functions, respectively. For Size, a note is a use of sizeof as an argument to one of the basic memory allocation functions kmalloc or kzalloc when the argument is a type, or a use of sizeof where the argument is an expression. In the former case, as for the checker, we discard some cases that are commonly false positives such as when the argument to sizeof is a one-byte type such as char. Finally, we do not calculate the number of notes for Float, because we consider that every occurrence of a float in a context where it may be referenced in the compiled code is a fault, and thus the number of notes and faults is the same.
2.3. Tools
Our experimental protocol relies on two open-source tools: Coccinelle (v1.0.0-rc15), to automatically find potential faults and notes in the Linux kernels [Padioleau et al. 2008], and Herodotos (v0.6.1-rc1), to correlate the fault reports between versions [Palix et al. 2010a]. We store the resulting data in a PostgreSQL database (v9.1.5), and analyze it using SQL queries.
Coccinelle performs control-flow based pattern searches in C code. It provides a language, the Semantic Patch Language (SmPL), for specifying searches and trans-formations and an engine for performing them. Coccinelle’s strategy for traversing control-flow graphs is based on the temporal logic CTL [Brunel et al. 2009], while that of the tool used by Chou et al. is based on automata. There are technical differences between these strategies, but we do not expect that they are relevant here.
A notable feature of Coccinelle is that it does not expand preprocessor directives. We have only found this feature to be a limitation in the Var case, as noted in Section 2.1. On the other hand, this feature has the benefit of making the fault-finding process independent of configuration information, and thus we can find faults across the entire Linux kernel source tree, rather than being limited to a single architecture.
To be able to understand the evolution of faults in Linux code, it is not sufficient to find potential faults in the code base; we must also understand the history of individual fault occurrences. To do so, we must be able to correlate potential fault occurrences across multiple Linux versions, even in the presence of code changes in the files, and manage the identification of these occurrences as real faults and false positives. For these operations, we use Herodotos. To correlate fault occurrences, Herodotos first uses diff to find the changes in each pair of successive versions of a file for which Coccinelle has produced fault reports. If a pair of reports in these files occurs in the unchanged part of the code, at corresponding lines, the reports are automatically considered to represent the same fault, with no user intervention. Otherwise, in a pair of reports, if the report in the older version occurs in the changed part of the code, then its status is considered to be unknown, and the user must indicate, via an interface based on the emacs “org” mode [Org 2013], whether the pair to which it belongs represents the same fault or unrelated ones. We have validated this approach by manually inspecting a randomly chosen set of automatic correlations. None of the hundreds of correlations inspected was suspicous among the more than 46,000 automatic correlations performed. Once the correlation process is complete, a similar interface is provided to allow the user to classify each group of correlated reports as representing either a fault or a false positive. Further details about the process of using Herodotos are provided elsewhere [Palix et al. 2010a].
Once the fault reports are correlated and assessed for false positives, we import their histories into a database, along with the associated notes. The database also contains information about Linux releases such as the release date and code size, and information about Linux files (size, number of modifications between releases) and functions (starting and ending line numbers). The complete database, including both the reports and the extra information, contains 2 GB of data. To analyze the collected data, we wrote over 2,100 lines of PL/pgSQL and SQL queries and about 300 lines of R that extract and correlate information.
Extending the results to new versions.A benefit of our experimental protocol is that
it makes it easy to extend the results to new versions of Linux. When a new version of Linux is released, it is only necessary to run the checkers on the new code, and then repeat the correlation process. As our collected data contains information not only about the faults that we have identified, but also about the false positives, Herodotos
1994 1995 1996 1997 1998 1999 2000 2001 2002 2003 2004 2005 2006 2007 2008 2009 2010 2011 0 2 4 6 8
Million lines of code
Other Drivers/Staging Arch
Drivers w/o Staging File Systems (FS) Net Sound 1.0 1.2.0 2.0 2.1.0 2.2.0 2.3.0 2.4.0 2.4.1 2.5.0 2.6.0 2.6.12 2.6.28 3.0
Fig. 1. Linux directory sizes (in MLOC)
automatically annotates both faults and false positives left over from previous versions as such, leaving only the new reports to be considered by the user.
3. EVOLUTION OF LINUX
To give an overview of the complete history of Linux, we first consider the evolution in code size of the Linux kernel between version 1.0, released in March 1994, and version 3.0, released in July 2011, as shown in Figure 1. Prior to Linux 2.6, this figure shows the size of the development versions (with odd version number), when available, as new code is added in these versions, and this added code is then maintained in the subsequent stable versions (with even version number). Starting with Linux 2.6, we show all major versions, all of which can contain new code. Code sizes are computed using David A. Wheeler’s SLOCCount (v2.26) [Wheeler 2013] and include only the ANSI C code. The code sizes are broken down by directory, highlighting the largest directories: drivers/staging, arch, drivers, fs (file systems), net, and sound. Drivers/staging was added in Linux 2.6.28 as an incubator for new drivers that are not yet mature enough to be used by end users. Code in drivers/staging is not compiled as part of the default Linux configuration, and is thus not included in standard Linux distributions. Sound was added in Linux 2.5.5, and contains sound drivers that were previously in the drivers directory. The largest directory is drivers, which, including drivers/staging, has made up 57% of the source code since Linux 2.6.30.
Due to the large increase in size and the high level of churn, relatively few lines of Linux 3.0 have been present in the Linux kernel since Linux 2.6.0, as shown by Figure 2. Indeed, as reported by the linetags tool from the gitdm5toolsuite, only 20% of the lines
of Linux 2.6.0 have been kept untouched througout the Linux 2.6 history. Except for Linux 2.6.0, every version of Linux 2.6 has contributed as new code less than 5% of the code found in Linux 3.0. Nevertheless, recent versions tend to introduce a larger part of Linux 3.0 as compared to older versions. Indeed, each version released after 2007
introduces more than 2% of the Linux 3.0 code,i.e., more than 55% in total, whereas each
earlier version, except 2.6.0, introduces less than 2%.Linux 2.6.0 is an exception as it
represents in part the code that is inherited from the Linux 2.5 era, and as we use it as 5
The original version of linetags is available at git://git.lwn.net/gitdm.git and was developed by Jonathan Corbet, LWN. We made a modified version (https://github.com/npalix/gitdm) to support Linux ver-sions prior to 2.6.12. This latter was applied on a Linux repository that aggregates linux-history and linux-2.6 thanks to a git graft point between commits 1da177e4c3f41524e886b7f1b8a0c1fc7321cac2 and e7e173af42dbf37b1d946f9ee00219cb3b2bea6a.
2004 2005 2006 2007 2008 2009 2010 2011 0 5 10 15 20
Percentage of Linux 3.0 lines
2.6.0 2.6.12 (git) 2.6.28 (staging)
Fig. 2. Distribution of the lines of code of Linux 3.0 by the Linux 2.6 version in which they were introduced
the starting point for the origin of lines. Most of the code that has remained unchanged since 2.6.0 comes from driver code for old hardware (drivers), old hardware platforms (arch) and old network protocols that no longer change (net), with respectively 65.6%, 18.8% and 12.2% of the Linux 2.6.0 code that is still present in Linux 3.0.
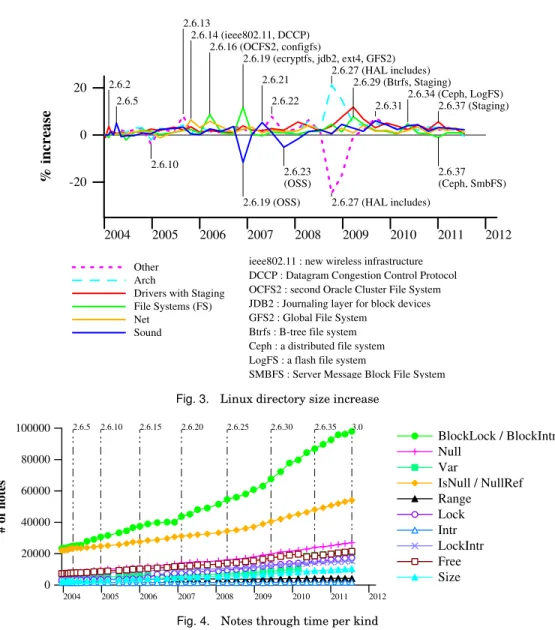
Figure 1 shows that, for most directories, the code growth has been roughly linear since Linux 1.0. Some exceptions are highlighted in Figure 3, which shows the per-centage code size increase in each directory from one version to the next. We have marked some of the larger increases and decreases. Many of the increases involve the introduction of new services (e.g., ieee802.11 for wireless support in version 2.6.14), and new file systems (e.g., the Btrfs filesystem in version 2.6.29). In Linux 2.6.19 and 2.6.23, old OSS drivers already supported by ALSA were removed from sound, decreasing its size. In Linux 2.6.27, arch was reorganized, and received some large header files from include, adding around 180,000 lines of C code. The most recent decrease is in the fs directory of Linux 2.6.37, where the Ceph distributed file system was reorganized and partly moved to the net directory. Another decrease, at the same time, is due to the Server Message Block File System (SMBFS), which is on its way out of the kernel, as it has been superseded by the Common Internet File System (CIFS). Finally, staging grew substantially in 2.6.29 and 2.6.37. All in all, these changes have resulted in code growth from 2 MLOC in 2001 to more than 9 MLOC in 2011.
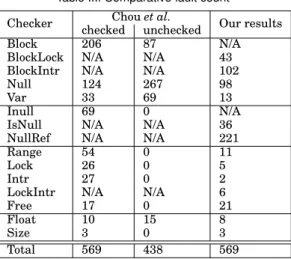
In our study, we are less interested in the absolute number of lines of code than the amount of code relevant to our fault kinds, i.e. notes. As shown in Figure 4, the increase in code size has induced an similar increase in the number of notes, as defined in Section 2.2, in almost all cases. In fact, across all of Linux 2.6, the number of notes per line of code is essentially constant, between 0.027 and 0.030 and the number of lines and
the number of notes are highly correlated: 0.998 by the Pearson’s correlation coefficient.6
4. FAULTS IN LINUX 2.4.1
Linux 2.4.1 was the latest version of Linux considered by Chou et al. [Chou et al. 2001]. To validate our experimental protocol, we have used our checkers to find faults and notes in this version, and we compare our results to those provided in their paper. We focus on the results that are specific to Linux 2.4.1, rather than those that relate to the history of Linux up to that point, to avoid the need to study earlier versions that are of little relevance today.
4.1. What code is analyzed?
For the results of fault finding tools to be comparable, the tools must be applied to the same code base. Chou et al. focus only on x86 code, finding that 70% of the Linux 2.4.1 code is devoted to drivers. Nevertheless, we do not know which drivers, file systems, 6This coefficient ranges from -1 to 1 inclusive, with 0 indicating that the two variables are not correlated, and
2004 2005 2006 2007 2008 2009 2010 2011 2012 -20 0 20 % increase Other Arch
Drivers with Staging File Systems (FS) Net Sound 2.6.2 2.6.5 2.6.10 2.6.13 2.6.14 (ieee802.11, DCCP) 2.6.16 (OCFS2, configfs) 2.6.19 (ecryptfs, jdb2, ext4, GFS2) 2.6.19 (OSS) 2.6.21 2.6.22 2.6.23 (OSS) 2.6.27 (HAL includes) 2.6.27 (HAL includes) 2.6.29 (Btrfs, Staging) 2.6.31 2.6.34 (Ceph, LogFS) 2.6.37 (Staging) 2.6.37 (Ceph, SmbFS)
ieee802.11 : new wireless infrastructure DCCP : Datagram Congestion Control Protocol OCFS2 : second Oracle Cluster File System JDB2 : Journaling layer for block devices GFS2 : Global File System
Btrfs : B-tree file system Ceph : a distributed file system LogFS : a flash file system
SMBFS : Server Message Block File System Fig. 3. Linux directory size increase
2004 2005 2006 2007 2008 2009 2010 2011 2012 0 20000 40000 60000 80000 100000 # of notes BlockLock / BlockIntr Null Var IsNull / NullRef Range Lock Intr LockIntr Free Size 2.6.5 2.6.10 2.6.15 2.6.20 2.6.25 2.6.30 2.6.35 3.0
Fig. 4. Notes through time per kind
etc. were included. To calibrate our results, we use SLOCCount to obtain the number of lines of ANSI C code in the Linux kernel and in the drivers directory, considering the three possibilities reported in Table II: all code in the Linux 2.4.1 kernel source tree (“All code”), the set of .c files compiled when using the default x86 configuration (“Min x86”),7and all 2.4.1 code except the arch and include subdirectories that are specific
to non-x86 architectures (“Max x86”). Max x86 gives a result that is closest to that of Chou et al., although the proportion of driver code is slightly higher than 70%. This is reasonable, because some driver code is associated with specific architectures and cannot be compiled for x86. Nevertheless, these results show that we do not know the precise set of files used in Chou et al.’s tests.
7
This configuration was automatically generated using make menuconfig without any modification to the proposed configu-ration. To collect the .c files, we compiled Linux 2.4.1 according to this configuration using a Debian 3.1 (Sarge) installation in a virtual machine, with gcc version 2.95.4 and make version 3.80.
Table II. Percentage of Linux code found in drivers calcu-lated according to various strategies
All code Min x86 Max x86 Drivers LOC 1,248,930 71,938 1,248,930 Total LOC 2,090,638 174,912 1,685,265
Drivers % 59% 41% 74%
In our experiments, we consider the entire kernel source code, and not just the code for x86, as every line of code can be assumed to be relevant to some user.
4.2. How many faults are there?
For the entire Linux 2.4.1 kernel, using the checkers described in Section 2.1, we obtain about 700 reports, of which we have determined that 569 represent faults and the remainder represent false positives. Chou et al.’s checkers find 1,025 faults in Linux 2.4.1. They have checked 602 of these reports; the remainder are derived from what they characterize as low false positive checkers. We have checked all of the reports included in our study.
Table III compares the number of faults found per checker. In most cases, we find fewer faults. This may be due to different definitions of the checkers, or different criteria used when identifying false positives. In the case of Var, we find fewer faults because we consider only cases where the size is explicitly expressed as a number. In a few cases, we find more faults. For example, Chou et al.’s Inull checker can be compared to our IsNull and NullRef checkers. We find fewer IsNull faults than their Inull faults, but far more NullRef faults. We also find slightly more Free faults. This may derive from considering a larger number of files, as we have found that only one of our Free faults occurs in a file that is compiled using the default x86 configuration. Results from Chou et al.’s checkers were available at a web site interface to a database, but Chou has informed us that this database is no longer available. Thus, it is not possible to determine the precise reasons for the observed differences.
Table III. Comparative fault count
Checker Chou et al. Our results checked unchecked
Block 206 87 N/A
BlockLock N/A N/A 43 BlockIntr N/A N/A 102
Null 124 267 98
Var 33 69 13
Inull 69 0 N/A
IsNull N/A N/A 36
NullRef N/A N/A 221
Range 54 0 11
Lock 26 0 5
Intr 27 0 2
LockIntr N/A N/A 6
Free 17 0 21
Float 10 15 8
Size 3 0 3
Total 569 438 569
4.3. Where are the faults?
In this section, the faults are classified using the same criterion as Chou et al., i.e., by subsystem and function size.
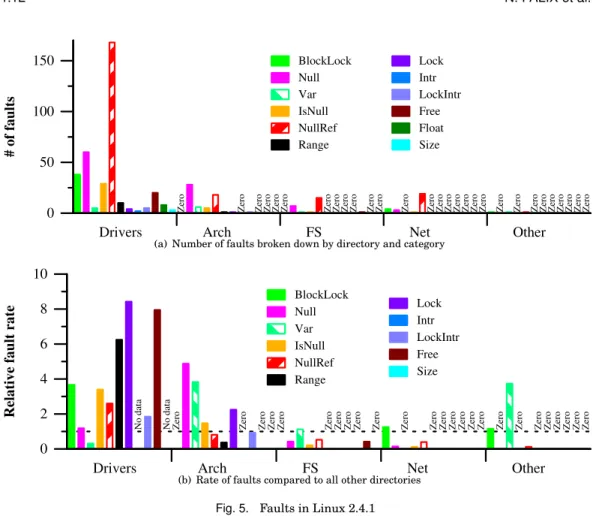
Drivers Arch FS Net Other 0 50 100 150 # of faults
Zero Zero Zero Zero Zero Zero Zero Zero Zero Zero Zero Zero Zero Zero Zero Zero Zero Zero Zero Zero Zero Zero Zero Zero Zero Zero Zero Zero Zero
BlockLock Null Var IsNull NullRef Range Lock Intr LockIntr Free Float Size
(a) Number of faults broken down by directory and category
Drivers Arch FS Net Other
0 2 4 6 8 10
Relative fault rate
No data No data Zero Zero Zero Zero Zero Zero Zero Zero Zero Zero Zero Zero Zero Zero Zero Zero Zero Zero Zero Zero Zero Zero Zero Zero Zero
BlockLock Null Var IsNull NullRef Range Lock Intr LockIntr Free Size
(b) Rate of faults compared to all other directories
Fig. 5. Faults in Linux 2.4.1
By subsystem. Chou et al. find that the largest number of faults is in the drivers
directory and that the largest number of these faults are in the categories Block, Null, and Inull, with around 180, 95, and 50 faults in drivers, respectively.8As shown in
Figure 5(a), we also observe that the largest number of faults is in the drivers directory, with the largest number of these faults also being in BlockLock, Null, and Inull (IsNull and NullRef), although in different proportions.
A widely cited result of Chou et al. is that the drivers directory contains almost 7 times as many of a certain kind of faults (Lock) as all other directories combined. They computed this ratio using the following formula for each directoryd, where d refers to the directoryd itself and d refers to all of the code in all other directories:
fault rated/fault rated
Figure 5(b) shows the values of the same formula, using our results. We obtain a similar ratio with a relative rate of over 8 for Lock in drivers, as compared to all other directories combined. We also find that the drivers directory has a rate of Free faults that is almost 8 times that of all other directories combined. Chou et al., however, found a fault rate of only around 1.75 times that of all other directories combined in this case. With both approaches, however, the absolute number of Free faults is rather small. Like Chou et al., we also observe a high fault rate in the arch directory for the Null 8
0 50 100
Function size in number of lines
0.0 0.5 1.0 % of faulty notes fns: 4419 min: 1 max: 17 faults: 28 fns: 4419 min: 17 max: 31 faults: 86 fns: 4420 min: 31 max: 61 faults: 146 fns: 4420 min: 61 max: 1286 faults: 301
(a) Functions with notes - 4 linear buckets (Chou et al.’s methodology)
0 100 200 300 400
Function size in number of lines
0.0 0.5 1.0 % of faulty notes fns: 9424 min: 1 max: 34 faults: 122 fns: 4716 min: 34 max: 72 faults: 186 fns: 2358 min: 72 max: 137 faults: 160 fns: 1180 min: 137 max: 1286 faults: 93
(b) Functions with notes - 4 logarithmic buckets
0 100 200 300 400
Function size in number of lines
0.0 0.5 1.0 % of faulty notes All functions Functions with notes fns: 28408 min: 1 max: 16 faults: 27 fns: 14192 min: 16 max: 36 faults: 103 fns: 7096 min: 36 max: 65 faults: 148 fns: 3548 min: 65 max: 106 faults: 131 fns: 1774 min: 106 max: 180 faults: 89 fns: 888 min: 180 max: 1286 faults: 63
(c) All functions and functions with notes - 6 logarithmic buckets
At each point, fns is the number of functions affected to the bucket, min, respectively max is the size of smallest, respectively largest, function of the bucket, and faults is the number of faults present in the functions assigned to the bucket.
Fig. 6. Fault rate by function size in 2.4.1
checker, in both cases about 4.8 times that of all other directories combined. Finally, unlike Chou et al., we observe a high rate of Var faults in both arch and other. In the arch case, all of the Var faults found are for architectures other than x86. Indeed, overall for arch, we find 60 faults, but only 3 (all Null) in the x86 directory.
By function size.Figure 6 shows the percentage of faulty notes according to the size
of the functions. Following Chou et al., we only consider functions with notes and divide these functions into 4 buckets, each containing the same number of functions. Like Chou et al., we find that the largest functions have the highest fault rate, as shown in Figure 6(a).
0 500 1000 1500 Function size 1 10 100 1000 10000 1 10 100 1000 10000 Number of functions
Fig. 7. Function size distribution
Linux, however, contains more small functions than large ones, as illustrated by Figure 7, which shows the distribution of the functions according to their size. Thus using same-sized buckets tends to group a wide range of larger functions into a single bucket. We thus decided to consider a logarithmic distribution of the functions into buckets, where the first bucket contains the smallest half of the functions, the next bucket contains the smallest half of the remaining functions, etc.9Using this logarithmic
bucketing strategy, Figure 6(b), shows that it is actually the functions of the third bucket, having between 72 and 137 lines, that have the highest fault rate, at 1.05, although the largest functions continue to have a higher fault rate, at 0.77, than the smallest ones, at 0.49.
To study the relation between function size and fault rate in more detail, Figure 6(c) increases the number of buckets to 6, and considers all functions, not just those with notes. The curve with only the functions containing notes is given with a dotted line for reference. The same trend as found in Figure 6(b) is observed for small, mid-size, and large functions. This bucketing strategy, however, indicates the probability of a fault based solely on the function size, which represents a simpler criterion. As the two curves of Figure 6(c) are almost identical, the two strategies can be considered equivalent. 4.4. How old are the faulty files?
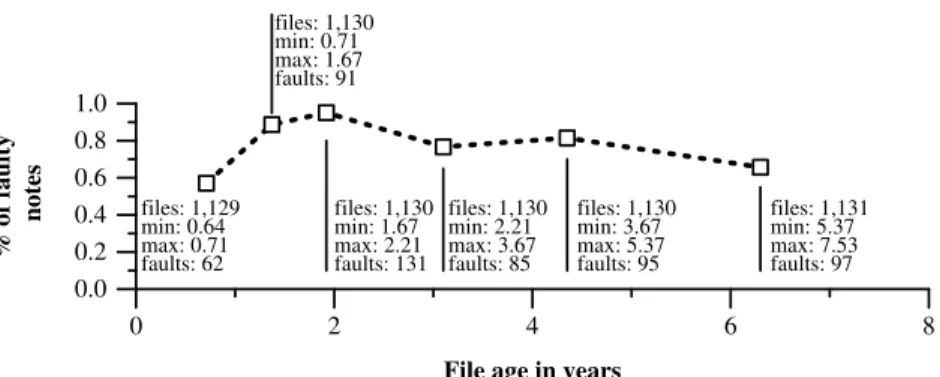
To explore the relation between the Linux 2.4.1 fault rate and file age, we first consider the distribution of files according to their age, as shown in Table IV. In Linux 2.4.1, there were few very recently added files; most of the files had been part of the Linux kernel for between 1 and 3 years. There is also an almost equal number of files for each of the numbers of years above 3. We thus decided to distribute the files equally among the buckets, as done by Chou et al., i.e. we first order the files according to their age and then assign each file to a bucket such that each bucket has almost the same number of files, as illustrated Figure 8. However, we again increase the number of buckets to 6, to emphasize the relation between the faults and the file age for the youngest files, without disturbing the observation of other files, either young or old.
Table IV. File age distribution for Linux 2.4.1
Age (in years) 0 1 2 3 4 5 6 7
Number of files 1330 1892 526 1217 541 627 325 322
Chou et al. find that younger files have a higher fault rate, of up to 3% for the Null checker. We also find fault rates of more than 3% for the Null checker in 4 out of 6 buckets, being the first three buckets and the last one. As illustrated by Figure 8, moderately young files (between 8 months and 26 months) have the highest fault rates, over 0.89%. However, the youngest files (under 8 months) have the lowest fault 9
0 2 4 6 8
File age in years
0.0 0.2 0.4 0.6 0.8 1.0 % of faulty
notes files: 1,129min: 0.64 max: 0.71 faults: 62 files: 1,130 min: 0.71 max: 1.67 faults: 91 files: 1,130 min: 1.67 max: 2.21 faults: 131 files: 1,130 min: 2.21 max: 3.67 faults: 85 files: 1,130 min: 3.67 max: 5.37 faults: 95 files: 1,131 min: 5.37 max: 7.53 faults: 97
At each point, files refers to the number of files considered to compute the point, min and max refer to the minimal or maximal age of the files in the bucket, and faults indicates the number of faults that occur in the bucket files.
Fig. 8. Fault rate by file age in 2.4.1
0 2 4 6 8 10
Number of faults per file
0 50 100 150 200 250
Number of files with n faults
Our experimental values θ = 0.562
θ = 0.567
faulty files = 338
faulty files = 243 (Chou et al.’s values)
Fig. 9. Comparison of the error distributions
rate, 0.57%. For files older than 2.5 years, we observe lower fault rates, above 0.82%. Interestingly, middle aged files, of about 3 years, and the oldest files, of over 5 years have a lower fault rate than files between 4 and 5 years old.
In conclusion, our methodology gives comparable results with Chou et al. about the relation of faults and the age of files. However, by using two more buckets, we have been able to emphasize particularities of the newest and oldest files.
4.5. How are faults distributed?
Chou et al. plot the numbers of faults against the percentage of files containing each number of faults and find that for all of the checkers except Block, the resulting curve fits a log series distribution, as determined byχ2 test, with aθ value of 0.567 and a
degree of confidence (p-value) of 0.79 (79%). We observe aθ value of 0.562 and a p-value of 0.234 without Block. We conjecture that this low p-value is due to the fact that two files have 5 and 6 faults while three files have 7 faults each; such an increase for larger values is not compatible with a log series distribution. Nevertheless, the values involved are very small, and, as shown in Figure 9, the curve obtained from our experimental results fits well with the curve obtained using the corresponding calculatedθ value. The curve obtained from Chou et al.’s value of θ is somewhat lower, because they found a smaller number of faulty files, probably due to having considered only the x86 architecture.
4.6. Assessment
In this section, we have seen that our checkers do not find the same number of faults in Linux 2.4.1 code as the checkers of Chou et al. We recall that Chou et al.’s checkers are not very precisely described, and thus we expect that most of the differences are in how the checkers are defined. Furthermore, we do not consider exactly the same set of files. Nevertheless, the distribution of these faults among the various directories is roughly comparable, and their distribution among the files is also comparable. We thus conclude that our checkers are sufficient to provide a basis for comparison between Linux 2.6 and the previous versions studied by Chou et al.
5. FAULTS IN LINUX 2.6
We now assess the extent to which the trends observed for Linux 2.4.1 and previous versions continue to apply in Linux 2.6, and study the points of difficulty in kernel development today. We consider what has been the impact of the increasing code size and the addition of new features on code quality, and whether drivers are still a major problem.
Concretely, we study a period of over 7 years, beginning with the release of Linux 2.6.0 at the end of 2003 and ending in July 2011 with the release of Linux 3.0. For the complete set of Linux 2.6 kernels and for Linux 3.0, using the checkers described in Section 2.1, we obtain 51,449 reports, resulting in 5,169 reports after correlation, of which we have manually determined that 3,146 represent faults and the rest represent false positives.
5.1. How many faults are there?
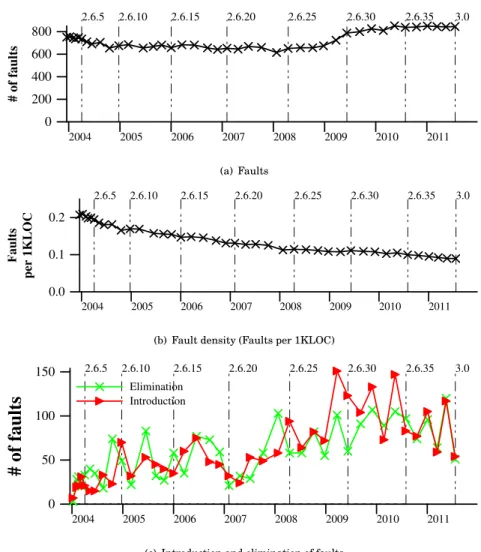
We first analyze the relation between the code growth and the total number of faults in Linux 2.6. As shown in Figure 10(a), the number of the faults considered has held roughly steady over this period, with an overall increase of only 12.5%. Indeed there was a decrease of 18% from 2.6.0 to the minimum value in the considered time period, which occured in 2.6.24. This latter decline is quite remarkable given that the code size increased by more than 50% during these 25 versions (Figure 1). However, since the minimum of 2.6.24, the number of faults has somewhat increased, including a jump of 17% between 2.6.28 and 2.6.30. As a result, we find in Linux 3.0 37% more faults than in 2.6.24, and 12.5% more than in 2.6.0. Still, due to the overall increase of 160% in code size from Linux 2.6.0 to Linux 3.0, the rate of faults per line of code has significantly decreased, by 57%, as shown in Figure 10(b), and for version 3.0, we find fewer than
90 faults per MLOC. These observations are quite different from those for versions
up through Linux 2.4.1: in those versions, there was a code size increase of over 17 times between Linux 1.0 and Linux 2.4.1 and an increase in the number of the faults considered of over 33 times [Chou et al. 2001]. Finally, Figure 10(c) reveals the reason for our observations about 2.6. Faults are still introduced, indeed at a growing rate, but in many versions even more faults are eliminated.
Figure 11 shows the number of each kind of fault found in Linux 2.6, separated for readability by their order of magnitude into those that have fewer than 100 faults at their maximum, shown in Figure 11(a), and the others, shown in Figure 11(b).
For many fault kinds, the number of faults is essentially constant over the considered
period.Three notable exceptions are Lock in Linux 2.6.16 and 2.6.17, Null in Linux
2.6.29 and 2.6.34, and Float in Linux 2.6.30, as shown in Figure 11. In Linux 2.6.16, the functions mutex_lock and mutex_unlock were introduced to replace mutex-like occurrences of the semaphore functions down and up. 9 of the 11 Lock faults introduced in Linux 2.6.16 and 23 of the 25 Lock faults introduced in Linux 2.6.17 were in the use of mutex_lock. In Linux 2.6.29, the btrfs file system was introduced, as seen in
2004 2005 2006 2007 2008 2009 2010 2011 0 200 400 600 800 # of faults 2.6.5 2.6.10 2.6.15 2.6.20 2.6.25 2.6.30 2.6.35 3.0 (a) Faults 2004 2005 2006 2007 2008 2009 2010 2011 0.0 0.1 0.2 Faults per 1KLOC 2.6.5 2.6.10 2.6.15 2.6.20 2.6.25 2.6.30 2.6.35 3.0
(b) Fault density (Faults per 1KLOC)
2004 2005 2006 2007 2008 2009 2010 2011 0 50 100 150
# of faults
Elimination Introduction 2.6.5 2.6.10 2.6.15 2.6.20 2.6.25 2.6.30 2.6.35 3.0(c) Introduction and elimination of faults
Fig. 10. Faults in Linux 2.6.0 to 3.0
Figure 3. 31 Null faults were added with this code. 7 more Null faults were added in drivers/staging, which more than tripled in size at this time. 31 other Null faults were also added in this version. Next, in Linux 2.6.30 there was a substantial increase in the number of Comedi drivers [Comedi 1999] in drivers/staging. All of the 21 Float faults introduced in this version were in two Comedi files. These faults are still present in Linux 3.0. Recall, however, that staging drivers are not included in Linux distributions. Finally, in Linux 2.6.34, 75 Null faults, out of 119, were introduced in the arch and fs directories.
In the IsNull category, the number of faults decreases across the studied period. Nevertheless two spikes in the last two years can be observed. Indeed, 22 faults were introduced between 2.6.28 and 2.6.34, of which 7 were introduced in 2.6.29. These faults were introduced almost entirely in drivers. In Linux 2.6.35, the number of faults dropped to only 8, but it quickly grew up to 19 faults in 3.0 through the introduction of 18 new faults (note that some faults were corrected at the same time, implying some fault turnover). In each version, the faults were introduced mainly in drivers. So,
2004 2005 2006 2007 2008 2009 2010 2011 0 20 40 60 # of faults BlockIntr Var IsNull Range Lock Intr LockIntr Free Float Size 2.6.5 2.6.10 2.6.15 2.6.20 2.6.25 2.6.30 2.6.35 3.0
(a) Fewer than 100 faults
2004 2005 2006 2007 2008 2009 2010 2011 0 100 200 300 400 # of faults BlockLock NullRef Null 2.6.5 2.6.10 2.6.15 2.6.20 2.6.25 2.6.30 2.6.35 3.0
(b) More than 100 faults (BlockLock, NullRef and Null)
Fig. 11. Faults through time
between 2.6.28 and 2.6.34, 40 IsNull faults were introduced, of which 10 were in the staging directory and 32 in other drivers.
As shown in Figure 12, the fault rate,i.e., the ratio of observed faults to the number
of notes, for the considered fault kinds confirms the increase in reliability (Float is
omitted, as described in Section 2.2). As the number of notes increases roughly with the size of the Linux kernel while the number of faults is relatively stable, the fault rate tends to decline. The main increases, in Lock and Null, are due to the introduction of mutex_lock and the btrfs file system, respectively, as mentioned previously.
5.2. Where are the faults?
The presence of a high rate of faults in a certain kind of code may indicate that this kind of code overall needs more attention. Indeed, Chou et al.’s work motivated
2004 2005 2006 2007 2008 2009 2010 2011 0.0 0.5 1.0 1.5 % of faulty notes Average BlockLock BlockIntr Null Var IsNull NullRef Range Lock Intr LockIntr Free Size 2.6.5 2.6.10 2.6.15 2.6.20 2.6.25 2.6.30 2.6.35 3.0
Fig. 12. Fault rate per fault kind
2004 2005 2006 2007 2008 2009 2010 2011 0 100 200 300 400 500
# of faults
Staging
Drivers
Sound
Arch
FS
Net
Other
2.6.5 2.6.10 2.6.15 2.6.20 2.6.25 2.6.30 2.6.35 3.0Fig. 13. Faults per directory
studies of many kinds of driver faults, going beyond the fault kinds they considered. Many properties of the Linux kernel have, however, changed since 2001, and so we reinvestigate what kind of code has the highest rate of faults, to determine whether attention should now be placed elsewhere.
As shown in Figure 13, the largest number of faults is still in drivers, which indeed makes up over half of the Linux kernel source code. The second-largest number of faults is in arch, accompanied by fs and drivers/staging in recent versions. In contrast to the case of Linux 2.4.1, however, as shown in Figure 14, drivers no longer has the largest fault rate, and indeed since Linux 2.6.19 its fault rate has been right at the average. There was not a large increase in the number of drivers notes at that time, so this decrease is indicative of the amount of attention drivers receive in the peer reviewing process. Arch on the other hand has many faults and relatively little code, and so it has the highest fault rate throughout most of Linux 2.6. Around 30% of the arch faults are Null faults, although there appears to be no pattern to their introduction. Over 90% of the arch faults are outside of the x86/i386 directories, with many of these faults being in the ppc and powerpc code.
2004 2005 2006 2007 2008 2009 2010 2011 0.0 0.2 0.4 0.6 0.8
% of faulty notes
Average
Staging
Drivers
Sound
Arch
FS
Net
Other
2.6.5 2.6.10 2.6.15 2.6.20 2.6.25 2.6.30 2.6.35 3.0Fig. 14. Fault rate per directory
The largest numbers of faults in fs are in cifs, ocfs2 and btrfs. For the cifs filesystem, there are over 40 faults in Linux 2.6.0. But the number of faults suddenly drops from 52 to 16 between 2.6.11 and 2.6.12 and only two such faults remain in 3.0. For the ocfs2 filesystem, there are 10-14 faults per version starting in Linux 2.6.16 until the versions 2.6.39 and 3.0, where there are respectively only 4 and 5 faults remaining. For the btrfs filesystem, there are respectively 36 and 38 faults in Linux 2.6.29 and 2.6.30. Again, there are respectively only 8 and 6 faults in the two last versions. All of these faults are in recently introduced file systems: cifs was introduced in Linux 2.5.42, ocfs2 in Linux 2.6.16, and btrfs in Linux 2.6.29.
Drivers/staging, introduced in Linux 2.6.28, also has a high fault rate, exceeding that of arch. This directory is thus receiving drivers that are not yet mature, as in-tended. The introduction of drivers/staging, however, has no impact on the fault rate of drivers, as drivers/staging accommodates drivers that would not otherwise be accepted into the Linux kernel source tree. Such drivers benefit from the expertise of the Linux maintainers, and are updated according to API changes with the rest of the kernel.
For Linux 2.4.1, we observed that drivers had a much higher fault rate for certain kinds of faults than other directories. Figure 15 shows the comparison of fault rates for Linux 3.0. It is more common that drivers/staging, arch, or other has the highest fault rate, indicating that the drivers that are intended for use in the Linux kernel are
no longer the main source of faults.Indeed, there are about 11 times more faulty notes
in drivers/staging than in all other directories. The maximum for arch and other is respectively 9 for BlockIntr, and 10 for LockIntr. In comparison, drivers has 2.3 more faulty BlockLock notes than all other directories in Linux 3.0. This worst case of the drivers directory is more than 4 times smaller than the three other maximum values mentioned above.
For staging, dereference of a NULL pointer (IsNULL) and missing memory frees (Free) are the most common errors, with respectively 8 and 11 times more errors in staging than in the rest of the kernel. For arch, the highest ratio is for BlockIntr which is 9 times higher than in the rest of the kernel. Arch has also high ratios for Null, Var and LockIntr, with a factor of 4 in these cases. In the case of fs, the most problematic point is Lock with a ratio of 3.2. Sound and net have the smallest fault rates. In a preliminary version of this work, we compared fault rates between directories in Linux 2.6.33 (Figure 11 of [Palix et al. 2011]). The two highest rates for sound found
Staging Drivers Sound Arch FS Net Other 0 2 4 6 8 10
Zero Zero Zero Zero Zero Zero Zero Zero Zero Zero No data Zero Zero Zero Zero Zero Zero Zero Zero Zero Zero Zero Zero Zero Zero Zero Zero Zero Zero Zero Zero Zero Zero Zero Zero No data
BlockLock BlockIntr Null Var IsNull NullRef Range Lock Intr LockIntr Free Size
Fig. 15. Fault rates compared to all other directories (Linux 3.0)
2004 2005 2006 2007 2008 2009 2010 2011
1 2
Average faults per faulty file
Staging Drivers Sound Arch FS Net Other 2.6.5 2.6.10 2.6.15 2.6.20 2.6.25 2.6.30 2.6.35 3.0
Fig. 16. Faults per faulty file per directory
in that study are no longer visible in the results for Linux 3.0, indicating the sound has improved compared to the other directories.
Finally, in Figure 16, we consider the number of faults per file containing at least one fault. The highest average number of faults per faulty file is for fs in the versions prior to 2.6.12, at 2.8 faults. In this case, there was a single file with many NullRef faults, as many as 45 in Linux 2.6.11. In later versions, the highest average is for drivers/staging, for which the average was over 2 in Linux 2.6.30. At that point, a large number of drivers had recently been introduced in this directory. Many of these faults have been corrected and the rate of entry of new drivers has slowed, and thus the average has dropped to around 1.5, close to that of other directories. Sound had a relatively high number of faults per faulty file starting in Linux 2.6.16 with the introduction of mutex_lock; faulty functions often contain more than one mutex_lock, and thus a single omitted mutex_unlock may result in multiple Lock reports.
5.3. How long do faults live?
Eliminating a fault in Linux code is a three step process. First, the fault must be detected, either manually or using a tool. Then, it must be corrected, and a patch submitted to the appropriate maintainers. Then, the patch must be accepted by a hierarchy of maintainers, ending with Linus Torvalds. Finally, there is a delay of up to 3 months until the next release. It has thus been found that most patches are integrated
within 3-6 months [Jiang et al. 2013] into a Linux release, i.e. it takes one or two releases to integrate patches. The lifespan of a fault, modulo this three/six-month delay, is an indication of the efficiency of the fault-elimination process.
Fault survival analysis.A challenge in measuring the lifetime of faults present within
a time period is that some faults may have been introduced before the time period began, while others may last after the time period ends. In this section, we consider the probability that a fault, that is observed at least once between Linux 2.6.0 and Linux 3.0, reaches a certain age. A fault that was introduced before the considered time period (i.e. before Linux 2.6.0) is said to have its lifetime left censored, while a fault that persists after the considered time period (i.e. after Linux 3.0) is said to have its lifetime right censored. The problem of censoring is addressed by a survival analysis with the Kaplan-Meier estimator [Kaplan and Meier 1958]. Survival analysis gives the probability that an observation (e.g., the death age of faults) reaches a given value. The Kaplan-Meier estimator corrects the bias introduced by the partial observations (i.e., the observations of faults where only a lower bound of the age is known because either the fault introduction or the fault removal was unobserved), making the computed average lifespan unbiased as compared to the average lifespan of the raw observations. To refine the estimator, the approach allows approximating partial observations by an interval. For complete observations, the exact value of the fault age at death is used.
To handle the censored data of Linux 2.6.0, as we did not know the exact lifespan of the faults, we bound the lifespan by an interval and thus set a lower-bound and an upper-bound on the lifespan of the Linux 2.6.0 faults. The lower-bound is always the observed lifespan, i.e., we assume that the fault was introduced where we first observe it, in Linux 2.6.0. For the upper-bound, we considered three alternatives: 1) minimize the upper bound by setting it equal to the lower-bound (all Linux 2.6.0 faults are new), 2) maximize the upper bound by extending the lifespan up to Linux 1.0 and 3) set the upper bound by extending the lifespan up to the median point between Linux 1.0 and Linux 2.6.0, which is in January 1999, near the release of Linux 2.2.0.
Figure 17 reports the survival analysis of faults, computed with R [R Core Team 2014a], according to four configurations: first, ignoring the faults of Linux 2.6.0 and then each of the three alternatives mentioned above. The first configuration, illustrated in black at the bottom left, only considers the faults introduced after Linux 2.6.0, as they are at worst only right-censored. The second one, the solid green line in the middle, considers that all Linux 2.6.0 faults are new, and thus gives the lower bound of 0 as the estimation. The third one, in red at the top, considers that the Linux 2.6.0 faults may have been introduced in Linux 1.0, and thus gives the upper bound of the estimation. Finally, the fourth one, in dotted black in the middle, gives a median estimation where the Linux 2.6.0 faults may have been introduced at any time between January 1999 and December 2003 (Linux 2.6.0). This may extend the lifespan of the faults of Linux 2.6.0 by up to five years with respect to the observed lifespan.
The faults considered in the first configuration have an average lifespan of 2.3 years ± 22 days, and a median lifespan of 1.3 years. As shown in Figure 17, this is the lowest lifespan observed. The faults, for which the birth is observed, are thus fixed quicker than the set of all the faults, i.e., the set that includes the faults already present in Linux 2.6.0 (as considered in the remaining configurations). For the second and third configurations, respectively the min and max strategies, the average lifespan ranges from 2.4 to 3.7 years, and the median lifespan from 1.5 to 2.2 years. The strategy for left-censoring thus has an impact of up to about 1 year. For the median estimation (fourth configuration), the average lifespan of a fault is 2.9 years ± 19 days, and the median lifespan is 2.1 years. This strategy affects the average lifespan more than the
0 1 2 3 4 5 6 7 8 9 10 0.0 0.2 0.4 0.6 0.8 1.0 Years Sur viv al r ate Max Median Min No 2.6.0
Fig. 17. Kaplan-Meier survival analysis of a fault
0 1 2 3 4 5 6 7 8 0.0 0.2 0.4 0.6 0.8 1.0 Years Sur viv al r ate 1st half 2nd half
Fig. 18. Kaplan-Meier survival analysis comparison
median lifespan. We can thus conclude that the average lifespan is about between 2.5 and 3.0 years and the median lifespan is about 2 years.
Figure 18 compares the lifespans of faults introduced in the first half of the versions (with the first configuration, i.e. ignoring the Linux 2.6.0 faults) with the lifespans of faults introduced in the last half of the versions. We observe an average lifespan of 2.41 years and 2.60 years, for respectively the first and the last half of the versions. These results show that the average lifespan has increased. However, the median lifespan has decreased from 1.56 to 1.00 years.
In Figures 17 and 18, each cross corresponds to a right-censored fault. The 0.95 confidence band is given as a pair of dotted lines in Figure 17, for the upper-bound estimation. This band is rather tight and is similar for all of the curves (not shown for the sake of clarity).
Lifespan per directory and fault kind. Figure 19 presents the average lifespan of faults
across Linux 2.6, by directory and by fault kind. We omit drivers/staging because it was only introduced recently. The lifespan averages are reported by the Kaplan-Meier estimator with the median strategy.
Drivers Sound Arch FS Net Other 0 1 2 3 4 5 Years
(a) Per directory
0 1 2 3 4 5 Years Find Fix Impact Easy Easy Low Easy Easy High Easy Hard Low Easy Hard High Hard Easy High Hard Hard Low Var IsNull Range Lock Intr
LockIntr NullRef Float Free
BlockLock Null
(b) Per finding and fixing difficulty, and impact likelihood
Fig. 19. Average fault lifespans (without staging)
The average fault lifespan across all files of Linux 2.6 is 2.93 years, as indicated by the horizontal dotted line in Figure 19. The lifespans vary somewhat by directory. As shown in Figure 19(a), the average lifespan of faults in the drivers directory is the same as the average lifespan of all faults, and indeed is less than the average lifespan of faults in the sound directory. Sound faults now have the longest average lifespan. Sound used to be part of drivers; it may be that the sound drivers are no longer benefiting from the attention that other drivers receive. In Figure 14 of Section 5.2 (page 20), we showed that the fault rates of fs and arch are now worse than that of drivers. Here, we find similarly that faults in arch have a longer lifespan than faults in drivers. However, the faults in fs have the second smallest lifespan.
For the fault kinds, Figure 19(b) shows that the average lifespans correspond roughly to our assessment of the difficulty of finding and fixing the faults and their likelihood of impact (Table I). In particular, all of the fault kinds we have designated as having high impact, meaning that the fault is likely to have an observable effect if the containing function is executed, have the lowest average lifespans. Moreover, among the high impact faults, the ones that are easily fixed have the lowest average lifespans. On the
other hand, the ease of finding the faults has little impact on their lifespan, showing
that developers are willing to invest in tracking down any faults that cause obvious problems, and are prone to quickly accept simple fixes.
0 2 4 6 8 Years 0 1000 2000 3000 Cumulative number of faults fixed All faults 80 % of all faults 50 % of all faults Staging Drivers 50 % of drivers Sound Arch FS Net Other
(a) Cumulative number
0 2 4 6 8 Years 0 20 40 60 80 100
Percentage of faults fixed
All faults 80 % of faults 50 % of faults Staging Drivers Sound Arch FS Net Other (b) Percentage
Fig. 20. Fixed faults per amount of elapsed time
Figure 20 examines fault lifespans in more detail, by showing the number of faults (Figure 20(a)) and the percentage of faults (Figure 20(b)) that have been fixed in less than each amount of time. In these figures, we include the faults already present in Linux 2.6.0 and the faults still remaining in Linux 3.0. Staging is also added back to compare it with the other directories, but as it was introduced only two and a half years before 3.0, no staging fault can have a lifetime longer than 2.5 years. If we consider all of the faults, half of them were fixed within just above one year, but it took about 3 years to fix 80% of them. This global trend is observed for almost all of the directories. Indeed, half of the faults were fixed in around one year for each subsystem, except sound where 2.5 years were required to fix half of the faults. In 2010, we did a similar study, reported in a preliminary version of this paper [Palix et al. 2011], and found for staging that half of the faults were fixed within 6 months. We now observe that the time is almost 8 months. These drivers may thus have lost the attention of code reviewers as compared to the time at which staging was created.
Origin of faults. Figure 21 shows the lifetime of each of the faults found in our study.10
The faults are ordered by birth date, with faults of Linux 2.6.0 at the bottom of the graph and new faults of Linux 3.0 at the top. For each version, the faults are further ordered by their death age. The 751 faults in Linux 2.6.0 are marked as introduced at that point, even though they may have been introduced earlier. Of the faults introduced and eliminated within the period considered, 35% of the faults introduced in or after Linux 2.6.0 were introduced with the file and 12% of the faults eliminated before Linux
10