Publisher’s version / Version de l'éditeur:
Vous avez des questions? Nous pouvons vous aider. Pour communiquer directement avec un auteur, consultez la première page de la revue dans laquelle son article a été publié afin de trouver ses coordonnées. Si vous n’arrivez pas à les repérer, communiquez avec nous à PublicationsArchive-ArchivesPublications@nrc-cnrc.gc.ca.
Questions? Contact the NRC Publications Archive team at
PublicationsArchive-ArchivesPublications@nrc-cnrc.gc.ca. If you wish to email the authors directly, please see the first page of the publication for their contact information.
https://publications-cnrc.canada.ca/fra/droits
L’accès à ce site Web et l’utilisation de son contenu sont assujettis aux conditions présentées dans le site LISEZ CES CONDITIONS ATTENTIVEMENT AVANT D’UTILISER CE SITE WEB.
Laboratory Technical Report (National Research Council of Canada. Aerospace. Aerodynamics Laboratory); no. LTR-AL-2020-0053, 2020-03-31
READ THESE TERMS AND CONDITIONS CAREFULLY BEFORE USING THIS WEBSITE. https://nrc-publications.canada.ca/eng/copyright
NRC Publications Archive Record / Notice des Archives des publications du CNRC :
https://nrc-publications.canada.ca/eng/view/object/?id=148ae376-0898-402e-b0eb-a5407195ed48 https://publications-cnrc.canada.ca/fra/voir/objet/?id=148ae376-0898-402e-b0eb-a5407195ed48 For the publisher’s version, please access the DOI link below./ Pour consulter la version de l’éditeur, utilisez le lien DOI ci-dessous.
https://doi.org/10.4224/40002002
Access and use of this website and the material on it are subject to the Terms and Conditions set forth at Investigation of tolerance for icing of small UAV rotors/propellers - Phase 2
Aerospace Research Centre
Aerodynamics Laboratory
Investigation of Tolerance for Icing of
Small UAV Rotors/Propellers – Phase 2
Ali Benmeddour
March 31, 2020
Classification: Unclassified NRC-CNRC
Distribution: Unlimited Page 2 of 47
AERODYNAMICS LABORATORY
Investigation of Tolerance for Icing of Small UAV Rotors/Propellers – Phase 2
Volume 1
Report No.: LTR-AL-2020-0053 Date: March 31, 2020
Author: Ali Benmeddour
Classificatio
n : Unclassified Distribution: Unlimited
For: Carlos Ruella, Transport Canada – RPAS Task Force Engineering SIGMA ID#: A1- 014440
Submitted
by: Dr. Michael Benner, Director R&D, Aerodynamics Laboratory Approved
by: Dr. Ibrahim Yimer, Director General, Aerospace Research Centre
Pages : 47 Copy No : 1
Fig. : 32 Diagrams : 0
This report may not be published wholly or in part without the written consent of the National Research Council of Canada.
Classification: Unclassified NRC-CNRC
Distribution: Unlimited Page 3 of 47
EXECUTIVE SUMMARY
This report presents the achievements of Phase 2 of the NRC-Transport Canada (TC) collaboration on the experimental investigation of tolerance for icing of small-size propellers used to power small Unmanned Aerial Systems (sUAS). Since data on icing of these propellers at high rotational speeds (RPMs) are scarce, the main objective of the study is to characterize icing of small propellers at high RPMs and provide TC with scientific data to support the development of a safe and commercially viable regulatory framework for UAS operations in Canada. This research activity is conducted as part of Transport Canada’s efforts to create an evidence-based regulatory framework for safe drone operations.
The major achievements of Phase 2 of the NRC-TC collaboration are summarized below.
Development of a wind tunnel testing capability at NRC, including a test rig, to study icing of sUAS propellers at high RPM.
Investigation of the impact of icing on the performance of sUAS propellers: three propellers, 10, 12 and 14 in diameter, and two different blade materials (carbon fiber and glass fiber-reinforced plastic) were considered for testing at a nominal rotational speed of 8000 RPM. A limited number of tests were also conducted at an RPM of 9000. Targeted icing tests were conducted in the NRC altitude icing wind tunnel at an air speed of 15 m/s and a range of icing conditions. The icing conditions were set by varying the water droplet size (MVD – median volume diameter), the liquid water content (LWC) and the static air temperature (SAT). In an attempt to understand the icing of multirotor sUAS in forward flight, a number of tests were performed at an angle of sideslip of 30°.
Establishment of a baseline database of icing data for small UAS propellers operating at high RPM.
Provision of the required scientific data to TC to support the development of a regulatory framework for safe UAS operations in Canada.
Classification: Unclassified NRC-CNRC
Distribution: Unlimited Page 4 of 47
TABLE OF CONTENTS
1 INTRODUCTION ... 7
2 OBJECTIVES ... 8
3 TEST FACILITY – NRC ALTITUDE ICING WIND TUNNEL ... 8
3.1 Facility Description ... 8
3.2 Icing Spray System ... 9
4 TEST RIG ... 9
4.1 Dynamometer – Thrust Stand ... 9
4.2 Containment Nacelle and Mounting System ... 10
4.3 Propellers ... 12
5 TEST PLAN ... 13
5.1 Nominal Air Speed and RPM ... 14
5.2 Water Droplet Distribution ... 15
6 RESULTS AND DISCUSSION ... 17
6.1 Effect of MVD on Carbon Fiber Propellers ... 17
6.2 Effect of LWC on Carbon Fiber Propellers ... 24
6.3 Effect of SAT on Carbon Fiber Propellers ... 29
6.4 Effect of Increase in RPM ... 34
6.5 Effect of Angle of Sideslip... 37
6.6 Effect of Blade Material ... 40
7 CONCLUSIONS AND RECOMMENDATIONS ... 43
8 ACKNOWLEGMENTS ... 43
9 REFERENCES ... 44
Appendix A – Detailed test matrix ... 45
LIST OF FIGURES Figure 1 Schematic of the NRC’s AIWT facility... 9
Figure 2 RCBenchmark Series 1580 Dynamometer ... 10
Figure 3 Test rig - containment nacelle and support system ... 11
Figure 4 Test rig assembly in the NRC AIWT ... 12
Figure 5 Propellers tested in the NRC AIWT ... 13
Figure 6 Nominal air speed and RPM ... 15
Figure 7 Ice collection grid ... 15
Figure 8 Grid ice collection without (upper image) and with (lower image) propeller ... 16 Figure 9 MVD effect on time histories of thrust (left) and torque (right) of the three CF propellers, RPM =
Classification: Unclassified NRC-CNRC
Distribution: Unlimited Page 5 of 47
8000, SAT = -12°C, LWC = 0.5 g/m3 ... 20
Figure 10 MVD effect on time histories of electrical power of the three CF propellers, RPM = 8000, SAT = -12°C, LWC = 0.5 g/m3 ... 21
Figure 11 MVD effect on normalized thrust of the three CF propellers, SAT = -12°C, MVD = 60 μm, LWC = 0.5 g/m3 ... 21
Figure 12 MVD effect on ice accretion of the three CF propellers, RPM = 8000, SAT = -12°C, LWC = 0.5 g/m3 ... 22
Figure 13 MVD effect on ice accretion along the leading edge of the three CF propeller blades, RPM = 8000, SAT = -12°C, LWC = 0.5 g/m3 ... 23
Figure 14 LWC effect on time histories of thrust (left) and torque (right) of the three CF propellers, RPM = 8000, SAT = -12°C, MVD = 20 μm ... 25 Figure 15 LWC effect on the time histories of electrical power of the three CF propellers, RPM = 8000, SAT = -12°C, MVD = 20 μm ... 26 Figure 16 LWC effect on normalized thrust of the three CF propellers, SAT = -12°C, MVD = 20 μm, LWC = 1.0 g/m3 ... 26
Figure 17 LWC effect on ice accretion of the three CF propellers, RPM = 8000, SAT = -12°C, MVD = 20 μm ... 27 Figure 18 LWC effect on ice accretion along the leading edge of the three CF propeller blades, RPM = 8000, SAT = -12°C, MVD = 20 μm ... 28 Figure 19 LWC effect on time histories of thrust (left) and torque (right) of the three CF propellers, RPM = 8000, MVD = 20 μm, LWC = 0.5 g/m3 ... 31
Figure 20 SAT effect on the time histories of electrical power of the three CF propellers, RPM = 8000, MVD = 20 μm, LWC = 0.5 g/m3 ... 32
Figure 21 Vibration due to ice shedding, Figure 22 SAT effect on normalized thrust ... 32 Figure 23 SAT effect on ice accretion of the three CF propellers, RPM = 8000, MVD = 20 μm, LWC = 0.5 g/m3 ... 33
Figure 24 Effect of increased RPM (= 9000) on time histories of thrust, torque and electrical power for Prop21, AOS = 0°, MVD = 20 μm ... 35 Figure 25 Effect of increased RPM (= 9000) on normalized thrust of Prop21 (12×6), AOS = 0°, SAT = -12°C, MVD = 20 μm, LWC = 1.0 g/m3 ... 36
Figure 26 Effect of increased RPM (= 9000) on ice accretion of Prop21 (12×6), AOS = 0° ... 36 Figure 27 AOS (30°) effect on time histories of thrust, torque and electrical power Prop21, RPM = 8000, MVD = 20 μm ... 38 Figure 28 AOS effect on normalized thrust of Prop21 (12x6), RPM = 8000, SAT = -12°C, MVD = 20 μm, LWC = 1.0 g/m3 ... 39
Figure 29 AOS (30°) effect on ice accretion of Prop21 (12x6), RPM = 8000 ... 39 Figure 30 Blade material (GFR) effect on time histories of thrust, torque and electrical power of Prop22, RPM = 8000, AOS = 0°, MVD = 20 μm ... 41 Figure 31 Blade material effect on normalized thrust, AOS = 0°, RPM = 8000, SAT = -12°C, MVD = 20 μm, LWC = 1.0 g/m3 ... 41
Classification: Unclassified NRC-CNRC
Distribution: Unlimited Page 6 of 47
LIST OF TABLES
Table 1 RCbenchmark Series 1580 Dynamometer design specifications... 10
Table 2 Propeller specifications ... 13
Table 3 Nominal test conditions ... 14
Table 4 Overall test plan ... 14
Table 5 Thickness of grid collected ice, in mm, at the grid measurement locations ... 17
Table 6 Accreted ice mass, RPM = 8000, SAT = -12°C, LWC = 0.5 g/m3, MVD = 60 μm ... 19
Table 7 Accreted ice mass, RPM = 8000, SAT = -12°C, LWC = 1.0 g/m3, MVD = 20 μm ... 25
LIST OF ACRONYMS/ABREVIATIONS
AIWT Altitude icing wind tunnel AOS Angle of sideslip (degrees)
CF Carbon fiber
CFR Code of Federal Regulations
eRPM Electrical RPM
ESC Electronic speed controller FAA Federal Aviation Administration
FY Fiscal year
G Gravitational acceleration (m/s2) GFR Glass fiber reinforced
LTR Laboratory technical report LWC Liquid water content (g/m3) MVD Median volume diameter (m)
NACA National Advisory Committee of Aeronautics NRC National Research Council Canada
RPM/rpm Rotation per minute SAT Static air temperature (°C)
S. L. Sea level
TAS True air speed (m/s) UAS Unmanned aerial system RPAS Remotely piloted aerial system
Classification: Unclassified NRC-CNRC
Distribution: Unlimited Page 7 of 47
1 INTRODUCTION
In fiscal year (FY) 2018-2019, the National Research Council Canada (NRC), in collaboration with Transport Canada (TC), undertook a R&D activity to study the icing phenomenon of small-size propellers at high rotational speeds (rotations per minute – RPM). These propellers are used to power small (< 25 kg) Unmanned Aerial Systems (sUAS). The NRC-TC collaboration is part of the TC’s remotely piloted aerial systems (RPAS) task force engineering effort to create an evidence-based regulatory framework for safe UAS operations in the Canadian air space.
The main objective of the collaborative R&D activity is to characterize icing of small-size propellers rotating at high RPM and investigate their tolerance to icing. To this end, the experimental study was conducted in two phases. During Phase 1 (FY 18/19) of the study, a literature review was completed and the necessary parts (dynamometer, electric motor, electronic speed controller (ESC) and propellers) to build a test rig for wind tunnel testing were acquired. The test rig was then set up and calibrated, and a series of shakedown static tests were also conducted to ensure proper functioning of the dynamometer/propeller assembly. The findings of the literature review and the setup of the test rig were summarized in an NRC laboratory technical report (LTR) [1].
The focus of Phase 2 (FY 19/20) of the study was to conduct wind tunnel tests and obtain and analyze the data. During Phase 2 of the project, the following tasks were accomplished:
Upgrade of the test rig with a nacelle to protect the electric motor and the other electronic parts during testing in the NRC icing facility. The nacelle also acts as a containment for the dynamometer parts in case of a breakdown during operation. The test rig was also equipped with a mounting system to install the test rig assembly in the test section of the icing wind tunnel.
Test program in the NRC Altitude Icing Wind Tunnel (AIWT), where four small-size propellers, rotating at high RPM, were tested under various icing conditions to understand how ice builds up on the propeller blades and how ice accretion impacts the performance of the tested propellers.
This report describes the wind tunnel testing capability that was built at NRC to test the small UAS propellers as well as the icing test program that was conducted in the NRC AIWT. The report also presents the results of the experimental investigation, along with data analysis and some concluding remarks and recommendations for additional wind tunnel testing and further investigation to complement the set of data obtained during Phase 2.
Classification: Unclassified NRC-CNRC
Distribution: Unlimited Page 8 of 47
2 OBJECTIVES
Phase 2 of the NRC-TC collaboration concerns the actual wind tunnel testing of the UAS propellers in the NRC AIWT facility. The specific objectives of Phase 2 are:
Calibrate and adapt the test rig for testing in the NRC AIWT facility
Conduct targeted icing tests in the NRC AIWT facility at various icing conditions to characterize icing of small UAS propellers at high RPM
Assess the icing impact on the performance of the tested small UAS propellers and their tolerance to icing using the data obtained in the NRC AIWT
Establish a baseline database of icing data for icing of small UAS propellers at high RPM
3 TEST FACILITY – NRC ALTITUDE ICING WIND TUNNEL
3.1 Facility Description
A schematic of the NRC AIWT icing facility is depicted in Figure 1. It is a refrigerated closed-loop low-speed facility oriented in the vertical plane. Being refrigerated, this facility can be used any time of the year to conduct icing tests in accordance with the icing conditions of Appendix C to Part 25 of the #14 Code of Federal Regulations of the Federal Aviation Administration (FAA 14 CFR Appendix C to Part 25 [2]).
The standard test section in the AIWT is 0.57 m × 0.57 m × 1.83 m (width × height × length), and has controlled airspeeds from 5 to 100 m/s. An insert can reduce the test section width to 0.52 m and height to 0.33 m to achieve airspeeds up to 180 m/s. The tunnel airspeed is calculated through the use of total temperature and total pressure sensors located upstream of the spray bars in the settling chamber, as well as a ring of static pressure ports located upstream of the AIWT test section.
The air temperature in the AIWT is controlled by varying the amount of the refrigerant passing through a heat exchanger located in the tunnel circuit; achievable static air temperatures (SAT) at a Mach number of 0.3 range from -40C to +30C. A vacuum pump can be used to evacuate air from the wind tunnel circuit, lowering the pressure and creating simulated flight altitudes up to 12,200 m (40,000 ft). More technical details and specifications of the NRC icing facility can be found in [3].
Classification: Unclassified NRC-CNRC
Distribution: Unlimited Page 9 of 47
Figure 1 Schematic of the NRC’s AIWT facility
3.2 Icing Spray System
The icing spray system combines the outputs from air-supply and water-supply sub-systems through the use of individual air lines to each spray bar and individual water lines to each spray nozzle. The spray nozzles are mounted on the icing spray bars, which are located in the tunnel’s settling chamber, downstream of the flow straightening honeycombs and turbulence reducing screens. There are six horizontal spray bars spaced evenly over the settling chamber height. The spray system is monitored and controlled by the wind tunnel control system.
A still provides distilled water to a heated water reservoir. This water is then pumped to a spray bar header using a varia4ble-frequency motor drive to maintain constant water pressure. The water supply line for each spray bar includes a flow controller to permit equalizing of the water flow for all of the spray bars. The total water flow to the spray bar system is monitored using a Coriolis mass flow meter. A computer-controlled air-pressure regulator controls the air pressure to the spray bar air header. Both the total water flow and the total air flow through the systems are monitored using Coriolis mass flow meters.
4 TEST RIG
4.1 Dynamometer – Thrust Stand
The test rig consists of an RCBenchmark (Tyto Robotics Inc.) [4] Series 1580 Dynamometer, a Turnigy Aerodrive SK3-5055-380KV brushless outrunner electric motor and a Turnigy dlux 60A HV brushless electronic speed controller (ESC). The RCBenchmark Series 1580 Dynamometer is shown in Figure 2 and its design specifications are provided in Table 1. The dynamometer is equipped with load cells to measure torque and thrust directly, and accelerometers to measure directly the accelerations due to vibration. It also provides direct measurements of voltage, current, RPM, and motor winding resistance.
Classification: Unclassified NRC-CNRC
Distribution: Unlimited Page 10 of 47
Figure 2 RCBenchmark [4] Series 1580 Dynamometer (with propeller installed) Table 1 RCbenchmark Series 1580 Dynamometer design specifications
Specification Min. Max. Tolerance Unit
Thrust -5 5 0.5% kgf
Torque -1.5 1.5 0.5% Nm
Voltage 0 35 0.5% V
Current 0 40 1% A
Angular speed* 0 190k 1 eRPM
Coil resistance 0.003 240 0.5% Ohm
Digital scale 0 3 0.5% kgf
*Electrical RPM, divide by the number of motor poles to obtain true mechanical RPM.
4.2 Containment Nacelle and Mounting System
To protect the electric motor, ESC, and other electronic parts from the icing/wet environment of the AIWT, a nacelle was designed and fabricated from aluminum to house the dynamometer, motor, and ESC. The nacelle was built as a streamlined shape to reduce the aerodynamic interference. It was made of three removable parts, as shown in Figure 3, to allow easy access to the motor and the dynamometer. In addition to protecting the electronics, the nacelle also acts as a containment in case of breakdown of the dynamometer during operation.
To install the test rig in the AIWT, a mounting system was also designed and fabricated. It consists of a strut, disc, and flat plate, all made of aluminum. The strut has a NACA airfoil shape to reduce the aerodynamic interference and it is welded to the disc. The nacelle/dynamometer block is first attached to the strut and secured in place using eleven screws (three at the top of the strut and four on each of its sides), and then the nacelle/strut/disc assembly is bolted to the flat plate (Figure 3).
Classification: Unclassified NRC-CNRC
Distribution: Unlimited Page 11 of 47
Figure 3 Test rig - containment nacelle and support system
The flat plate was designed to fit an existing window in the floor of the test section, making the installation of the test rig quick and easy (Figure 4). To set the propeller at an angle of sideslip (AOS), i.e., the angle in the horizontal plane relative to the incoming air flow, the disc is used as
Classification: Unclassified NRC-CNRC
Distribution: Unlimited Page 12 of 47
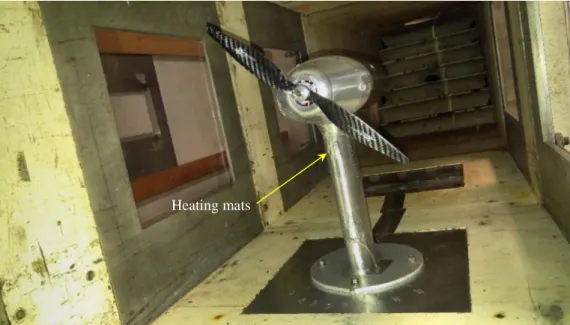
a turntable where the four bolts holding the disc to the flat plate can be unbolted and the whole nacelle/strut/disc assembly can be rotated. A number of desired AOS values, between -45 and 45 degrees, are engraved/marked on the flat plate for accurate rotational positioning of the test rig. Since the strut is hollow, holes matching the inner profile of the strut were drilled in the disc and the flat plate to run all the connection wires through the strut, underneath the floor of the wind tunnel, and connect them to the power supply and data acquisition and control system of the AIWT. To prevent icing from accreting on the strut, heating mats were attached to the leading edge of the strut and activated during testing (Figure 4).
Figure 4 Test rig assembly in the NRC AIWT
4.3 Propellers
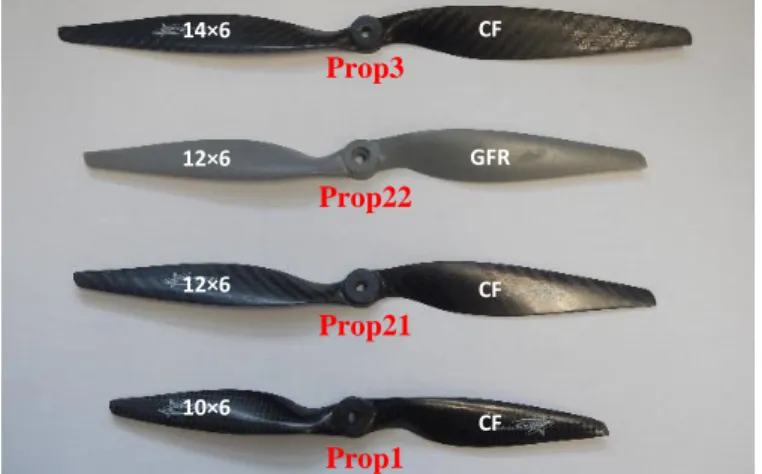
Four generic “off-the-shelf” propellers were tested in the AIWT. Three of the propellers had carbon fiber (CF) blades while the blades of the fourth propeller were made of glass fiber-reinforced plastic (GFR). The four propellers are depicted in Figure 5 and their specifications are summarized in Table 2. The propellers can also be referred to by their diameter and their pitch (e.g., 10×6 refers to a propeller that has a diameter of 10 and a pitch of 6). The propellers with carbon fiber blades were the main interest of the test program. Most of the tests were conducted using the 12×6 CF propeller as the 12 diameter was selected to be the nominal propeller diameter for this icing study. However, a 12×6 GFR propeller was also tested to investigate the effect of the material on the icing of the blades. No blades had any icephobic coatings or de-icing systems.
Classification: Unclassified NRC-CNRC
Distribution: Unlimited Page 13 of 47
Figure 5 Propellers tested in the NRC AIWT Table 2 Propeller specifications
Propeller Material Diameter (in) Pitch (in)
Prop1 (10×6) CF 10 6
Prop21 (12×6) CF 12 6
Prop22 (12×6) GFR 12 6
Prop3 (14×6) CF 14 6
5 TEST PLAN
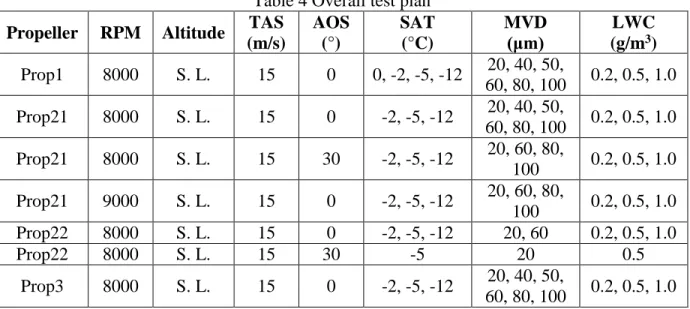
The RCBenchmark dynamometer can be used for testing at both constant RPM and constant thrust. However, in the current study, the icing tests of the four propellers were conducted at a constant RPM where the rotational speeds of the propellers were held constant for the whole duration of each run. All propellers were tested at the nominal flow and icing conditions of Table 3 below. However, other targeted icing conditions of temperature, water droplet size and liquid water content (LWC) were also considered to study the effect of varying these parameters on the icing of the propeller blades. Furthermore, to investigate the tolerance for icing of the propellers when operating at an RPM higher than 8000 or at an AOS different from zero, Prop21 was also tested at an RPM of 9000 and an angle of sideslip of 30. The overall test plan is provided in Table 4 and the detailed test matrix is provided in Appendix A.
Since most of the tests were conducted using the 12” diameter propeller (Prop21), the main characteristic non-dimensional aerodynamic parameters for this propeller are provided for reference. These parameters are: the tip Mach number, the advance ratio and the Reynolds number. The values of these aerodynamic parameters are calculated at the nominal test conditions with the Reynolds number based on the rotational speed and the local chord of the propeller blade at 75% of the propeller diameter. The values of the three non-dimensional aerodynamic parameters are:
Tip speed Mach number = 0.4 Advance ratio = 0.37 Reynolds number = 144000 CF GFR Prop3 Prop22 CF CF Prop21 Prop1 14×6 12×6 12×6 10×6
Classification: Unclassified NRC-CNRC
Distribution: Unlimited Page 14 of 47
Table 3 Nominal test conditions
Pressure Altitude (m) Prop. Rotational Speed (rpm) TAS (m/s) AOS (°) SAT (°C) MVD (μm) LWC (g/m3) 0 (S. L.) 8000 15 0 -12 20 0.5
Here, TAS is the true air speed, AOS is the angle of sideslip, SAT is the static temperature and MVD is the volume median diameter of the water droplets (water droplet size). The S. L. in the pressure altitude column refers to sea level. In the remainder of the document, the word “altitude” will be used to indicate the pressure altitude and the propeller rotational speed will be referred to by RPM.
Table 4 Overall test plan
Propeller RPM Altitude TAS (m/s) AOS (°) SAT (°C) MVD (μm) LWC (g/m3) Prop1 8000 S. L. 15 0 0, -2, -5, -12 20, 40, 50, 60, 80, 100 0.2, 0.5, 1.0 Prop21 8000 S. L. 15 0 -2, -5, -12 20, 40, 50, 60, 80, 100 0.2, 0.5, 1.0 Prop21 8000 S. L. 15 30 -2, -5, -12 20, 60, 80, 100 0.2, 0.5, 1.0 Prop21 9000 S. L. 15 0 -2, -5, -12 20, 60, 80, 100 0.2, 0.5, 1.0 Prop22 8000 S. L. 15 0 -2, -5, -12 20, 60 0.2, 0.5, 1.0 Prop22 8000 S. L. 15 30 -5 20 0.5 Prop3 8000 S. L. 15 0 -2, -5, -12 20, 40, 50, 60, 80, 100 0.2, 0.5, 1.0
5.1 Nominal Air Speed and RPM
A 50% reduction in thrust due to icing was adopted as the criteria to stop the tests. However, since the thrust decreases with increasing air speed for a constant RPM, a number of dry (no ice) runs were conducted at the beginning of the test program to determine the optimal/nominal combination of air speed and RPM that will provide sufficient positive thrust for all the propeller diameters for a reasonable duration of testing. It should be noted that no wind tunnel corrections were applied to the measured thrust.
Each of the propellers, Prop1, Prop21 and Prop3, was tested at three RPMs, 6000, 7000 and 8000. For each RPM, the air speed was gradually increased until the thrust became zero. Figure 6 shows that 15 m/s is the highest air speed at an RPM of 8000 that provides reasonable positive thrust values for the three propellers. As such, an air speed of 15 m/s and an RPM of 8000 were used as the nominal values for testing. An air speed of 15 m/s also represents a good average of typical cruise speeds of small unmanned aerial systems, which are the focus of the current study. Figure 6 also reveals that at 8000 RPM, the 12 propeller that was used in the current tests was less efficient than the 10” propeller was when the air speed exceeded 12 m/s. This is believed to be due to manufacturing defects and the sanding of the blades to balance the propeller. Some variability is also to be expected when using mass-produced “off the shelf” hardware.
Classification: Unclassified NRC-CNRC
Distribution: Unlimited Page 15 of 47
Prop1 (10×6) Prop21 (12×6) Prop3 (14×6) Figure 6 Nominal air speed and RPM
5.2 Water Droplet Distribution
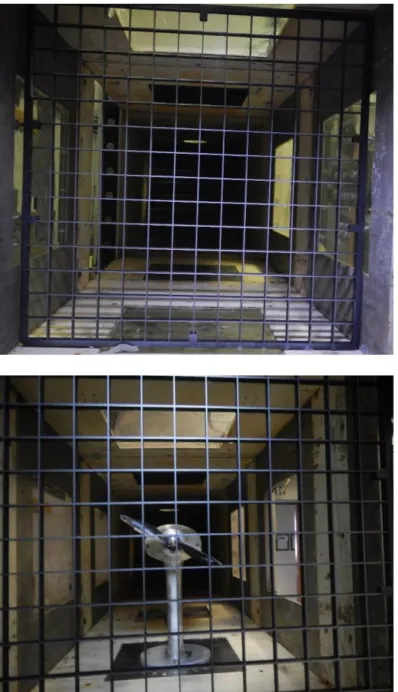
To ensure that the water droplet distribution in the test section is reasonably uniform, a number of tests using the ice collection grid of Figure 7 were conducted at a limited number of relevant test conditions. Some of these tests were conducted using the ice collection grid only, as shown in the upper image of Figure 8, while other tests were conducted with the propellers spinning behind (downstream of) the grid.
These tests were run for a fixed duration. At the end of each, a visual inspection (qualitative) of the accreted ice and measurements (quantitative) of the ice thickness at five locations on the grid were used to assess the uniformity of the droplet clouds. The five locations of the ice thickness measurement points are indicated on the grid in Figure 7, where CLP (centreline point) refers to the point located at the centreline of the test section, and CP (ceiling point), FP (floor point), EWP (east wall point), and WWP (west wall point) refer to points located close to the ceiling, floor east wall, and west wall of the test section, respectively.
Figure 7 Ice collection grid
CLP
WWP EWP
CP
Classification: Unclassified NRC-CNRC
Distribution: Unlimited Page 16 of 47
The images of Figure 8 show reasonably uniform ice accretion on the ice collection grid when used alone and when used with Prop1 (10×6) for the considered icing conditions. Table 8 depicts the ice thicknesses (in mm) at the five measurement locations for the grid alone and the grid when tested with the three carbon fiber propellers spinning downstream. The tests were conducted at the nominal test conditions of Table 3 for a duration of 180 s. The values in the table indicate that for the tested conditions, the thickness of the ice collected by the grid at the five measurement points is reasonably uniform for the three propellers.
Classification: Unclassified NRC-CNRC
Distribution: Unlimited Page 17 of 47
Table 5 Thickness of grid collected ice, in mm, at the grid measurement locations Prop./Grid Configuration Ice Thickness at Measurement Points (mm)
CLP WWP EWP CP FP
Grid 2.616 1.803 2.286 1.651 1.930
Grid + Prop1 1.397 1.372 0.991 1.473 1.372
Grid + Prop21 1.372 1.041 0.889 0.889 0.864
Grid + Prop3 1.651 1.575 1.575 1.372 1.143
6 RESULTS AND DISCUSSION
In addition to the parameters that were measured by the dynamometer during the run, at the end of each run a set of images of the iced propellers were taken and the ice accreted on the blades was weighed. The icing of the investigated small size propellers, the degradation of their performance due to icing and their respective tolerance for icing at high RPM were analyzed using the measured time histories of the propellers’ thrust and torque as well as the recorded time histories of the electrical power of the motor that is required to drive the propellers as the ice builds up on the blades. The mass of accreted ice was also used in the analysis for a limited number of cases, and. the values of the measured ice mass for each test case are reported in the test matrix table in Appendix A. Furthermore, the images taken at the end of each run were used to relate certain changes in the thrust, torque, and electrical power time histories to the icing of the blades.
In an attempt to video record the time histories of the icing events and synchronize them with the time histories of the various parameters that were measured by the dynamometer (i.e., thrust, torque, current, voltage, power, vibrations, etc.), a strobe-camera system was also setup and used during testing. Unfortunately, the strobe-camera system did not perform well, and the recorded videos ended up being of poor quality. Thus, no images from these videos were used in the data analysis.
The results are presented in terms of the effects of the icing parameters (MVD, LWC and SAT) on the time histories of the thrust, torque, and electrical power. The three carbon fiber propellers with different diameters (Prop1, Prop21 and Prop3) are presented and analyzed first for an RPM of 8000 and an angle of sideslip, AOS = 0°. The results obtained for Prop21 at (RPM, AOS) = (9000, 0°) and (RPM, AOS) = (8000, 30°), and those obtained for the glass fiber reinforced propeller, Prop22, at (RPM, AOS) = (8000, 0°), are presented and analyzed subsequently.
6.1 Effect of MVD on Carbon Fiber Propellers
As depicted in Table 4, all propellers were tested at sea level with MVD values of 20 and 60 μm, using the nominal values of Table 3 for the RPM, flow and other icing conditions (i.e., RPM = 8000, TAS = 15 m/s, AOS = 0°, SAT = -12°C and LWC = 0.5 g/m3). The results were thus analyzed for all tested CF propellers using the data obtained for these two MVD values and the nominal values of Table 3. The data obtained for MVD = 40 μm were also included in the analysis for more coverage of the MVD range.
Classification: Unclassified NRC-CNRC
Distribution: Unlimited Page 18 of 47
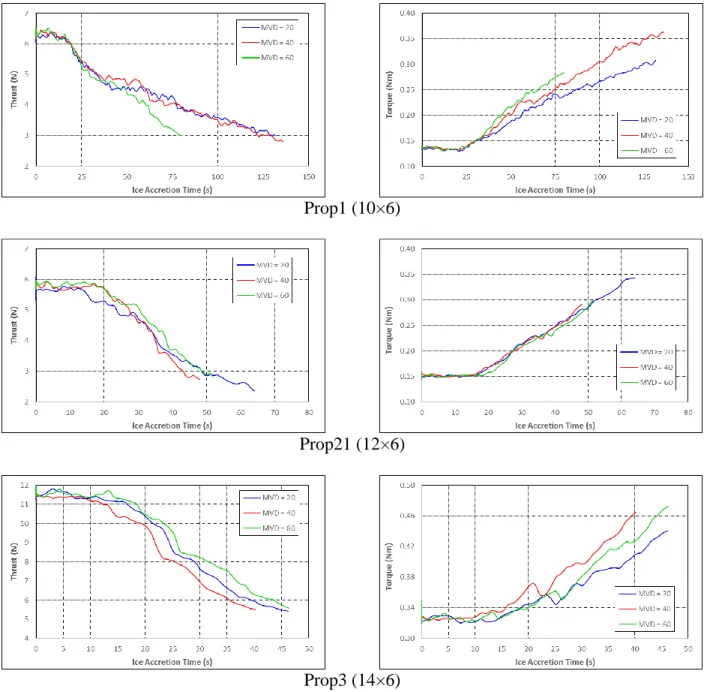
Figure 9 and Figure 10 present the time histories of the thrust, torque, and electrical power for Prop1, Prop21 and Prop3 for the three MVD values. As ice began to accrete, Figure 9a shows that it took about 20 s of ice accretion on the blades before the thrust started decreasing gradually and steadily. This was the case for all three propellers. However, as MVD increased, a slight effect on the time history of the thrust was observed for Prop21 and Prop3, and it took about the same amount of time (about 40 s for Prop21 and about 50 s Prop3) to lose 50% of the thrust for the three values of MVD. For Prop1, however, while the thrust continued to decrease with time for MVD = 60 μm, the time histories for 20 and 40 μm show that the thrust decrease reached a plateau and then held for some time (about 34 s for 20 μm and about 25 s for 40 μm) before it continued its gradual decrease following a relatively sharp drop at the end of the plateaus. Because of the plateauing of the thrust, it took longer (about 120 s) for the propeller to lose 50% of its thrust for MVD = 20 and 40 μm. For MVD = 60 μm it took only about 75 s to get the thrust down by 50%. Similar but shorter plateaus, followed by a relatively smooth return to gradual decrease, were also observed in the thrust time histories for Prop21 and Prop3.
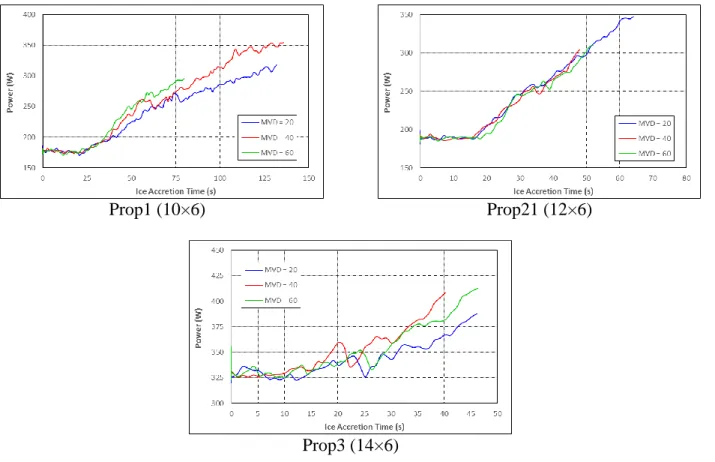
The ice buildup on the propeller blades also induced an increase in the torque and consequently an increase in the electrical power required from the motor to keep driving the propellers, as shown in Figure 9b and Figure 10, respectively. The three MVD values resulted in a maximum increase of torque for Prop1, after 50% drop in thrust due to icing, of about 150% relative to the value at the start of the icing event (Figure 9b), and a maximum increase in electrical power of about 100% (Figure 10). However, the respective maximum increases of torque and electrical power were about 100% and 60% for Prop21, and about 40% and 25% for Prop3.
The torque and electrical power time histories also revealed that these two parameters underwent small dips for short periods of time, as depicted in Figure 9b and Figure 10. These was larger for Prop3 than for Prop1 and Prop21. Comparing the torque and power time histories to the thrust time histories, it was found that these dips in torque and electrical power correspond to the times at which the thrusts of the three propellers experienced relatively sharp drops following their plateauing, as mentioned above.
To appreciate better the effect of MVD on the three propellers, a comparison of their normalized thrusts is presented on the same graph (Figure 11) for MVD = 60 μm. The dashed horizontal line indicates the 50% thrust reduction mark. According to Figure 11, Prop1 was more tolerant to icing at high RPM than Prop21 and Prop3, as it took Prop1 more time to lose 50% of its thrust than Prop21 or Prop3.
It is believed that the plateauing of the thrust curves and the corresponding dips in the torque and electrical power curves are the result of ice shedding and/or some runback ice towards the tips of the blades, as corroborated by the images of Figure 12 and Figure 13. The upper left image of Figure 12 shows that both blades of Prop1 have shed ice for MVD = 20 μm. This image also reveals that the ice shedding was asymmetrical, as one blade shed more ice than the other. Ice shedding was also observed for Prop21 for MVD = 20 μm. However, only one blade shed ice at the tip while no shedding was observed for the other blade. Ice adhesion strength will depend on the local surface finish, which probably accounts for the difference. Prop3 showed no ice shedding
Classification: Unclassified NRC-CNRC
Distribution: Unlimited Page 19 of 47
for MVD = 20 μm, and no shedding was also observed for the three propellers for MVD = 60 μm, as indicated by the left images of Figure 12. A close examination of the ice accretion along the leading edges of the blades (Figure 13) confirmed that runback ice formed spanwise, resulting in more ice accumulation near the tips of the blades, especially for Prop1 and Prop21 and for MVD = 60 μm (left and middle right images of Figure 12).
To provide an idea of how much ice it takes to reduce the thrust by 50%, the respective values of the ice mass that was accumulated on the blades of the three propellers for MVD = 60 μm are reported in Table 6. For MVD = 60 μm, no ice shedding was observed for any of the three propellers, and the measured ice masses represent the full amount of ice that was accreted during the whole run. The respective times during which the three propellers were exposed to icing (spray times) are also included in Table 6. As can be noted, it took about the same amount of ice buildup for Prop21 and Prop3 to lose 50% of their thrusts (0.7 g and 0.8 g, respectively). The time it took for these two propellers to accumulate this amount of ice is about the same as well; it was only 5 s less for Prop3. However, the time and ice mass for Prop21 and Prop3 represent about 60% of the time and ice mass it took Prop1 to lose 50% of its thrust.
Table 6 Accreted ice mass, RPM = 8000, SAT = -12°C, LWC = 0.5 g/m3, MVD = 60 μm Propeller Ice mass (g) Spray time (s)
Prop1 1.3 81
Prop21 0.7 53
Classification: Unclassified NRC-CNRC
Distribution: Unlimited Page 20 of 47
Prop1 (10×6)
Prop21 (12×6)
Prop3 (14×6)
a) Thrust b) Torque
Figure 9 MVD effect on time histories of thrust (left) and torque (right) of the three CF propellers, RPM = 8000, SAT = -12°C, LWC = 0.5 g/m3 (Note that horizontal time scales differ)
Classification: Unclassified NRC-CNRC
Distribution: Unlimited Page 21 of 47
Prop1 (10×6) Prop21 (12×6)
Prop3 (14×6)
Figure 10 MVD effect on time histories of electrical power of the three CF propellers, RPM = 8000, SAT = -12°C, LWC = 0.5 g/m3 (Note that horizontal time scales differ)
Figure 11 MVD effect on normalized thrust of the three CF propellers, SAT = -12°C, MVD = 60 μm, LWC = 0.5 g/m3
Classification: Unclassified NRC-CNRC
Distribution: Unlimited Page 22 of 47
a) MVD = 20 μm b) MVD = 60 μm
Figure 12 MVD effect on ice accretion of the three CF propellers, RPM = 8000, SAT = -12°C, LWC = 0.5 g/m3 P ro p 3 ( 1 4 ×6 ) P ro p 2 1 ( 1 2 × 6 ) P ro p 1 ( 1 0 ×6 ) Ice shedding Ice shedding
Classification: Unclassified NRC-CNRC
Distribution: Unlimited Page 23 of 47
Prop1 (10×6)
Prop21 (12×6)
Prop3 (14×6)
a) MVD = 20 μm b) MVD = 60 μm
Figure 13 MVD effect on ice accretion along the leading edge of the three CF propeller blades, RPM = 8000, SAT = -12°C, LWC = 0.5 g/m3
Ice shedding
Classification: Unclassified NRC-CNRC
Distribution: Unlimited Page 24 of 47
6.2 Effect of LWC on Carbon Fiber Propellers
Three values of the liquid water content were used to investigate the influence of LWC on the icing of the three CF propellers. These were LWC = 0.2, 0.5 and 1.0 g/m3. The effects of the LWC were studied at sea level using the nominal values of Table 3 for the RPM, flow and other icing conditions (i.e., RPM = 8000, TAS = 15 m/s, AOS = 0°, TAS = -12°C and MVD = 20 μm). Figure 14 shows the time histories of the thrust and torque while Figure 15 depicts the time histories of the electrical power for Prop1, Prop21 and Prop3. These time histories indicate that the LWC had a more pronounced effect on the tolerance for icing of all three CF propellers than the MVD did. The rate of decrease of thrust due to the ice buildup on the blades of the propellers was more severe as the LWC increased from 0.2 to 1.0 g/m3, resulting in a shorter time to reach a 50% thrust reduction (Figure 14a). Also, for all tested values of the LWC, the larger the size of the propeller, the faster it lost 50% of its thrust as ice accreted on the blades. Similar behaviours were also observed for the increase of torque (Figure 14b) and the increase of the electrical power as a result of ice accretion on the blades of the three CF propellers. The maximum increases of torque and electrical power due to the 50% drop in thrust corresponded to LWC = 0.5 g/m3 for all three
propellers. For Prop1, these maximum increases were about 130% for torque and 80% for electrical power, while they were about 100% and 60% for Prop21 and about 30% and 20% for Prop3.
The thrust time histories (Figure 14a) show that for the three values of the LWC, the thrust plateaued for some time after it started decreasing. These plateaus were more visible for LWC = 0.2 and 0.5 g/m3 than for LWC = 1.0 g/m3. The plateaus were followed by relatively large drops in the thrust, which were then followed by a more gradual decrease again. Similar to the MVD effects, the drops following the plateauing of the thrust were reflected by dips in the time histories of the torque and electrical power. Figure 16 presents a comparison of the normalized thrusts obtained for the three propellers at the worst LWC condition of 1.0 g/m3. Similar to what was observed for MVD = 60 μm (Figure 11), Figure 16 also indicates that the 10 propeller had a better tolerance for icing at high RPM than the 12 and 14 propellers.
Again, the plateaus in the thrust time histories are believed to be induced by ice shedding and/or runback ice along the blades towards the tips. In fact, the images of the icing of the full propellers at the end of the runs (Figure 17) and those of the ice accretion along the leading edge of the blades (Figure 18) confirm that one of the blades of Prop1 shed ice for LWC = 0.2 g/m3, and that the blades of Prop1 and Prop21 accumulated more ice at the tip for LWC = 1.0 g/m3. However, no ice
shedding was observed for Prop21 and Prop3 for LWC = 0.2 g/m3 and for all three propellers for LWC = 0.6 g/m3.
Table 7 depicts the respective spray times and ice masses for the three propellers for LWC = 1.0 g/m3, which represents the worst case of the three LWC values that were tested. At this LWC, no ice shedding was observed, and it took about the same amount of ice (only 0.2 g difference) for Prop21 and Prop3 to lose 50% of their thrusts. Prop1 however, accumulated about double the amount of ice that was accreted on the blades of Pro21 and Prop3 prior to losing 50% of its thrust.
Classification: Unclassified NRC-CNRC
Distribution: Unlimited Page 25 of 47
Table 7 Accreted ice mass, RPM = 8000, SAT = -12°C, LWC = 1.0 g/m3, MVD = 20 μm
Propeller Ice mass (g) Spray time (s)
Prop1 1.3 48 Prop21 0.7 27 Prop3 0.5 22 Prop1 (10×6) Prop21 (12×6) Prop3 (14×6) a) Thrust b) Torque
Figure 14 LWC effect on time histories of thrust (left) and torque (right) of the three CF propellers, RPM = 8000, SAT = -12°C, MVD = 20 μm (note variable time scales)
Classification: Unclassified NRC-CNRC
Distribution: Unlimited Page 26 of 47
Prop1 (10×6) Prop21 (12×6)
Prop3 (14×6)
Figure 15 LWC effect on the time histories of electrical power of the three CF propellers, RPM = 8000, SAT = -12°C, MVD = 20 μm (note variable time scales)
Figure 16 LWC effect on normalized thrust of the three CF propellers, SAT = -12°C, MVD = 20 μm, LWC = 1.0 g/m3
Classification: Unclassified NRC-CNRC
Distribution: Unlimited Page 27 of 47
Prop1 (10×6)
Prop21 (12×6)
Prop3 (14×6)
a) LWC = 0.2 g/m3 b) LWC = 1.0 g/m3
Figure 17 LWC effect on ice accretion of the three CF propellers, RPM = 8000, SAT = -12°C, MVD = 20 μm
Classification: Unclassified NRC-CNRC
Distribution: Unlimited Page 28 of 47
Prop1 (10×6)
Prop21 (12×6)
Prop3 (14×6)
a) LWC = 0.2 g/m3 b) LWC = 1.0 g/m3
Figure 18 LWC effect on ice accretion along the leading edge of the three CF propeller blades, RPM = 8000, SAT = -12°C, MVD = 20 μm
Classification: Unclassified NRC-CNRC
Distribution: Unlimited Page 29 of 47
6.3 Effect of SAT on Carbon Fiber Propellers
The effects of air temperature on the tolerance for icing of the three CP propellers was investigated for three SAT values of -2°C, -5°C and -12°C. Similar to the investigations of MVD and LWC effects, the effects of the SAT were studied at sea level using the nominal values of Table 3 for the RPM, flow and other icing conditions (i.e., RPM = 8000, TAS = 15 m/s, AOS = 0°, MVD = 20 μm and LWC = 0.5 g/m3).
Figure 19 presents the effects of SAT on the time histories of thrust (Figure 19a) and torque (Figure 19b), while Figure 20 shows the effects of SAT on the time histories of the electrical power. Since the data for -12°C were analyzed in the MVD effects section and are only included for comparison purposes, the analysis is focused on the effects of SAT = -2°C and SAT = -5°C. Figure 19b shows that for Prop1, the thrust started with a slight gradual decrease, and then plateaued for a large period of time before it started decreasing gradually again to reach a 50% drop after about 400 s from the start of ice buildup. The increase in torque and electrical power followed the same trend as thrust.
For Prop21, the thrust, torque and electrical power showed almost no change over time at -2°C, while a slight decrease in thrust and slight increase in torque and electrical power were observed for Prop3 at this temperature. For SAT = -5°C, the fast decrease in thrust at the start of ice buildup was followed by a number of ice shedding cycles, which started after about a 40% thrust reduction. The warmer temperatures presumably result in a weaker ice-matrix bond, making shedding easier. This delayed the drop to 50% thrust, which was reached after about 250 s of ice accretion. The ice shedding cycles were also reflected in the time histories of torque and electrical power, which continued increasing in a zig-zag fashion until the thrust dropped by 50%. Similar variations were also observed for thrust, torque and electrical power of Prop21. However, for this propeller, the run was stopped after a number of ice shedding cycles and did not reach the 50% drop in thrust. For the larger propeller, Prop3, a continuous decrease in thrust until 50% along with an increase in torque and electrical power were observed. The time history of thrust also shows a couple of small plateaus at -5°C, which corresponded to somewhat large dips in the torque and electrical power. The ice shedding and ice shedding cycles were also reflected in the vibration time histories as measured by the thrust stand (measured in gravitational acceleration, G). A sample of the time histories of the amplitude of vibration of the three propellers is shown in Figure 21 for SAT = -5°C. As expected, the level of vibrations increased with ice buildup and dropped to lower levels when there was shedding.
Similar to MVD and LWC above, the normalized thrusts of the three propellers are compared in Figure 22 for SAT = -12°C. This comparison also indicated that for this icing condition, the 10 propeller was more tolerant to icing than the 12 and 14 propellers.
The ice accretion images of Figure 23 corroborate the observed changes in the thrust, torque, and electrical power. Large portions of both blades of Prop1 shed ice at both -2°C and -5°C; however, small parts of the blades near the hub accumulated sufficient ice over time at these two temperatures to keep driving the thrust down until it dropped by 50%. No ice was accreted on the
Classification: Unclassified NRC-CNRC
Distribution: Unlimited Page 30 of 47
blades of Prop21 and Prop3 at the end of the runs at -2°C. However, partial shedding was observed on both blades of these two propellers at -5°C.
Classification: Unclassified NRC-CNRC
Distribution: Unlimited Page 31 of 47
Prop1 (10×6)
Prop21 (12×6)
Prop3 (14×6)
a) Thrust b) Torque
Figure 19 LWC effect on time histories of thrust (left) and torque (right) of the three CF propellers, RPM = 8000, MVD = 20 μm, LWC = 0.5 g/m3 (note variable horizontal axis scales)
Classification: Unclassified NRC-CNRC
Distribution: Unlimited Page 32 of 47
Prop1 (10×6) Prop21 (12×6)
Prop3 (14×6)
Figure 20 SAT effect on the time histories of electrical power of the three CF propellers, RPM = 8000, MVD = 20 μm, LWC = 0.5 g/m3 (note variable horizontal axis scales)
Figure 21 Vibration due to ice shedding, Figure 22 SAT effect on normalized thrust SAT = -5°C, MVD = 20 μm, LWC = 0.5 g/m3 of the three CF propellers, SAT = -12°C,
Classification: Unclassified NRC-CNRC
Distribution: Unlimited Page 33 of 47
a) SAT = -2°C b) SAT = -5°C
Figure 23 SAT effect on ice accretion of the three CF propellers, RPM = 8000, MVD = 20 μm, LWC = 0.5 g/m3
Prop1 (10×6)
Prop21 (12×6)
Prop3 (14×6)
Ice shedding Ice shedding
Ice shedding
Classification: Unclassified NRC-CNRC
Distribution: Unlimited Page 34 of 47
6.4 Effect of Increase in RPM
Since the LWC and SAT were found to have more pronounced effects than MVD on the tolerance for icing of the CF propellers, the effects of increasing the RPM from 8000 to 9000 were analyzed based on the changes in LWC and SAT. The increased RPM effects were investigated for Prop21 using the same LWC and SAT values as those used for RPM = 8000 (i.e., LWC = 0.2, 0.5 and 1.0 g/m3 and SAT = -2, -5 and -12°C). When varying the LWC, the SAT was kept at -12°C (nominal
value), and the LWC was set to its nominal value of 0.5 g/m3 as the SAT was varied. The MVD was also set to its nominal value of 20 μm at all times.
Figure 24a presents the effects of varying the LWC on the time histories of the thrust, torque and electrical power for Prop21 at 9000 RPM, while Figure 24b shows the effects of varying the SAT on the same time histories for the same propeller at the same RPM. Compared to the time histories obtained for Prop21 at 8000 RPM (Figures 14, 15, 19 and 20), an increase of RPM by 1000 was not large enough to induce drastic changes in the time variations of the thrust, torque and electrical power as ice accreted on the blades. The three quantities experienced time evolutions at 9000 RPM, which were overall similar to those experienced at 8000 RPM for the same icing conditions (i.e., LWC, SAT and MVD values). This is clearly illustrated in Figure 25, where the normalized thrusts obtained for the two RPM values are compared for the worst-case icing condition of SAT = -12°C, MVD = 20 μm and LWC = 1.0 g/m3. However, the ice accretion images of Figure 26 reveal that
at the ice conditions of SAT = -5°C, MVD = 20 μm and LWC = 0.5 g/m3, larger portions of the blades shed ice at 9000 RPM (Figure 26a) compared to 8000 RPM for the same icing conditions (Figure 23b). One could argue that increased centrifugal forces result in more shedding. Also, at the icing conditions of SAT = -12°C, MVD = 20 μm and LWC = 0.2 g/m3, Figure 26b shows that both blades shed ice at 9000 RPM while no shedding was observed at 8000 RPM at the same icing conditions (Figure 17a). It is worth noting that the ice shedding observed for LWC = 0.2 g/m3 at 9000 RPM was not symmetrical as for one of the blades, ice shed off of the portion of the blade that was located about mid-span (right image of Figure 26b). This image also shows that there was still ice near the tip of the blade.
Classification: Unclassified NRC-CNRC
Distribution: Unlimited Page 35 of 47
a) Varying LWC b) Varying SAT
Figure 24 Effect of increased RPM (= 9000) on time histories of thrust, torque and electrical power for Prop21, AOS = 0°, MVD = 20 μm
Classification: Unclassified NRC-CNRC
Distribution: Unlimited Page 36 of 47
Figure 25 Effect of increased RPM (= 9000) on normalized thrust of Prop21 (12×6), AOS = 0°, SAT = -12°C, MVD = 20 μm, LWC = 1.0 g/m3
a) SAT = -5°C, MVD = 20 μm, LWC = 0.5 g/m3
b) SAT = -12°C, MVD = 20 μm, LWC = 0.2 g/m3
Figure 26 Effect of increased RPM (= 9000) on ice accretion of Prop21 (12×6), AOS = 0° Ice shedding
Ice shedding
Ice shedding
Classification: Unclassified NRC-CNRC
Distribution: Unlimited Page 37 of 47
6.5 Effect of Angle of Sideslip
The intent here was to simulate icing for the rotors of multirotor small unmanned aerial systems (sUAS) in forward flight. Although not typical of the tilt angles of multirotor sUAS in forward flight, an attempt was made by setting the propeller Prop21 at an angle of sideslip, AOS = 30° relative to the incoming flow. The RPM was 8000 and the icing conditions were those used when Prop21 was tested at AOS = 0° (i.e. LWC = 0.2, 0.5 and 1.0 g/m3 and SAT = -2, -5 and -12 °C,
MVD = 20 μm). When varying the LWC, the SAT was kept at -12 °C (nominal value) and the LWC was set to its nominal value of 0.5 g/m3 as the SAT was varied.
Similar to the increase of RPM from 8000 to 9000, setting the propeller at an angle of sideslip of 30° did not seem to cause noticeable changes in the time histories of the thrust, torque and electrical power as ice builds up on the blades of Prop21 at the tested icing conditions. This is confirmed by Figure 28 which compares the normalized thrusts obtained at AOS = 0° and 30° for the worst icing condition of SAT = -12 °C, MVD = 20 μm and LWC = 1.0 g/m3. The only noticeable change is the increase of about 45% (from about 5.5 N to about 8 N) in the dynamic thrust at the start of the icing event because of the decrease in the effective airspeed that the propeller sees at AOS = 30°, which is 13 m/s instead of 15 m/s. The propeller lost 50% of its thrust due to icing for all three values of the LWC at SAT = -12° and MVD = 20 μm (Figure 27a) while the thrust, torque and electrical power stayed almost constant at SAT = -2° and kept cycling at -5° due to the occurrence of cycles of ice shedding. The ice shedding cycles started after some decrease of thrust prior to reaching 50% reduction and some corresponding increase in torque and electrical power as shown in Figure 27b. The images in Figure 29 confirms the ice shedding off of the propeller blades at SAT = -5°, MVD = 20 μm and LWC = 0.5 g/m3 which is similar to what was observed for Prop21 when tested under the same icing conditions at AOS = 0° (Figure 23b).
Classification: Unclassified NRC-CNRC
Distribution: Unlimited Page 38 of 47
a) Varying LWC b) Varying SAT
Figure 27 AOS (30°) effect on time histories of thrust, torque and electrical power Prop21, RPM = 8000, MVD = 20 μm
Classification: Unclassified NRC-CNRC
Distribution: Unlimited Page 39 of 47
Figure 28 AOS effect on normalized thrust of Prop21 (12x6), RPM = 8000, SAT = -12°C, MVD = 20 μm, LWC = 1.0 g/m3
SAT = -5 °C, MVD = 20 μm, LWC = 0.5 g/m3
Figure 29 AOS (30°) effect on ice accretion of Prop21 (12x6), RPM = 8000 Ice shedding
Classification: Unclassified NRC-CNRC
Distribution: Unlimited Page 40 of 47
6.6 Effect of Blade Material
To investigate the blade material effects on the icing of small propellers at high RPM, Prop22 (12×6), which had glass fiber-reinforced plastic (GFR) blades, was tested at the same icing conditions used to test the CF propeller, Prop21. The propeller was set at AOS = 0° and was operating at 8000 RPM. The icing conditions were LWC = 0.2, 0.5 and 1.0 g/m3, SAT = -2, -5 and -12°C, and MVD = 20 μm. The SAT was kept at -12°C (nominal value) while varying the LWC, and the LWC was set to its nominal value of 0.5 g/m3 while varying the SAT.
Figure 30a depicts the time histories for the thrust, torque and electrical power as ice built up while varying LWC. Figure 30b presents the same time histories for the three values of the SAT. The overall trends were similar to those observed for Prop21 at the same icing conditions. This similarity in trends is confirmed by Figure 31, where the normalized thrusts obtained for Prop21 and Prop22 are compared for the worst icing conditions of SAT = -12°C, MVD = 20 μm and LWC = 1.0 g/m3. However, Figure 30a shows that the thrust decreased more rapidly than for Prop21 (Figure 14a) for LWC = 0.2 g/m3, resulting in a rapid increase of the torque and the electrical power. The other difference between the CF propeller and the glass fiber-reinforced propeller worth noting is the decrease in thrust and increase in torque and electrical power at SAT = -2°, as shown in Figure 30b. For Prop21, the thrust, torque and electrical power remained almost unchanged at this temperature, while the thrust for Prop22 decreased by about 25% before the ice shedding event, which resulted in a slight increase of the torque and electrical power.
The images of Figure 32 reveal that at SAT = -2° (Figure 32a), the blades of Prop22 still had some ice near the hub at the end of the run while no ice was observed on the blades of Prop21. This could explain the slight decrease in thrust prior to ice shedding at this temperature. At T = -12°C and similar to Prop21, both blades shed ice at the tip; however, the ice covered a larger portion near the leading edges of the blades of Prop22. This is believed to be caused by the large spread of the ice as it ran back towards the tip. The large runback ice is evidenced by Figure 32c, where the ice accumulation at the tips of the blades of Prop22 were much larger than what was observed for the blades of Prop21 (Figure 18b).
Classification: Unclassified NRC-CNRC
Distribution: Unlimited Page 41 of 47
a) Varying LWC b) Varying SAT
Figure 30 Blade material (GFR) effect on time histories of thrust, torque and electrical power of Prop22, RPM = 8000, AOS = 0°, MVD = 20 μm
Figure 31 Blade material effect on normalized thrust, AOS = 0°, RPM = 8000, SAT = -12°C, MVD = 20 μm, LWC = 1.0 g/m3
Classification: Unclassified NRC-CNRC
Distribution: Unlimited Page 42 of 47
a) SAT = -2°C, MVD = 20 μm, LWC = 0.5 g/m3
b) SAT = -12°C, MVD = 20 μm, LWC = 0.5 g/m3
c) SAT = -12°C, MVD = 20 μm, LWC = 1.0 g/m3
Figure 32 Blade material (GFR) effect on icing of Prop22 (12×6), RPM = 8000, AOS = 0° Ice shedding
Ice shedding
Classification: Unclassified NRC-CNRC
Distribution: Unlimited Page 43 of 47
7 CONCLUSIONS AND RECOMMENDATIONS
An icing test program was conducted in the NRC altitude icing wind tunnel to study and characterize the icing of small propellers at high RPM. Three carbon fiber propellers with diameters of 10, 12 and 14 and one glass fiber-reinforced plastic propeller with a 12 diameter were tested at sea level at a nominal air speed of 15 m/s. Most of the tests were conducted at a nominal high rotational speed of 8000 RPM and angle of side of slip of 0° for a range of icing conditions. A number of test runs were also conducted at 9000 RPM to investigate the effect of increasing the rotational speed on the icing of the tested propellers. A number of other tests were also conducted at a sideslip angle of 30° to simulate the icing of the rotors of multirotor unmanned aerial systems in forward flight. The effect of the blade material on the icing of small propellers at high RPM was investigated using a glass fiber-reinforced propeller. The effects of RPM, angle of sideslip and blade material were studied using 12 diameter propellers and similar icing conditions. The effects of temperature and liquid water content on the icing of the small propellers at high RPM were found to be more significant than the effects of the water droplet size. Also, increasing the RPM to 9000 and setting the propeller to an angle of sideslip of 30° were found not to cause noticeable changes. However, the blade material seemed to alter some of the icing characteristics, which translated into some changes in the time variations of the measured thrust and torque as well as the measured motor electrical power required to drive the propeller. The preliminary results that were obtained for the three tested propellers indicate that the size (diameter) of the propeller has an effect on its icing at high RPM. It should be noted that all these propellers are in the same range of diameter; more tests with larger propellers (larger diameters) are required to confirm this preliminary observation and to support evidence-based regulation for flight of larger UAS into icing conditions.
To investigate further and understand better the icing of small propellers at high RPM, additional testing is required as per the following recommendations.
Coverage of larger ranges of icing conditions (LWC > 1.0 g.m3, rime ice conditions, SLD).
Conduct tests with fixed time durations for the runs (i.e., not the 50% thrust reduction criteria). Conduct testing at ice conditions representative of icing environments at altitudes below 400
ft (i.e., freezing rain and freezing drizzle).
Conduct additional testing to investigate icing of larger propellers (i.e. diameters > 14”) For future tests, including some repeat tests from Phase 2, improve the strobe-camera system
to synchronize icing events with the time histories of the measured parameters of the propeller and the motor.
8 ACKNOWLEGMENTS
Classification: Unclassified NRC-CNRC
Distribution: Unlimited Page 44 of 47
9 REFERENCES
1. Benmeddour A., “Investigation of Tolerance for Icing of Small UAV Rotors/Propellers – Phase 1”, LTR-AL-2019-0024, Aerodynamics Laboratory, NRC-Aerospace.
2. FAA 14 CFR Appendix C to PART 15,
https://www.ecfr.gov/cgi-bin/text-idx?SID=97a1079d9cb76850c56df5cfce79cc9e&mc=true
&node=ap14.1.25.0000_0nbspnbspnbsp.c&rgn=div9.
3. Clark C. “Effects of Wind Tunnel Aerodynamic Blockage on Stagnation Collection Efficiency in an Icing Environment”, AIAA Paper 2018-3832, AIAA Aviation Forum, 2018 Atmospheric and Space Environments Conference, 25-29 June 2018, Atlanta, GA, USA.
Classification: Unclassified NRC-CNRC
Distribution: Unlimited Page 45 of 47
APPENDIX A – DETAILED TEST MATRIX
Prop. Rot.
Speed TAS AOS SAT VMD LWC
Spray Time Weight of Ice RPM m/s C m g/m3 s g 10x6 CF 8000 S. L. 15 0 -12 20 0.5 133 1.7 40 137 2.7 50 98 1.7 60 81 1.3 80 73 1.0 100 73 1.1 10x6 CF 8000 S. L. 15 0 -12 20 0.2 433 1.6 1.0 48 1.3 10x6 CF 8000 S. L. 15 0 0 20 0.5 229 No ice
-2 403 No ice All ice came off during removal of prop. -5 244 0.8 Ice came off one blade during removal of prop.
12x6 CF 8000 S. L. 15 0 -12 20 0.5 65 0.8 40 49 0.6 50 54 0.7 60 53 0.7 80 54 0.6 100 69 0.9 12x6 CF 8000 S. L. 15 0 -12 20 0.2 146 0.7 1.0 27 0.6 12x6 CF 8000 S. L. 15 0 0 20 0.5 - - Not tested -2 390 No Ice -5 78 0.3 12x6 CF 8000 S. L. 15 30 -12 20 0.5 63 1.0 40 - - Not tested 50 - - Not tested 60 63 1.0 80 60 0.9 100 74 1.1 12x6 CF 8000 S. L. 15 30 -12 20 0.2 180 1.0 1.0 33 1.0 12x6 CF 8000 S. L. 15 30 0 20 0.5 - - Not tested -2 104 No ice -5 53 0.4 Comments Prop. Altitude
Classification: Unclassified NRC-CNRC
Distribution: Unlimited Page 46 of 47
Prop. Rot.
Speed TAS AOS SAT VMD LWC
Spray Time Weight of Ice RPM m/s C m g/m3 s g 12x6 CF 9000 S. L. 15 0 -12 20 0.5 53 0.5 40 - - Not tested 50 - - Not tested 60 53 0.4 80 62 0.9 100 72 1 12x6 CF 9000 S. L. 15 0 -12 20 0.2 181 0.5 1.0 29 0.7 12x6 CF 9000 S. L. 15 0 0 20 0.5 - - Not tested -2 136 No ice -5 73 0.1 12x6 GFR 8000 S. L. 15 0 -12 20 0.5 65 0.7 40 - - Not tested 50 - - Not tested 60 62 1.1 80 - - Not tested 100 - - Not tested 12x6 GFR 8000 S. L. 15 0 -12 20 0.2 175 1.2 1.0 29 1 12x6 GFR 8000 S. L. 15 0 0 20 0.5 - - Not tested
-2 111 - Did not weigh ice
-5 63 0.6 14x6 CF 8000 S. L. 15 0 -12 20 0.5 47 0.5 40 41 0.8 50 44 0.8 60 48 0.8 80 53 0.8 100 64 0.9 14x6 CF 8000 S. L. 15 0 -12 20 0.2 122 0.7 1.0 22 0.5 14x6 CF 8000 S. L. 15 0 0 20 0.5 Not tested -2 134 No ice -5 54 0.1 Comments Prop. Altitude

![Figure 2 RCBenchmark [4] Series 1580 Dynamometer (with propeller installed) Table 1 RCbenchmark Series 1580 Dynamometer design specifications](https://thumb-eu.123doks.com/thumbv2/123doknet/13993964.455217/11.918.270.651.129.409/figure-rcbenchmark-dynamometer-propeller-installed-rcbenchmark-dynamometer-specifications.webp)