Biomass torrefaction: Modeling of reaction thermochemistry
The MIT Faculty has made this article openly available. Please share how this access benefits you. Your story matters.
Citation Bates, Richard B., and Ahmed F. Ghoniem. "Biomass torrefaction:
Modeling of reaction thermochemistry." Bioresource Technology 134 (April 2013), pp. 331-340.
As Published http://dx.doi.org/10.1016/j.biortech.2013.01.158
Publisher Elsevier
Version Author's final manuscript
Citable link http://hdl.handle.net/1721.1/105394
Terms of Use Creative Commons Attribution-NonCommercial-NoDerivs License
Biomass torrefaction: Modeling of reaction thermochemistry Richard B. Bates, Ahmed F. Ghoniem
Department of Mechanical Engineering, Massachusetts Institute of Technology, Cambridge, MA ABSTRACT:
Based on the evolution of volatile and solid products predicted by a previous model for torrefaction (Bates and Ghoniem, 2012) a model has been developed which describes their thermal, chemical, and physical properties as well as the rates of heat release. The first stage of torrefaction, associated with hemicellulose decomposition, is exothermic releasing between 40-280 kJ/kginitial. The second stage is associated with the decomposition of the remaining
lignocellulosic components, completes over a longer period, and is predicted to be either endothermic or exothermic depending on the temperature. Increasing torrefaction severity, as quantified by the mass loss, is predicted to cause greater heat release. The rate of mass loss and rate of heat release increase with higher temperatures. The higher heating value of volatiles produced during torrefaction was estimated to be between 4.4 and 16 MJ kg-1increasing with the level of mass loss.
Highlights:
Model developed to describe the energy balance during willow torrefaction
First stage is exothermic releasing 40-280 kJ/kg
Second stage is either exothermic or endothermic
Higher torrefaction temperatures result in increased reaction rate and heat release rate
Keywords: torrefaction; pyrolysis; kinetics; thermochemistry; heat release
Corresponding Author: Richard B. Bates
Address: Room 3-339 77 Massachusetts Avenue Cambridge, MA 02139 USA Email: rbates@mit.edu
Telephone: +1 617 253 5365 Fax: +1 615-253-5981
Second Author: Professor Ahmed F. Ghoniem
Address: Room 3-344 77 Massachusetts Avenue Cambridge, MA 02139 USA Email: ghoniem@mit.edu
Telephone: +1 617 253 5981
1. Introduction
Raw biomass faces utilization challenges due to its low bulk energy density,
hydrophobicity, propensity to decay during storage, and high grinding energy requirement. Torrefaction has been proposed as thermal pretreatment to improve these characteristics (Bergman et al., 2005; Arias et al., 2008; Ohliger et al., 2012). Torrefaction is a mild pyrolysis occurring between 200-300 ○C for a residence time between several minutes to about an hour which results in partial devolatilization (0-60 wt%) of the solid biomass (Prins, 2005). Pyrolysis broadly refers to partial to complete devolatilization (70-90 wt%) occurring over a wide
temperature range (200-1000○C) though typically between 400-700 ○C (Neves et al., 2011). Multi-scale (e.g. particle, reactor, flowsheet) models of torrefaction require quantification of the physical and chemical properties of torrefaction products in order to describe the process energy balance. At the particle scale, the heat of torrefaction may act as a local source or sink of thermal energy and therefore affect temperature and conversion profiles significantly. As (Turner et al., 2010) note, the heat release is a crucial mechanism through which chemical reaction and heat transfer phenomena are coupled at the particle scale. Another important level of coupling occurs between the particle temperature and the solid physical properties, such as specific heat, density, and conductivity, which determine the rate at which heat diffuses through the particle. Description of the evolution of these properties requires accurate kinetics and thermochemical models.
At the reactor scale, an accurate estimate of the reaction enthalpy is necessary for process design and control. For example, process conditions which lead to excessive heat release could potentially cause runaway thermal reactions in the absence of active thermal management.
For the development of flowsheet models, it is necessary to quantify the thermal energy input required during torrefaction to assess the overall process efficiency. In particular, the feasibility of autothermal torrefaction as originally described by (Bergman et al., 2005), which combusts the volatile products released during torrefaction to provide heat for the process itself, depends on the accurate estimation of their composition and heating value.
The present work describes a model for the energy balance and thermochemistry of torrefaction based on a previous kinetics model (Bates and Ghoniem, 2012) for the evolution of volatile matter during willow torrefaction. The parameters of the two models are linked. While the volatile composition parameters from are specific to willow torrefaction, this work outlines a general framework for relating these feedstock-specific parameters to the energy balance of the reactions.
A variety of experimental studies have examined the effect of torrefaction conditions on the mass and energy yield of the solid product (Arias et al., 2008; Bridgeman et al., 2008; Almeida et al., 2010; Medic et al., 2012). (Lee et al., 2012; Medic et al., 2012) performed multiple regressions relating process parameters (such as initial moisture content, temperature, and residence time) to the solid product energy and mass yield. (Almeida et al., 2010) showed that the solid mass loss could be used as a quantitative indicator for the extent of torrefaction. Several product characteristics including solid energy yield, heating value, and chemical composition were linearly regressed against the solid mass loss. The validity of these empirical regressions beyond the thermal conditions tested is unknown. Additionally they cannot predict the energy content of liberated volatiles or the reaction thermochemistry. The latter are the objectives of this work.
1.1. Previous estimates for the heat of torrefaction
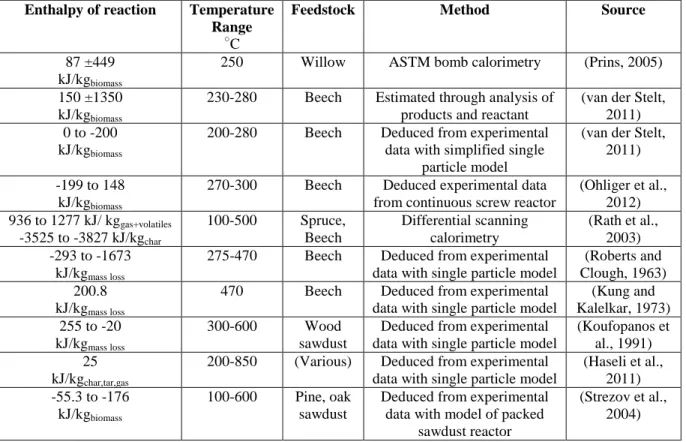
Estimates for the heat of torrefaction and pyrolysis as measured or deduced by a variety methods are summarized in Table 1. The main methods include 1) estimation from the heating value of the products, 2) differential scanning calorimetry (DSC), 3) fitting of coupled single particle models with experimental data and, 4) measurement of heat release using custom reactor systems.
Experimental attempts to assess the heat of willow and beech torrefaction through measuring (or estimating) the heating values of the initial biomass, solid, and volatile products have been unable to precisely classify it as either exothermic or endothermic (Prins, 2005; van der Stelt, 2011). Overall heat of torrefaction estimates based on this method applied to willow and beech torrefaction range from -1200 kJ/kgbiomassexothermic to 1500 kJ/kgbiomass endothermic
(Prins, 2005; van der Stelt, 2011).
(van der Stelt, 2011) also used a fixed bed reactor setup to torrefy a single 10 cm long, 28mm diameter cylindrical beech particle in order to deduce the enthalpy of reaction. Six thermocouples enabled measurement of the particle temperature at positions between the centerline and surface. Based on the intraparticle temperature profile and a simplified single particle model, the reaction heat was estimated to be between 0 to -220 kJ/kg beechfor torrefaction temperatures between 200-280 ○C.
(Ohliger et al., 2012) utilized a continuous screw reactor system to measure heat release during the torrefaction of beech wood. Though sensitive to the assumed physical properties of the biomass such as the specific heat capacity, it was concluded that the heat of torrefaction was between -199 kJ/kg beech to 148 kJ/kg beech.
1.2. Previous estimates for the heat of pyrolysis
Pyrolysis refers to devolitilization occurring over a broader range of thermal conditions than torrefaction; however, given the greater number of investigations examining the heat of pyrolysis, it is also worth summarizing these efforts. Literatureestimates for the heat of wood pyrolysis range widely from -2300 kJ/kgbiomass (exothermic) to 418 kJ/kgbiomass (endothermic)
(Turner et al., 2010). The differences have been attributed to the small sample sizes (ranging from milligrams to grams), the presence of impurities, and experimental conditions (Turner et al., 2010).
During differential scanning calorimetry (DSC) wood pyrolysis experiments ramping from 100-500○C at 10 ○C min-1 (Rath et al., 2003) found wide variations in the heat of primary wood pyrolysis depending on the sample mass, feedstock, and conditions. Observing an apparent shift from endothermic to exothermic behavior, it was concluded that the overall heat of
pyrolysis depended on the competition between an exothermic char formation process (3525 to -3827 kJ kgchar-1) and an endothermic (936 to 1277 kJ kggas+volatiles-1) volatile formation process.
The overall heat of pyrolysis expressed as a linear superposition of an exothermic char formation and endothermic volatile formation weighted by mass fractions (obtained experimentally or from kinetic expressions)(Rath et al., 2003):
∆𝐻𝑡𝑜𝑡𝑎𝑙 = ∆𝐻𝑒𝑥𝑜𝑌𝑐𝑎𝑟 + ∆𝐻𝑒𝑛𝑑𝑜(1 − 𝑌𝑐𝑎𝑟) (1) Where ∆𝐻𝑡𝑜𝑡𝑎𝑙 has units of kJ kgbiomass-1, 𝑌𝑐𝑎𝑟 is a product mass fraction with units of
(kgchar/kgbiomass -1), ∆𝐻𝑒𝑥𝑜 and ∆𝐻𝑒𝑛𝑑𝑜 are the apparent exothermic and endothermic heats of
pyrolysis (see Table 1) for the reported values.
Various experimental investigations have deduced the heat of pyrolysis through fitting of predictions from coupled single particle models with observed particle temperature profile
beginning with the work of (Roberts and Clough, 1963). Such methods lead to varying estimates ranging from endothermic to exothermic (see Table 1). One issue which contributes to the these discrepancies was originally highlighted by (Kung and Kalelkar, 1973) -and recently
corroborated by (Haseli et al., 2011) -is related to whether the temperature-dependence of the heat of pyrolysis are accounted for in the single particle models. Based on the fitting, they concluded that the standard enthalpy of pyrolysis (at a reference temperature) is endothermic (25 kJ/kg); however, at elevated temperatures, the enthalpy of pyrolysis can be exothermic (due to differences in the heat capacities of products and reactants).
In reviewing these efforts, it is clear that a thermochemical model for torrefaction should account for 1) the dependence of the heat of torrefaction on the competitive reaction pathways (e.g. char, volatile yield), and 2) the temperature dependence of the enthalpy of reactions.
2. Mathematical model
2.1. Approach
The present thermochemical model is coupled to an existing kinetics model (Bates and Ghoniem, 2012) which describes the evolution of solid and volatile products during willow torrefaction (summarized in section 2.2). Based on the detailed composition information provided by this kinetics model, the temperature-dependent properties of the pseudo components (e.g., enthalpy capacity, energy yield) are estimated (section 2.3 and section 2.4). Then, equations describing the energy balance (heat release) in terms of the reaction kinetics are presented (section 2.5). In summary, the present model describes:
1) The temperature-dependent thermodynamic properties of all pseudocomponents (A,B,C,V1,V2).
2) The rates (and cumulative) of heat release.
2.2. Solid mass loss kinetics and composition
The kinetics model developed in (Bates and Ghoniem, 2012) used a two-step, first-order mechanism to describe the solid mass loss kinetics. The mechanism was originally shown by (Prins, 2005) to satisfactorily describe willow mass loss curves during torrefaction. In this mechanism, the torrefaction products are lumped into five pseudo-components:
where the solid phase pseudo components (A,B,C) represent raw biomass (A), an intermediate solid (B), and char (C), volatile products are represented by V1 and V2, and k1, k2, kV1, kV2
representArrhenius kinetic parameters. The solid mass yield 𝑌𝑆 and mass loss 𝑌𝑙𝑜𝑠𝑠 are obtained
through integration of equations 1 through 5 in (Bates and Ghoniem, 2012):
where 𝑚𝑋 is the mass of pseudo-component X (A,B,C,V1,V2), and 𝑚0 is the initial dry mass of
the solid.
The elemental composition of A is a model input and determined from the ultimate analysis (dry basis) of the raw biomass it represents. For this work, the elemental composition of raw willow from (Prins, 2005) was assumed: 𝑌𝑗 ,𝐴 = 0.472, 0.061, 0.451, 0.003, 0.013
j=C,H,O,N,Ash, respectively. Equations 25 and 26 in (Bates and Ghoniem, 2012) define the composition of B and C (i.e 𝑌𝑗 ,𝐵 and 𝑌𝑗 ,𝐴) in terms of the kinetic rate parameters and
𝑌𝑆 = 𝑚𝐴+ 𝑚𝐵+ 𝑚𝐶 𝑚0 (2) 𝑌𝑙𝑜𝑠𝑠 =𝑚𝑉1+ 𝑚𝑉2 𝑚0 = 1 − 𝑌𝑆 (3) A 𝑘 B C 1 𝑘2 𝑘𝑉2 𝑘𝑉1 V1 V2
compositions of A, V1, and V2. The composition of the average solid product, 𝑌𝑗 ,𝑆 is calculated
from the integration of equation 18 (Bates and Ghoniem, 2012). Volatile pseudo components V1 and V2 are described by the fixed compositions shown in Table 2 of (Bates and Ghoniem, 2012).
2.3. Thermodynamic property estimation
In order to model the reaction thermochemistry, estimates of the total enthalpy for the nine volatile matter species and three solid pseudocomponents are necessary. The total enthalpy at temperature T is given by the summation of the formation enthalpy and sensible enthalpy:
𝐻𝑖 𝑇 = 𝐻𝑓,𝑖° + 𝑐𝑝,𝑖 𝑇 𝑇0
𝑇 𝑑𝑇 (4)
Where 𝐻𝑓,𝑖° is the standard heat of formation of species i in J kg-1 and 𝑐𝑝,𝑖 is the specific heat
capacity of component i in J kg-1 K-1, T is the reaction temperature in Kelvin, and 𝑇0 is the standard temperature (298.15K).
2.3.1. Volatile products (V1, V2)
V1 and V2 were modeled as ideal gas mixtures of nine chemical components including acetic acid, water, carbon dioxide, methanol, lactic acid, furfural, hydroxyacetone, carbon dioxide, and carbon monoxide. Property data for the heating value, enthalpy of formation, and specific heat capacity for these chemical species was combined from various sources and summarized in Table 4.
2.3.2. Solid reactant and products (A,B,C) Heating value
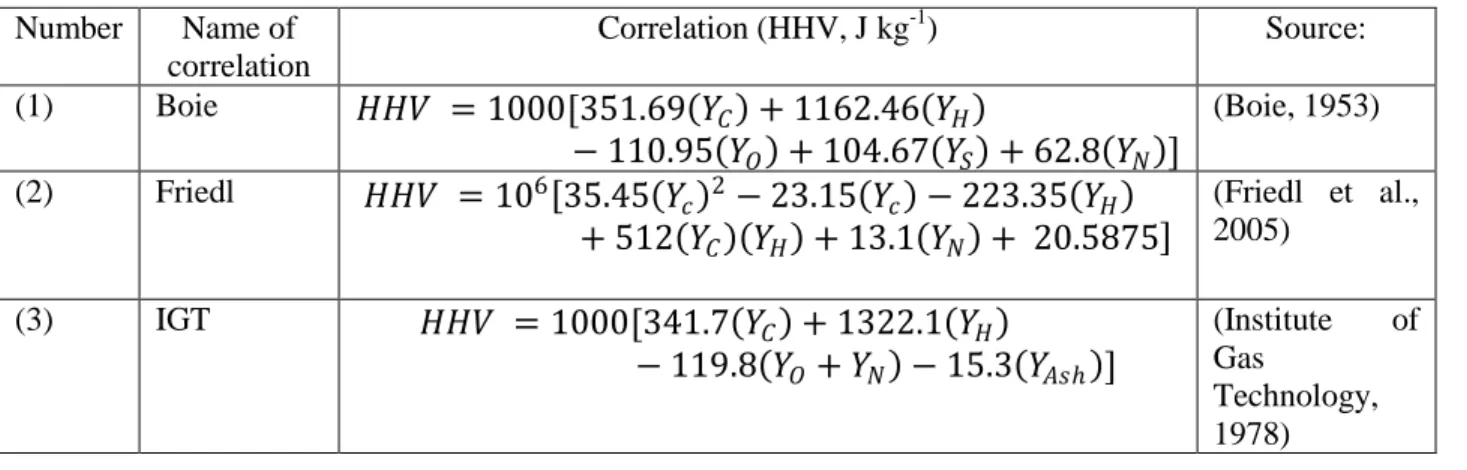
Several validated correlations have been developed to predict the heating values of coal and biomass solid fuels based on their elemental composition as defined through ultimate analysis. To the best knowledge of the authors, no correlations have been specifically developed or
validated for torrefied biomass. The accuracy of the correlations as measured by their standard error of prediction (SEP) when compared to a set of bomb calorimetry measurements is between 337 to 1023 kJ kg-1 (Friedl et al., 2005) or an average absolute error of 2.6-6.7% (Sheng and Azevedo, 2005). Based on their performance in literature evaluations, three equations (shown in Table 2) to calculate the HHV in J kg-1 on a dry basis were selected and compared for modeling. 𝑌𝑗 is the elemental composition expressed as the mass fraction of element j (C,H,O,S,N,Ash)
contained in the dry fuel. HHV equation 1 in Table 2, the well-known Boie correlation, was developed originally for coals but is commonly applied to biomass samples as well. HHV equation 2 in Table 2, the Friedl et al. correlation, was derived from ordinary least squares regression and partial least squares regression fitting of 122 biomass samples. The Friedl et al. correlation was fitted/validated for biomass samples with higher heating values between 16-26 MJ kg -1 andcarbon content between 42-50%. HHV equation 3 from Table 2, the IGT
correlation, was also originally developed for coal but has since been applied and validated for refuse derived fuel (Sheng and Azevedo, 2005).
Enthalpy of formation
The enthalpy of formation of solid fuels can be estimated based on their heating value. Complete combustion of a dry biomass fuel represented by the chemical formula CHxOy can be
expressed as: 𝐶𝐻𝑥𝑂𝑦 𝑠 + 2 + 𝑥 2 − 𝑦 2 𝑂2(𝑔) → 𝑥 2𝐻2𝑂 𝑙 + 𝐶𝑂2(𝑔) (5)
Where the stoichiometric coefficients x and y can be determined from the fuel’s elemental composition, 𝑥 =𝑌𝐻 𝑌𝐶 𝑀𝑊𝐶 𝑀𝑊𝐻 (6)
𝑦 =𝑌𝑂 𝑌𝐶
𝑀𝑊𝐶 𝑀𝑊𝐻
(7)
Where 𝑀𝑊𝐶, 𝑀𝑊𝐻 are the atomic weights (kg mol -1) of carbon and hydrogen, respectively. The
relationship between the HHV (reported as a positive value) and the enthalpy of formation of reactants and combustion products is:
−𝐻𝐻 𝑉 = 𝑣𝑖𝐻 𝑓,𝑖° 𝑝𝑟𝑜𝑑𝑢𝑐𝑡𝑠
− 𝑣𝑖𝐻 𝑓,𝑖° 𝑟𝑒𝑎𝑐𝑡𝑎𝑛𝑡𝑠
(8)
Where, 𝐻𝐻 𝑉 is the higher heating value (J mol-1), 𝐻
𝑓,𝑖° is the standard enthalpy of formation (J
mol-1) for the ith product or reactant, and 𝑣𝑖 is the number of mols product or reactant per mol of solid fuel reactant. After substitution and rearrangement, the specific standard enthalpy of formation (J kgfuel-1) can be defined in terms of its higher heating value (J kgfuel-1) and elemental
composition: 𝐻𝑓,𝐶𝐻° 𝑥𝑂𝑦 = 𝐻𝐻𝑉 𝐶𝐻𝑥𝑂𝑦 + 𝑌𝐻 2𝑀𝑊𝐻𝐻𝑓,𝐻2𝑂(𝑙) ° + 𝑌𝐶 𝑀𝑊𝐶𝐻𝑓,𝐶𝑂2 ° (9)
Specific heat capacity
The temperature and composition dependent specific heat capacities (J kg-1 K-1) of the solid pseudo components were modeled according to (Merrick, 1983):
𝑐𝑝𝑋 = 𝑅 𝑀𝑊𝑋 𝑒 380 𝑇 𝑒 380 𝑇 − 1 380 𝑇 −2 + 2𝑒1800𝑇 𝑒 1800 𝑇 − 1 1800 𝑇 −2 (10)
where R is the ideal gas constant 8.314 J mol-1 K -1and the average molecular weight 𝑀𝑊𝑋 of the solid pseudo component X (A,B,C) is calculated from its respective elemental composition,
1 𝑀𝑊𝑋 = 𝑌𝐷𝐴𝐹 ,𝑗/𝑀𝑊𝑗 5
𝑗 =1
(11)
where, 𝑌𝐷𝐴𝐹,𝑗, j= 1,…,5 represent the mass fractions of carbon hydrogen, oxygen, nitrogen, and sulfur on a dry, ash-free basis and 𝑀𝑊𝑗 , j= 1,…,5 represents the respective atomic weights (kg
2.4. Energy yield
2.4.1. Solid product energy yield
The solid energy yield (in terms of the HHV) of the torrefied solid product is an important torrefaction parameter and various published experimental results exist for a variety of feedstocks and torrefaction conditions. The definition of the solid energy yield, 𝜂𝑆 is:
where an energy densification ratio, 𝑅𝐻𝐻𝑉 is defined:
𝐻𝐻𝑉𝑓 is the heating value of the torrefied solid product in J kg-1, and 𝐻𝐻𝑉0 is the initial heating
value of the solid feed in J kg-1.
2.4.1. Volatile product energy yield The energy yield of the total volatiles is defined:
where 𝐻𝐻𝑉𝑉𝑡𝑜𝑡 is the average heating value of the cumulative volatiles J kg-1.
2.5. Heat release
The heat release rate for the overall reaction as well as that attributed to each stage is calculated from the thermochemical properties and reaction rates. The general equation for the rate of heat release under isothermal conditions at temperature T can be summarized:
𝑑𝑞𝑟 𝑑𝑡 + 𝑑(𝐻𝑋𝑚𝑋) 𝑑𝑡 5 𝑋=1 = 0 (15)
where qr is the cumulative heat release in J; 𝐻𝑋 (X=1,2,3..5) is the enthalpy of component X at
temperature T; 𝑚𝑋 (X=1,2,3..5) represents the mass of component X. The index X refers to the
𝜂𝑆 = 𝑌𝑆𝑅𝐻𝐻𝑉 (12) 𝑅𝐻𝐻𝑉 =𝐻𝐻𝑉𝑓 𝐻𝐻𝑉0 (13) 𝜂𝑉𝑡𝑜𝑡 = 𝑌𝑙𝑜𝑠𝑠𝐻𝐻𝑉𝑉𝑡𝑜𝑡 𝐻𝐻𝑉0 (14)
pseudocomponents A,B,C,V1,V2, respectively. This differential equation can be integrated simultaneously with the other mass loss kinetics equations to compute the cumulative heat release rate.
The instantaneous product distribution (at temperature T) is defined by the solid mass loss kinetics mechanism which can be described by a two stage first-order decomposition:
𝐴 → 𝛽𝐵 + 𝜈𝑉1 (16)
𝐵 → 𝛾𝐶 + 𝜉𝑉2 (17)
Where 𝛽, 𝜈, 𝛾, 𝜉, the instantaneous fractional yields, were previously defined (Bates and
Ghoniem, 2012). Therefore an enthalpy of reaction for stages one, two, and at completion under at temperature T can be defined:
𝛥𝐻𝑟,1 = 𝛽𝐻𝐵+ 𝜈𝐻𝑉1− 𝐻𝐴 (18)
𝛥𝐻𝑟,2= 𝛾𝐻𝐶+ 𝜉𝐻𝑉2− 𝐻𝐵 (19)
𝛥𝐻𝑟,𝑓𝑖𝑛𝑎𝑙 = 𝛽𝛾𝐻𝐶+ 𝜈𝐻𝑉1+ 𝛽𝜉𝐻𝑉2− 𝐻𝐴 (20)
where, 𝐻𝑋 is the total enthalpy of pseudocomponent (X=A,B,C,V1,V2) in J kg-1. The enthalpies of
reaction are defined per kilogram of reactant; so for step one, 𝛥𝐻𝑟,1 is defined per kg of A, 𝛥𝐻𝑟,2
is defined per kg of B and 𝛥𝐻𝑟,𝑓𝑖𝑛𝑎𝑙 is defined per kg of biomass. At the completion of both
steps, the products consist entirely of C, V1, and V2.
3. Results and discussion
First the energy yield and predictions of the model are compared with experimental results in section 3.1 and section 3.2 for the solid and volatile product, respectively. Then the model predictions for the magnitudes and rates of heat release are discussed in section 3.3. Lastly, a brief evaluation of the model and sources of uncertainty are described in section 3.4.
3.1. Solid product energy yield and densification
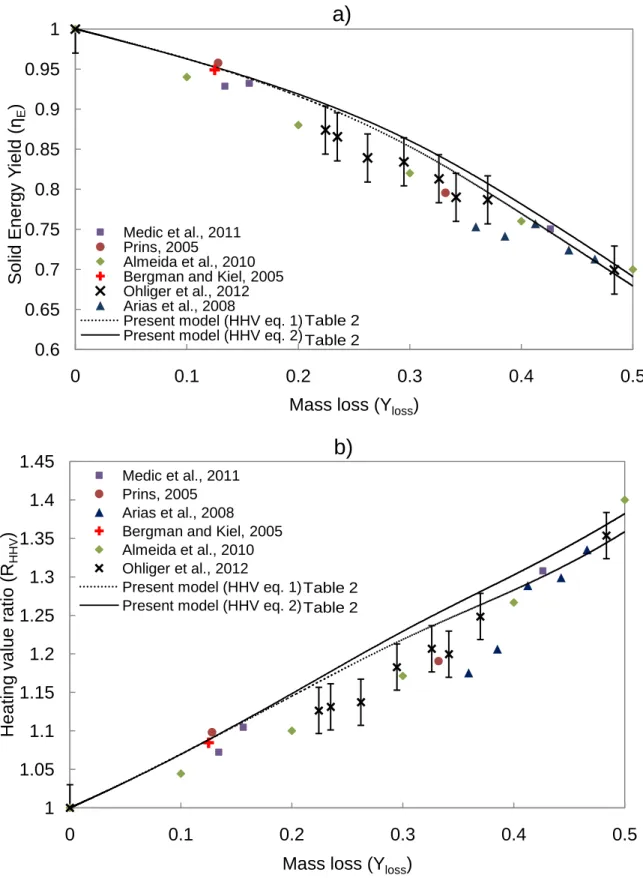
The model predictions of the solid energy yield (𝜂𝐸) versus mass loss (𝑌𝑙𝑜𝑠𝑠) are compared with
published experimental data in Figure 1a. Figure 1b illustrates the energy densification ratio (𝑅𝐻𝐻𝑉) versus mass loss (𝑌𝑙𝑜𝑠𝑠). In Figure 1a, Figure 1b and Figure 2 the model input conditions
representative of willow torrefaction (Tinitial 200 ○C, Tfinal= 300 ○C), and a heating rate of 5.88 ○
C/min) are assumed.
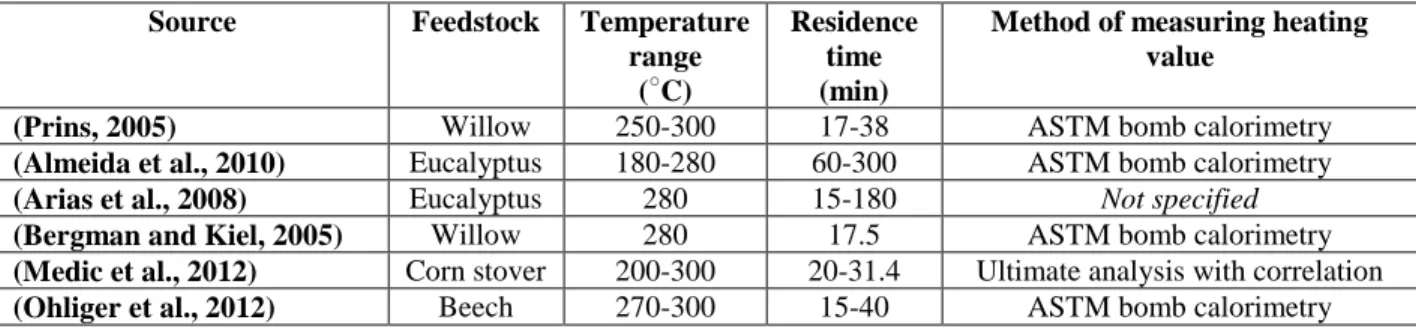
The data used to validate the present model was gathered under a variety of experimental conditions, feedstocks, and methods for measuring the energy yield, which are summarized in Table 3. Several of the studies, (Bergman and Kiel, 2005; Prins, 2005; Almeida et al., 2010; Ohliger et al., 2012), used bomb calorimetry to determine the energy yield. As highlighted by (Bergman et al., 2005), bomb calorimetry has a ±240 kJ kg-1 uncertainty in heating value
determination, therefore the relative percentage uncertainty in the higher heating value is ±1.5% and the resulting uncertainty in the estimated energy yield is approximately ±3% .
(Medic et al., 2012) calculated the heating value of the raw and torrefied corn stover by measuring the product ultimate analysis and applying a HHV correlation. Elemental analysis has an error of ±0.3 wt% (Friedl et al., 2005). The correlation they employed accurately predicted the heating value of 90% of tested biomass samples within ±5% (Sheng and Azevedo, 2005).
The data from (Almeida et al., 2010) represents the linear correlation they developed to describe the energy yield based on torrefied eucalyptus versus its mass loss:
The equation suggests that a 10% mass loss results in a 6% loss in energy yield. (Arias et al., 2008) did not report the method for determining the heating value or the uncertainty associated with their proposed correlation.
The model results illustrate a trend observed in all the experimental data: the heating value of the torrefied willow increases monotonically as mass loss increases. Applying the Boie and Friedl HHV correlations shows good agreement in the predictions of solid energy yield. At relatively lower levels of mass loss (0-15%), there are very small differences between the
predictions. The model predictions at 10-16% mass loss show the solid energy yield to be within 1% of the two experimental measurements made by Bergman & Kiel and Prins and within 3% of the points from (Medic et al., 2012). As the mass loss increases to greater than 25%, the model energy yield agrees with the data within the experimental uncertainty (±3%), but appears slightly high. For example, after 33% mass loss, the model predicts an energy densification ratio
between 1.25 and 1.24 (for HHV eq.2 and eq.1, respectively) which is slightly above Prins’ experimental measurement of 1.19. At this high/intermediate range of mass loss (25%-35%) It is difficult to conclude whether the model significantly overestimates the solid energy yield and densification ratio given the uncertainties associated with the experimental data and modeling approach.
One reason the present model predictions may over-estimate the energy yield of the solid product is related to the fitted compositions of V1 and V2. As was noted in (Bates and Ghoniem, 2012) the fitted volatile composition predicts an evolution in solid product composition which slightly over-estimates the carbon yield in the solid product particularly at higher levels of mass loss. Since the heating value of the product is strongly correlated to its carbon content, over-predicting the carbon yield also over-predicts the energy yield. Additionally, differences between the model and experimental data can be explained by differences in the feedstock. The volatile composition data used in this model was fitted for data from willow whereas the experimental
data used for comparison includes a variety of feedstocks such as beech, corn stover, eucalyptus, and willow.
At very high levels of mass loss (40-50%), which take 40 minutes under these kinetically controlled conditions, the model predictions appear to agree with the data within 1%.
Overall, the agreement over the range of mass loss suggests the model can satisfactorily predict the evolution of the energy yield of the solid product during willow torrefaction.
3.2. Volatile product energy yield
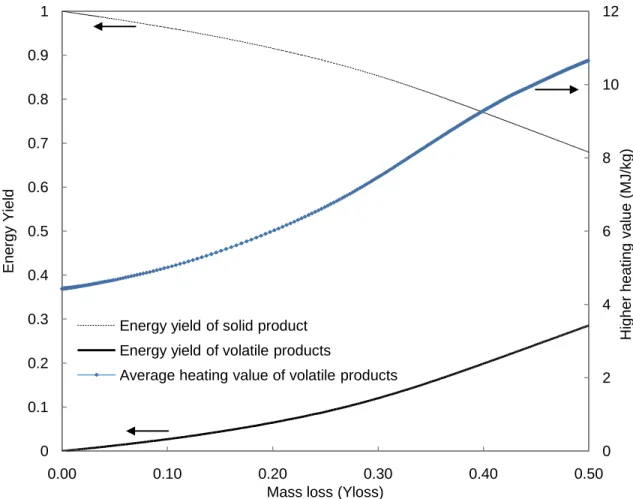
The energy yield, 𝜂𝑉𝑡𝑜𝑡, (left axis) and average heating value, 𝐻𝐻𝑉𝑉𝑡𝑜𝑡, (righ axis) of the cumulative volatile products as a function of mass loss, 𝑌𝑙𝑜𝑠𝑠 are shown in Figure 2 assuming the
same thermal conditions as those in Figure 1. Initially, the released volatiles consist only of V1 (heating value of 4.43 MJ kg-1). With higher levels of mass loss, increasing amounts of V2 (heating value of 16.3 MJ kg-1) are liberated, and thus the average heating value of the cumulative volatiles increases. For mass loss between 0-0.5, the average heating value of the total volatiles ranges between 4.43-10.6 MJ kg-1. These model predictions for the average heating value of the volatiles compares very well with the experimental estimates made in (van der Stelt, 2011) and (Prins, 2005) where the LHV of volatiles produced during beech and willow torrefaction was estimated/measured to be between 1-8 MJ kg-1 and4.9-10.6MJ kg-1,
respectively (depending on the method of calculation and temperature conditions). (Neves et al., 2011)reported a LHV between 2-4 MJ kg-1 for volatiles released at a peak pyrolysis temperature of 300 °C. The present modeling results also agree with the experimentally observed trend that increased levels of mass loss are associated with increased volatile heating value.
Figure 2 also depicts the balance of energy in the solid and volatile products. As torrefaction proceeds with increasing mass loss, a higher fraction of the initial energy (i.e heating value) of
the solids is contained in the volatiles. After mass loss of 0.5 kgvolatiles/ kginitial biomass, the volatiles
contain a significant percentage (28%) of that contained in the initial solid product energy (18.7 MJ kg -1). A mass loss of less than 0.3 limits the fraction of energy contained in the volatiles to between less than 12% of the initial heating value of the solid product.
3.3. Thermochemistry
The results of thermochemistry for each reaction step (one and two) as a function of temperature are discussed in section 3.3.1. Then, model results for the overall magnitude and rates of heat release are discussed in section 3.3.2.
3.3.1. Enthalpy of reactions under isothermal conditions
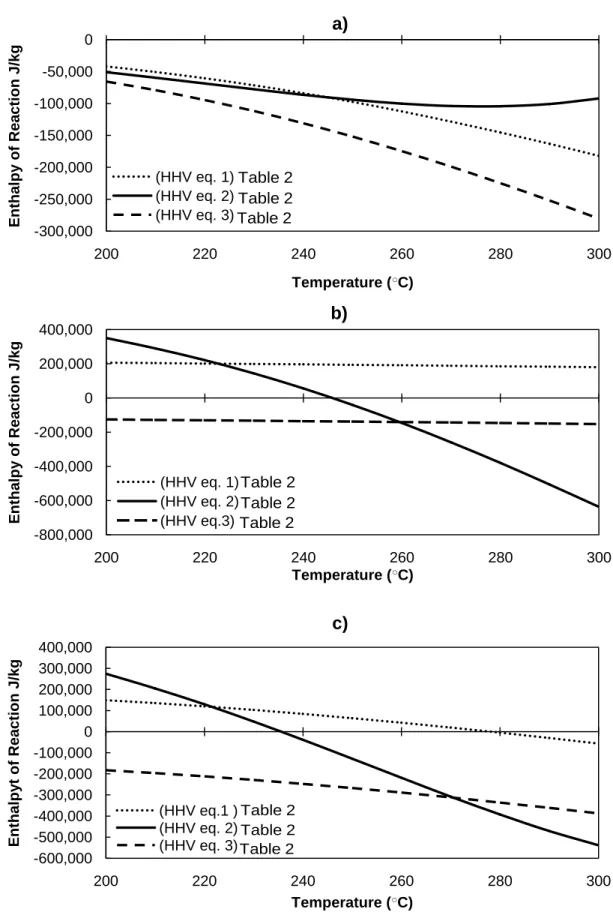
The predicted enthalpy of reaction for each step (based on equations (18) and (19) and at the final char yield (based on equation (20)) are shown in Figure 3a-c.
𝛥𝐻𝑟,1 calculated from equation (18) and plotted in Figure 3a is the reaction enthalpy
associated with the more rapid first stage (A B +V1) corresponding to the decomposition of the hemicellulose fraction. Using the Boie correlation (HHV eq. 1 from Table 3) the model predicts that depending on the temperature, this stage is exothermic (-40 to -180 kJ/kgA). This is
in good quantitative agreement with the model predictions using the Friedl et al. correlation (HHV eq. 2 from Table 3) showing that the first stage is slightly exothermic (-50 to -92 kJ/kgA).
Applying the IGT correlation, (HHV eq. 3 from Table 3) it is predicted that the first stage (-65 to -280 kJ/kgA) is exothermic. The exothermicity of the first stage can be explained by the
composition of the volatile products released during this state. The first stage comprises of dehydration and decarboxylation reactions associated with the decomposition of the
hemicellulose and (to a lesser extent) the cellulose fraction contained in the willow. As a result, the volatiles (V1) are comprised primarily of water, acetic acid, and carbon dioxide which have
relatively low heat of formation (see Table 4). This exothermicity is consistent with the experimentally measured exothermicity of pure hemicellulose pyrolysis bewteen 200-300 ○C (Yang et al., 2007).
𝛥𝐻𝑟,2 given by equation (19) and plotted in Figure 3b is the reaction enthalpy associated
with the slower second stage (B C +V2), corresponding to the decomposition of the cellulose fraction of the biomass. Using the Boie correlation the model predicts that the second stage is significantly endothermic (180 to 206 kJ/kgB) and has minimal temperature dependence. On the
other hand, when applying the Friedl et al. correlation, the model predicts a shift from
endothermic to exothermic behavior at 245 ○C. The predicted enthalpy of reaction ranges from 350 kJ/kgB at 200 ○C to -630 kJ/kgB at 300 ○C. Moreover, model predictions using the IGT
correlation also show an exothermic second stage between -125 to -155 kJ/kgB. Thus, the
application of various HHV correlations does not provide consensus on whether the second stage is either endothermic or exothermic.
𝛥𝐻𝑟,𝑓𝑖𝑛𝑎𝑙 calculated from equation (20) and plotted in Figure 3c) is the cumulative
reaction enthalpy (per kg of initial biomass) occurring at the completion of both stages (A V1+C +V2) and corresponding to complete decomposition of the hemicelullose and cellulose fractions. Using the Boie correlation the model predicted that the enthalpy of torrefaction at completion ranges between 150 kJ/kg to -56 kJ/kg for torrefaction temperatures of 200 and 300
○
C, respectively. On the other hand, using the Friedl et. al correlation predicted greater temperature dependence, varying between 275 kJ/kg endothermic at 200 ○C to -540 kJ/kg exothermic at 300 ○C. Applying the IGT correlation, the model predicted the enthalpy of reaction at completion varying from -182 kJ/kg to -387 kJ/kg. There is an almost identical
of reaction at completion becomes increasingly exothermic with temperature at a rate of -2.1 kJ/kg-K. Meanwhile the Friedl et al. correlation predicts that temperature has a much stronger effect on the enthalpy of reaction (-8.2 kJ/kg-K). Therefore, although all three correlations predict monotonically increasing exothermic reactions at higher temperatures, the Boie and IGT correlations (both developed for coal), appear to show better agreement on the variation of the enthalpy of reaction with temperature. This might be explained by the fact that the Friedl correlation was fitted for raw biomass samples and is therefore perhaps not valid for predicting the heating values of char-like materials. For example, with a representative torrefied char composition of 𝑌𝑗 ,𝐶𝑎𝑟 =0.92, 0.01, 0.016, 0.01, 0.043 (j=C,H,O,N,Ash) the Friedl et al.,
correlation predicts a heating value of 31.9±0.33 MJ/kg which is significantly lower than that predicted by the Boie correlation 33.3±0.73 MJ/kg.
Overall, when applying the three HHV correlations, the model predictions agree on the trend that both 𝛥𝐻𝑟,1 and 𝛥𝐻𝑟,𝑓𝑖𝑛𝑎𝑙, become increasingly exothermic with higher temperatures.
The temperature dependence is attributable to three factors: First, the two-stage competitive reaction mechanism results in a strongly temperature-dependent product distribution described by the instantaneous fractional yields, 𝛽, 𝜈, 𝛾, 𝜉, which are terms in equations (18-(20)). As was
discussed in (Bates and Ghoniem, 2012), higher temperatures shift the product distribution towards volatile products, a trend which causes increased exothermicity. Second, the composition of the pseudo components B and C (which is accounted for in 𝐻𝐵 and 𝐻𝐶) in
equations (18-(20) depend on 𝛽, 𝜈, 𝛾, 𝜉. At higher temperatures, B and C show increased carbon
content and therefore a higher heat of formation. Lastly, the sensible enthalpy component, contained in the terms 𝐻𝐴, 𝐻𝐵, 𝐻𝐶, 𝐻𝑉1, 𝐻𝑉2, is inherently temperature dependent. This was
temperatures. Since the temperature range is relatively small (200- 300 ○C), this factor is less significant than the two aforementioned factors.
A couple of works in the literature have discussed the temperature dependence of the heat of torrefaction. (van der Stelt, 2011; Ohliger et al., 2012) found results which agree with the present model predictions: higher temperatures were associated with more exothermic reactions. Both authors hypothesized that at higher temperatures, exothermic secondary reactions occur between the volatiles and the char. (Ohliger et al., 2012) cites results from (Rath et al., 2003) which studied non-isothermal (a temperature ramp at 10 ○C/min) beech and spruce pyrolysis for temperatures between 100-500 ○C. However, it is not clear whether these secondary charring reactions are actually significant under the much milder temperatures associated with
torrefaction (200-300○C). The present modeling results offer an explanation for the temperature-dependence of the heat of torrefaction based on the evolution of primary volatile products alone.
3.3.2. Dynamics of heat release during torrefaction Cumulative heat release
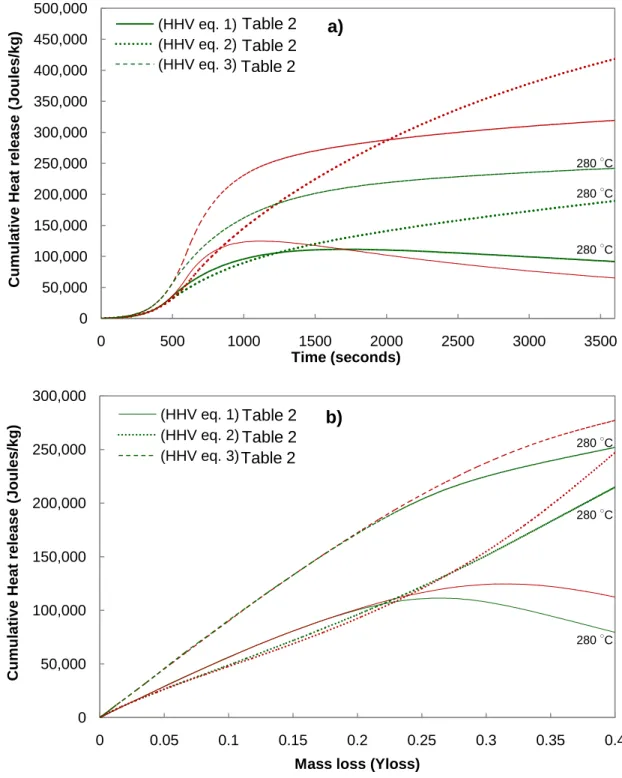
Figure 4a demonstrates the cumulative (integrated) heat release 𝑞𝑟 (in units of J per kg of initial
solid mass) for non-isothermal torrefaction conditions lasting 60 minutes with a heating rate of 10 ○C/min, initial particle temperature of 200 ○C, and final particle temperature of 280 and 300
○
C. Over this period, a mass loss of 48% and 66% of the original solid mass occurs for 280 and 300 ○C, respectively. For both thermal conditions (280, 300 ○C), the cumulative heat release is net exothermic for the entire hour. Using the Boie HHV correlation, the model predicted a maximum in cumulative heat release. This maximum corresponds to the end of stage one (which is the exothermic stage) and the beginning of stage two (which is the endothermic step). On the other hand, applying the Friedl et al. and IGT HHV correlations, the model predicts that the cumulative heat release monotonically increases because both stages are exothermic at these
temperatures. Depending on the assumed HHV correlation, by the end of the 60 minutes, the cumulative heat release is 125 kJ/kg, 325 kJ/kg, and 418 kJ/kg Boie and Friedl, and IGT correlations, respectively.
The cumulative heat release 𝑞𝑟 is plotted versus the solid mass loss in Figure 4b under
the same thermal conditions as those in Figure 4a. Depending on the final temperature, 280 or 300 ○C, the reaction time required to achieve a mass loss of 0.4 kg/kg is 77.5 and 22.8 minutes under these kinetically controlled conditions, respectively. The model results demonstrate that for an equivalent level of mass loss, a higher torrefaction temperature results in a slightly higher cumulative heat release. Using the Boie HHV correlation, the model predicted a maximum exothermic point of torrefaction occurs for a mass loss between 27-32%. The Friedl et al. and IGT HHV correlations do not show maxima. Good quantitative agreement on the magnitude of cumulative heat release exists between the predictions from the three HHV correlations over this mass loss range (0 to 0.4 kg/kg). The predicted heat release is between 0-112 kJ/kg, 0-251 kJ/kg, and 0-276 kJ/kg when applying the Boie and Friedl, and IGT HHV correlations, respectively.
The range of predictions provided by the three correlations agrees well with data from (Ohliger, et al., 2012) which estimated a cumulative heat of release between 50-200 kJ/kg for a mass loss of 33% during beech torrefaction. The model predictions also agree well with the exothermic cumulative heat of torrefaction estimate by (van der Stelt, 2011) from a single particle beech wood torrefaction of 0-200 kJ/kg. The modeling results clearly demonstrate that increasing the torrefaction severity (as quantified by mass loss) results in greater cumulative heat release- lending support to one of the main conclusions made in (Ohliger et al., 2012).
Figure 5a-b illustrate the instantaneous heat release rate, 𝑑𝑞𝑑𝑡𝑟 (W/kg), versus mass loss
and time, respectively, under the same non-isothermal conditions as those in Figure 4. The heat release rate reaches a peak as the particle approaches the final temperature (at 8 and 10 minutes for 280 ○C and 300 ○C, respectively). Afterwards, the particle is maintained at its final
temperature, and 𝑑𝑞𝑑𝑡𝑟 decreases with time past this point. When the Boie HHV correlation is used,
the model predicts that the heat release rate becomes negative as it enters second endothermic stage. For a final torrefaction temperature of 280○C, applying the Friedl et. al, Boie, or IGT HHV correlations, the model predicts peak heat release rates of 170, 200, and 330 W/kg, respectively. At a higher final temperature of 300○C, the predicted peak heat release rates are higher at 274, 327, and 565 W/kg, respectively. This clearly demonstrates that raising the peak torrefaction temperature increases the peak heat release rate. Analysis of equation (15) explains this trend: a higher final torrefaction temperature causes more rapid mass loss kinetics (i.e reaction rate). Since the first stage is exothermic (𝛥𝐻𝑟,1 < 0), a higher reaction rate results in a more rapid heat
release rate.
Since the heat release rate increases with particle temperature, the exothermic reactions predicted by the model could be expected to significantly affect the particle temperature especially in the presence of heat transfer limitations. Based on a specific heat capacity of raw wood (1500-2300 J kg-1K-1), a local exothermic heat release of 140 kJ/kg would cause a
temperature rise of up to 60-90 Kelvin. In order to fully quantify the effect of this heat release, a more detailed single particle model is needed to account for these transport limitations. A follow up publication will be devoted to describing these coupled phenomena.
3.4. Model evaluation and uncertainties
The present model provides a method to predict the energy yield of the solid product and volatile products based on fitted volatile composition and mass loss kinetics parameters. It
confirms the overall exothermicity of torrefaction and provides a fundamental explanation for the temperature-dependence of the reaction thermochemistry. Model predictions for the solid and volatile energy yield, 𝜂𝑆,and 𝜂𝑉𝑡𝑜𝑡 and cumulative heat release, 𝑞𝑟, when using either of the three
HHV correlations appear to agree well with their respective literature data. The predicted reaction enthalpies (𝛥𝐻𝑟,1, 𝛥𝐻𝑟,2, 𝛥𝐻𝑟,𝑓𝑖𝑛𝑎𝑙) are all within the previous experimental estimates
summarized in Table 1.
However, the exothermicity/endothermicity of the second reaction 𝛥𝐻𝑟,2and- as a result- the
rate of heat release 𝑑𝑞𝑑𝑡𝑟, appear sensitive to the assumed HHV correlation. This is because the
magnitude of heat release is less than 4% of the HHV of the dry willow (~18.5 MJ kg-1). At the same time, any error in the estimate of the HHV of solid products is directly and linearly related to the errors in the enthalpy of formation of the solid products. While correlations relating the ultimate analysis of a solid fuel to its heating value have been developed for coal and biomass, no heating value correlations have been fitted specifically for torrefied biomass. With improved correlations, the energy balance of torrefaction process could be modeled more accurately.
4. Conclusion
The development of a thermochemical model coupled to an existing model for the evolution of volatile and solid matter during willow torrefaction was presented. Composition dependent thermodynamic properties of the torrefaction pseudo components were estimated, enabling a description of the rates/magnitude of heat release. The model enables a more robust energy accounting for multi-scale torrefaction models (e.g single particle, reactor, flowsheet models).
The model predicts an exothermic heat release in the first stage, between 40-280 kJ/kgbiomass. The exothermicity of the second stage depends on temperature and the assumed
heating value correlation. Peak heat release rate increases with higher torrefaction temperatures.
Acknolwedgements
References:
1. Almeida, G., Brito, J.O., Perre, P., 2010. Alterations in energy properties of eucalyptus wood and bark subjected to torrefaction: The potential of mass loss as a synthetic indicator. Bioresource Technology 101, 9778–9784.
2. Arias, B., Pevida, C., Fermoso, J., Plaza, M.G., Rubiera, F., Pis, J.J., 2008. Influence of torrefaction on the grindability and reactivity of woody biomass. Fuel Processing Technology 89, 169–175.
3. Bates, R.B., Ghoniem, A.F., 2012. Biomass torrefaction: Modeling of volatile and solid product evolution kinetics. Bioresource Technology 124, 460–469.
4. Bergman, P.C.A., Boersma, A.R., Kiel, J.H.A., Zwart, R.W.R., 2005. Torrefaction for biomass co-firing in existing coal-fired power stations. Energy Research Center of the Netherlands.
5. Bergman, P.C.A., Kiel, J.H.A., 2005. Torrefaction for biomass upgrading. Energy Research Center of the Netherlands.
6. Boie, W., 1953. Fuel technology calculations. Energitechnik 3, 309–316.
7. Bridgeman, T.G., Jones, J.M., Shield, I., Williams, P.T., 2008. Torrefaction of reed canary grass, wheat straw and willow to enhance solid fuel qualities and combustion properties. Fuel 87, 844–856.
8. Friedl, A., Padouvas, E., Rotter, H., Varmuza, K., 2005. Prediction of heating values of biomass fuel from elemental composition. Analytica Chimica Acta 544, 191–198.
9. Goose, E., Burcat, A., Ruscic, B., 2012. Extended Third Millennium Ideal Gas and Condensed Phase Thermochemical Database for Combustion with Updates from Active Thermochemical Tables ( No. ANL 05/20). Argonne National Laboratory.
10. Haseli, Y., van Oijen, J.A., de Goey, L.P.H., 2011. Modeling biomass particle pyrolysis with temperature-dependent heat of reactions. Journal of Analytical and Applied Pyrolysis 90, 140–154.
11. Institute of Gas Technology, 1978. Coal conversion systems technical data book. NTIS, Springfield, VA.
12. Koufopanos, C.A., Papayannakos, N., Maschio, G., Lucchesi, A., 1991. Modelling of the pyrolysis of biomass particles. Studies on kinetics, thermal and heat transfer effects. Can. J. Chem. Eng. 69, 907–915.
13. Kung, H.-C., Kalelkar, A.S., 1973. On the heat of reaction in wood pyrolysis. Combustion and Flame 20, 91–103.
14. Lee, J.-W., Kim, Y.-H., Lee, S.-M., Lee, H.-W., 2012. Optimizing the torrefaction of mixed softwood by response surface methodology for biomass upgrading to high energy density. Bioresource Technology 116, 471–476.
15. Medic, D., Darr, M., Shah, A., Potter, B., Zimmerman, J., 2012. Effects of torrefaction process parameters on biomass feedstock upgrading. Fuel 91, 147–154.
16. Merrick, D., 1983. Mathematical models of the thermal decomposition of coal: 2. Specific heats and heats of reaction. Fuel 62, 540–546.
17. National Institute of Standards and Technology, 2011. Chemical Formula Search [WWW Document]. URL http://webbook.nist.gov/chemistry/form-ser.html
18. Neves, D., Thunman, H., Matos, A., Tarelho, L., Gomez-Barea, A., 2011. Characterization and prediction of biomass pyrolysis products. Progress in Energy and Combustion Science 37, 611–630.
19. Ohliger, A., Förster, M., Kneer, R., 2012. Torrefaction of beechwood: A parametric study including heat of reaction and grindability. Fuel.
21. Prins, M.J., 2005. Thermodynamic analysis of biomass gasification and torrefaction (Ph.D. thesis). Eindhoven University of Technology.
22. Rath, J., Wolfinger, M.G., Steiner, G., Krammer, G., Barontini, F., Cozzani, V., 2003. Heat of wood pyrolysis. Fuel 82, 81–91.
23. Roberts, A.F., Clough, G., 1963. Thermal decomposition of wood in an inert atmosphere. Symposium (International) on Combustion 9, 158–166.
24. Sheng, C., Azevedo, J.L.T., 2005. Estimating the higher heating value of biomass fuels from basic analysis data. Biomass and Bioenergy 28, 499–507.
25. van der Stelt, M.J.C., 2011. Chemistry and reaction kinetics of biowaste torrefaction (Ph.D. thesis).Eindhoven University of Technology.
26. Strezov, V., Moghtaderi, B., Lucas, J.A., 2004. Computational calorimetric investigation of the reactions during thermal conversion of wood biomass. Biomass and Bioenergy 27, 459–465.
27. Turner, I., Rousset, P., Remond, R., Perre, P., 2010. An experimental and theoretical investigation of the thermal treatment of wood (Fagus sylvatica L.) in the range 200-260C. International Journal of Heat and Mass Transfer 53, 715–725.
28. Yang, H., Yan, R., Chen, H., Lee, D.H., Zheng, C., 2007. Characteristics of hemicellulose, cellulose and lignin pyrolysis. Fuel 86, 1781–1788.
Figure Captions
Figure 1 Predicted solid energy yield (-) versus mass loss (-) in figure 1a). Energy densification ratio (-) versus mass loss (-) in figure 1b). Experimental data from (Bergman and Kiel, 2005; Prins, 2005; Arias et al., 2008; Almeida et al., 2010; Medic et al., 2012; Ohliger et al., 2012).
Figure 2 Solid and volatile energy yield (left axis) and heating value of volatiles products (right axis) as a function of mass loss
Figure 3 Enthalpy of reaction (in J kg-1) at temperature (○C) for torrefaction steps one a), two b), and at completion c).
Figure 4 Cumulative heat release (J/kg initial solid) versus time time a) and massloss b).
Tinitial=200 ○C, Heating rate= 10 ○C/min.Tf,= 280, 300 ○C shown as green and red lines,
respectively.
Figure 5 Heat release rate (W/kg initial solid) versus mass loss a) and time b). Positive denotes exothermic. Tinitial=200 ○C, Heating rate= 10 ○C/min. Tf,= 280, 300 ○C, shown in green
and red lines, respectively.
Table titles
Table 1 Experimentally measured or deduced enthalpy of reaction for torrefaction and pyrolysis (-) exothermic, (+) endothermic.
Table 2 HHV correlations based on the ultimate analysis of a solid fuel
Table 3- Feedstocks, temperature ranges, and methodology for determining torrefaction solid product energy yield from six different publications.
Table 4 Specific heat (J kg-1K-1), specific standard enthalpy of formation (J kg-1), and molecular weight for main volatile components (in gaseous phase). V1, V2 properties calculated. Sources: (National Institute of Standards and Technology, 2011; Goose et al., 2012)
Tables and Figures
Table 1 Experimentally measured or deduced enthalpy of reaction for torrefaction and pyrolysis (-) exothermic, (+) endothermic.
Enthalpy of reaction Temperature Range
○C
Feedstock Method Source
87 ±449 kJ/kgbiomass
250 Willow ASTM bomb calorimetry (Prins, 2005)
150 ±1350 kJ/kgbiomass
230-280 Beech Estimated through analysis of
products and reactant
(van der Stelt, 2011) 0 to -200
kJ/kgbiomass
200-280 Beech Deduced from experimental
data with simplified single particle model
(van der Stelt, 2011) -199 to 148
kJ/kgbiomass
270-300 Beech Deduced experimental data
from continuous screw reactor
(Ohliger et al., 2012) 936 to 1277 kJ/ kggas+volatiles -3525 to -3827 kJ/kgchar 100-500 Spruce, Beech Differential scanning calorimetry (Rath et al., 2003) -293 to -1673 kJ/kgmass loss
275-470 Beech Deduced from experimental
data with single particle model
(Roberts and Clough, 1963) 200.8
kJ/kgmass loss
470 Beech Deduced from experimental
data with single particle model
(Kung and Kalelkar, 1973) 255 to -20 kJ/kgmass loss 300-600 Wood sawdust
Deduced from experimental data with single particle model
(Koufopanos et al., 1991) 25
kJ/kgchar,tar,gas
200-850 (Various) Deduced from experimental
data with single particle model
(Haseli et al., 2011) -55.3 to -176 kJ/kgbiomass 100-600 Pine, oak sawdust
Deduced from experimental data with model of packed
sawdust reactor
(Strezov et al., 2004)
Table 2 HHV correlations based on the ultimate analysis of a solid fuel on a dry basis Number Name of correlation Correlation (HHV, J kg-1) Source: (1) Boie 𝐻𝐻𝑉 = 1000[351.69 𝑌𝐶 + 1162.46 𝑌𝐻 − 110.95 𝑌𝑂 + 104.67 𝑌𝑆 + 62.8 𝑌𝑁 ] (Boie, 1953) (2) Friedl 𝐻𝐻𝑉 = 106 35.45 𝑌𝑐 2− 23.15 𝑌𝑐 − 223.35 𝑌𝐻 + 512 𝑌𝐶 𝑌𝐻 + 13.1 𝑌𝑁 + 20.5875 (Friedl et al., 2005) (3) IGT 𝐻𝐻𝑉 = 1000[341.7 𝑌𝐶 + 1322.1 𝑌𝐻 − 119.8 𝑌𝑂+ 𝑌𝑁 − 15.3 𝑌𝐴𝑠 ] (Institute of Gas Technology, 1978)
Table 3- Feedstocks, temperature ranges, and methodology for determining torrefaction solid product energy yield from six different publications.
Source Feedstock Temperature
range (○C)
Residence time (min)
Method of measuring heating value
(Prins, 2005) Willow 250-300 17-38 ASTM bomb calorimetry
(Almeida et al., 2010) Eucalyptus 180-280 60-300 ASTM bomb calorimetry
(Arias et al., 2008) Eucalyptus 280 15-180 Not specified
(Bergman and Kiel, 2005) Willow 280 17.5 ASTM bomb calorimetry
(Medic et al., 2012) Corn stover 200-300 20-31.4 Ultimate analysis with correlation
Figure 1 Predicted solid energy yield (-) versus mass loss (-) in figure 1a). Energy densification ratio (-) versus mass loss (-) in figure 1b). Experimental data from (Bergman and Kiel, 2005; Prins, 2005; Arias et al., 2008; Almeida et al., 2010; Medic et al., 2012; Ohliger et al., 2012). ±0.03 error bars shown for (Ohliger et al., 2012) data.
0.6 0.65 0.7 0.75 0.8 0.85 0.9 0.95 1 0 0.1 0.2 0.3 0.4 0.5 S o lid E n e rg y Y ield ( ηE )
Mass loss (Yloss)
a)
Medic et al., 2011 Prins, 2005
Almeida et al., 2010 Bergman and Kiel, 2005 Ohliger et al., 2012 Arias et al., 2008
Present model (HHV eq. 1) Present model (HHV eq. 2)
1 1.05 1.1 1.15 1.2 1.25 1.3 1.35 1.4 1.45 0 0.1 0.2 0.3 0.4 0.5 Hea tin g v a lue rat io (R HHV )
Mass loss (Yloss)
b)
Medic et al., 2011 Prins, 2005 Arias et al., 2008 Bergman and Kiel, 2005 Almeida et al., 2010 Ohliger et al., 2012
Present model (HHV eq. 1) Present model (HHV eq. 2)
Table 2 Table 2 Table 2 Table 2 Table 2 Table 2
Figure 2 Solid and volatile energy yield (left axis) and heating value of volatiles products (right axis) as a function of mass loss 0 2 4 6 8 10 12 0 0.1 0.2 0.3 0.4 0.5 0.6 0.7 0.8 0.9 1 0.00 0.10 0.20 0.30 0.40 0.50 Hi gh er he ati ng v al ue ( MJ /k g) E ne rgy Y iel d
Mass loss (Yloss) Energy yield of solid product
Energy yield of volatile products
Figure 3 Enthalpy of reaction (in J kg-1) at temperature (○C) for torrefaction steps one a), two b), and at completion c). -300,000 -250,000 -200,000 -150,000 -100,000 -50,000 0 200 220 240 260 280 300 E n th alpy o f Rea ctio n J/k g Temperature (○C) a) (HHV eq. 1) (HHV eq. 2) (HHV eq. 3) -800,000 -600,000 -400,000 -200,000 0 200,000 400,000 200 220 240 260 280 300 E n th alpy o f Rea ctio n J/k g Temperature (○C) b) (HHV eq. 1) (HHV eq. 2) (HHV eq.3) -600,000 -500,000 -400,000 -300,000 -200,000 -100,000 0 100,000 200,000 300,000 400,000 200 220 240 260 280 300 E n th alpy t o f Rea ctio n J/k g Temperature (○C) c) (HHV eq.1 ) (HHV eq. 2) (HHV eq. 3) Table 2 Table 2 Table 2 Table 2 Table 2 Table 2 Table 2 Table 2 Table 2
Figure 4 Cumulative heat release (J/kg initial solid) versus time time a) and mass loss b). Tinitial=200 ○C, Heating rate= 10 ○C/min. Tf,= 280, 300 ○C shown as green and red lines, respectively.
0 50,000 100,000 150,000 200,000 250,000 300,000 350,000 400,000 450,000 500,000 0 500 1000 1500 2000 2500 3000 3500 Cu mu lativ e Heat re lea se ( Jou les /kg) Time (seconds) a) (HHV eq. 1) (HHV eq. 2) (HHV eq. 3) 0 50,000 100,000 150,000 200,000 250,000 300,000 0 0.05 0.1 0.15 0.2 0.25 0.3 0.35 0.4 Cu mu lativ e Heat re lea se ( Jou les /kg)
Mass loss (Yloss)
b) (HHV eq. 1) (HHV eq. 2) (HHV eq. 3) 280 ○ C 280 ○C 280 ○C 280 ○C 280 ○C 280 ○C Table 2 Table 2 Table 2 Table 2 Table 2 Table 2
Figure 5 Heat release rate (W/kg initial solid) versus mass loss a) and time b). Positive denotes exothermic. Tinitial=200 ○
C, Heating rate= 10 ○C/min. Tf,= 280, 300 ○C, shown in green and red lines, respectively.
-100 0 100 200 300 400 500 600 0 0.05 0.1 0.15 0.2 0.25 0.3 0.35 0.4 Heat Rele as e Rat e (W /kg)
Mass loss (Yloss)
a) (HHV eq. 1) (HHV eq. 2) (HHV eq. 3) -100 0 100 200 300 400 500 600 0 500 1000 1500 2000 2500 3000 3500 Heat Rele as e Rat e (W /kg) Time (seconds) b) (HHV eq.1) (HHV eq. 2) (HHV eq. 3) 280 ○C 280 ○C 300 ○C 300○C Table 2 Table 2 Table 2 Table 2 Table 2 Table 2
Appendix A. Thermophysical property data
Table 4 Specific heat (J kg-1K-1), specific standard enthalpy of formation (J kg-1), and molecular weight for main volatile components (in gaseous phase). V1, V2 properties calculated. Sources: (National Institute of Standards and Technology, 2011; Goose et al., 2012)
Chemical name Formula Molecular Weight [g mol-1] cp,gas [J kg-1K-1] 𝐻𝑓,𝑔𝑎𝑠° [J kg-1] 𝐻𝐻𝑉 [MJ kg -1] Acetic acid 𝐶2𝐻4𝑂2 60.052 435.3+2.18T -7,197,978 14.6 Water 𝐻2𝑂 18.01528 1670+0.64T -13,423,383 0 Formic acid 𝐶𝐻2𝑂2 46.0257 474.5+1.753T -8,225,187 5.55 Methanol 𝐶𝐻4𝑂 32.04186 601+2.521T -6,271,172 22.7 Lactic acid 𝐶3𝐻6𝑂3 90.07794 481.6+2.514T -6,775,000 15.1 Furfural 𝐶5𝐻4𝑂2 96.08406 331.09+2.367T -1,556,970 24.4 Hydroxyacetone 𝐶3𝐻6𝑂2 74.07854 494.2+2.338T -4,833,775 21.9 Carbon dioxide 𝐶𝑂2 44.0095 978.4+0.2T -8,941,479 0 Carbon monoxide 𝐶𝑂 28.0101 767+0.4T -3,946,077 10.1 V1 𝐶0.388𝐻1.907𝑂1.229 26.24 1162+0.961T -10,345,151 4.43 V2 𝐶1.362𝐻3.944𝑂1.543 45 601+2.262T -7,078,295 16.3


![[PDF] Cours Introduction aux EDI et la plateforme Eclipse | Formation informatique](data:image/gif;base64,R0lGODlhAQABAIAAAP///wAAACH5BAEAAAAALAAAAAABAAEAAAICRAEAOw==)