HAL Id: hal-02954108
https://hal.archives-ouvertes.fr/hal-02954108
Submitted on 30 Sep 2020
HAL is a multi-disciplinary open access
archive for the deposit and dissemination of
sci-entific research documents, whether they are
pub-lished or not. The documents may come from
teaching and research institutions in France or
abroad, or from public or private research centers.
L’archive ouverte pluridisciplinaire HAL, est
destinée au dépôt et à la diffusion de documents
scientifiques de niveau recherche, publiés ou non,
émanant des établissements d’enseignement et de
recherche français ou étrangers, des laboratoires
publics ou privés.
Metabolome-microbiome signatures in the fermented
beverage, Kombucha
Silvia Alejandra Villarreal Soto, Jalloul Bouajila, Mauro Pace, John Leech,
Paul D. Cotter, Jean-Pierre Souchard, Patricia Taillandier, Sandra Beaufort
To cite this version:
Silvia Alejandra Villarreal Soto, Jalloul Bouajila, Mauro Pace, John Leech, Paul D. Cotter, et al..
Metabolome-microbiome signatures in the fermented beverage, Kombucha. International Journal
of Food Microbiology, Elsevier, 2020, 333, pp.108778. �10.1016/j.ijfoodmicro.2020.108778�.
�hal-02954108�
OATAO is an open access repository that collects the work of Toulouse
researchers and makes it freely available over the web where possible
Any correspondence concerning this service should be sent
to the repository administrator:
[email protected]
This is an author’s version published in: http://oatao.univ-toulouse.fr/ 26525
To cite this version:
Villarreal Soto, Silvia Alejandra
and Bouajila, Jalloul
and Pace, Mauro
and Leech, John and Cotter, Paul D. and Souchard, Jean-Pierre
and
Taillander, Patricia
and Beaufort, Sandra
Metabolome-microbiome
signatures in the fermented beverage, Kombucha. ( In Press: 2020)
International Journal of Food Microbiology, 333. 108778. ISSN 0168-1605
Official URL :
https://doi.org/10.1016/j.ijfoodmicro.2020.108778
Metabolome-microbiome signatures in the fermented beverage, Kombucha
Silvia Alejandra Villarreal-Soto
a, Jalloul Bouajila
a, Mauro Pace
a, John Leech
b, Paul D. Cotter
b,
Jean-Pierre Souchard
a, Patricia Taillandier
a, Sandra Beaufort
a,⁎aLaboratoire de Génie Chimique, UMR 5503, Université de Toulouse, CNRS, INPT, UPS, Toulouse, France bTeagasc Food Research Centre, Moorepark, Fermoy, Co. Cork, Ireland
Kombucha is a fermented tea. Here we investigate the fermentation kinetics, metabolite production, microbiome and potential health promoting properties of three different kombucha consortia. Shotgun metagenomic se-quencing revealed several dominant bacterial genera such as Komagataeibacter, Gluconacetobacter and Gluconobacter. Brettanomyces and Schizosaccharomyces were the most dominant yeasts identified. Species dis-tribution reflected different patterns of sugar consumption, with S. pombe being present in samples with the highest sugar conversion. Liquid-liquid extractions were performed with organic solvents in order to obtain dried extracts, which were later characterized. HPLC-DAD and GC-MS analysis revealed differences in the production of organic acids, sugars, alcohols and phenolic compounds, where the presence of caffeine, propanoic acid and 2,3 butanediol differ greatly across the three kombuchas. Metabolomic analysis exhibited a link between the microbiota and the production of bioactive compounds in kombucha fermentation. In vitro assays were carried out in order to evaluate potential health-promoting features of the fermented teas, with notable outcomes in-cluding antioxidant ability against DPPH radical and against the 15-lipoxygenase enzyme, indicating a potential anti-inflammatory activity. These investigations considerably enhance our understanding of the relationship between the microbiota and metabolites as well as health promoting potential of kombucha and have the po-tential for the development of future generations of kombucha products in which these relationships are opti-mized.
1. Introduction
Successful interactions between bacteria and yeast species can lead to the generation of a wide range of metabolites with interesting bioactivities, including those resulting from fermented beverage pro-duction. The microbial community responsible for kombucha (fer-mented tea) production is embedded in an extracellular polymeric matrix (pellicle) that is located at the liquid-air interphase (Nikolaev and Plakunov, 2007). The tea is also commonly inoculated with 10–20% of broth from a previous kombucha fermentation ( Četojević-Simin et al., 2012;Malbaša et al., 2006;Rosma et al., 2012), allowing the microbial population to disperse in the liquid media. The char-acteristic kombucha microbiome includes several genera of acetic acid bacteria, yeasts and, to a lesser extent, lactic acid bacteria. Some studies (Coton et al., 2017;Marsh et al., 2014) have revealed Komagataeibacter, Acetobacter and Gluconobacter as the dominant bacteria genera, and Brettanomyces and Zygosaccahromyces as the dominant yeast. These microorganisms interact through cooperative metabolism, contributing to the synthesis and organoleptic qualities of thefinal beverage. Several
metabolic reactions occur during kombucha fermentation leading to the production of intermediates and secondary metabolites, with potential applications in the pharmaceutical, cosmetic and food industries (Villarreal-Soto et al., 2018). Acetic acid bacteria are known to convert sugars and alcohols into several organic acids, such as acetic, gallic, succinic and malic acids (Gomes et al., 2018). The genus Gluconaceto-bacter and KomagataeiGluconaceto-bacter are cellulose producing Gluconaceto-bacteria that also participate in the production of gluconic and glucuronic acid by an oxidation reaction with the enzyme glucose dehydrogenase (Ramachandran et al., 2006). Yeasts are also important contributors due to their high fermentative capabilities, releasing high quantities of polysaccharides, great efficiency with respect to the utilization of available nitrogen sources and high level of resistance to osmotic and ethanol stress (Domizio et al., 2017;Steensels et al., 2015). Thus, the production of important compounds is directly related to the specific microbiota and the cross-feeding between them. In addition to the composition of the pellicle, the factors that will dictate the growth and activity of kombucha consortia include the substrate (Ayed et al., 2016;
Četojević-Simin et al., 2012;Hoon et al., 2014;Rahmani et al., 2019; ⁎Corresponding author.
E-mail address: [email protected](S. Beaufort).
resuspended in 550μL of SL buffer. The sample was then treated fol-lowing the same protocol mentioned above.
Kombucha samples (liquid and solid phases from the end of the fermentation) were sequenced on the NextSeq sequencing platform Illumina, (San Diego, CA, USA) in the Teagasc sequencing facility (Moorepark, Cork, Ireland). Library preparation was carried out ac-cording to the Illumina Nextera XT protocol Illumina Inc., (San Diego, CA, USA). Quantification of DNA was performed using the Invitrogen Qubit High Sensitivity dsDNA assay (ThermoFisher scientific, Waltham, MA, USA). Final library quality was assessed by running on an Agilent High Sensitivity DNA chip (Agilent Technologies, Waldbroon, Germany), and quantification by qPCR using the KAPA Library Quantification Kit for Illumina (Roche). Sequencing was carried out using a 300 cycle High Output V2 kit, following standard Illumina se-quencing protocols as described byDoyle et al. (2017).
Sequence reads were obtained from the Nextseq sequencing run in the form of Bclfiles. These files were converted to fastq format using bcl2fastq v. 2.19 illumina software. Using Picard v. 2.7.1 (available at
http://picard.sourceforge.net), fastq was converted to Sam format. Picard was also used to remove duplicates. The sequences were then quality checked and trimmed using bwa v. 0.7.15 (Li and Durbin, 2009). Forward and reverse reads were combined into a single fastafile for each sample.
Kaiju (Menzel et al., 2016) was used to assign taxonomy to the reads, discarding taxa with relative abundance of less than 0.1%. This setting was chosen as other studies have shown a high false positive discovery rate below this threshold. All percentages reported at all taxonomic levels are percentages of the assigned reads only. Summary plots were created in R version 3.6.0 (R Core Team, 2014) using the package ggplot2 v. 3.1.0 (Wickham, 2009). Superfocus v. 0.34 (Silva et al., 2016) and was used to assign functionality to the reads.
Melonnpan v. 0.99 (Mallick et al., 2019) (Predictive metabolomic profiling of microbial communities using amplicon or metagenomic sequences) was used to predict the metabolites produced from each microbiome. The top 50 predicted metabolites were then plotted using ggplot2 v. 3.1.0 in0 R.
Metagenome assembly was carried out using IDBA-UD to assemble contigs. MetaBAT 2 (Kang et al., 2015) was implemented for genome binning, with default settings. CheckM (Parks et al., 2015) was then used to check the quality of metagenome assembled genomes (MAGs). Low quality MAGs, i.e. < 80% completeness and/or > 10% con-tamination, were removed from downstream analysis. FastANI (Jain et al., 2018) was used to assign taxonomy to the MAGs.
2.4. Sugars, ethanol and acetic acid quantification
Sugar consumption and metabolites production were analyzed in the liquid phase by ultra-performance liquid chromatography (UPLC-RI) (Thermo Scientific, Dardilly, France) according to the method de-scribed byVillarreal-soto et al. (2019). Analysis ranges varying from 1.25–10.00 g/L were used for the quantification of sucrose, glucose, fructose and ethanol as standards solutions and for glycerol and acetic acid a range from 0.25–2.00 g/L was used.
2.5. Liquid-liquid extractions and biological assays
Sequential liquid-liquid extractions with organic solvents (ethyl acetate and butanol) were performed with the kombucha samples at the end of the fermentation. The solvents were then evaporated using a vacuum rotary evaporator at 35 °C (RV 10 Auto VWR, IKA, Staufen, Germany) in order to obtain a dry extract.
Stock solutions were prepared from each dry extract in a con-centration of 3 mg/mL, using DMSO 100% as solvent. Then, for all biological evaluations the stock solutions were tested initially at 50μg/ mL and at 25μg/mL or 5 μg/mL in the case of high inhibition per-centages (> 70%) in order to calculate the IC50 using the linear
Watawana et al., 2015a, 2015b) sources of carbon used (Reiss, 1994;
Vohra et al., 2019;Watawana et al., 2015a, 2015b) and fermentation parameters (Cvetković et al., 2008; Villarreal-soto et al., 2019). As a result, the fermented teas can have quite different properties and che-mical compositions. While all of these aforementioned parameters considerably influence the bioprocessing of kombucha tea, these factors have in general been studied in isolation, and thus the relationship between bioactive molecule production and microbial metabolism has, to date, not been fully understood. Developing a deeper understanding of the links between all of these elements can be of considerable value with respect to optimizing the fermentation process and its final func-tionality. In this study, three different kombucha consortia were used to investigate their kinetics, microbial diversity via high-throughput se-quencing, chemical composition and respective functional profile. This research is of relevance to kombucha fermentation globally, generating knowledge that will facilitate optimization of the process to yield de-sirable end products.
2. Materials and methods 2.1. Starter cultures
The kombucha pellicles used in this study were obtained from dif-ferent origins. The first was obtained from local people of Toulouse, France (F), the second, from a commercial bottle of kombucha tea and reconstituted as described in Section 2.2 (G), and the third one was bought from the website www.jemangevivant.com (H). The choice of the suppliers was done randomly in order to study the impact of the specific microbiota over the biological profile of the fermented teas and because of its availability. All the pellicles were fermented three times before experimental use in order to stabilize the microbial consortium. The protocol described below is used in order to preserve the pellicles as a stock for later experiments.
2.2. Preparation of kombucha tea
Black tea was prepared according to the following procedure: 70 g of sugar were added to 1 L of water at 40 °C. Once the water reached 80 °C, 10 g of black tea (Royal Ceylan, Lipton ®) was added and allowed to infuse for 15 min. The tea was then removed and the infusion was left to cool. After the infusion was cooled to room temperature (25 °C), tea was poured into 2 L glass containers (ratios: s/h = 9.02 cm, s/ v = 0.132 cm−1) and 20 mL/L of the previous fermented liquid media, 10 mL/L of cider vinegar and 20 g/L of pellicle were added. The vessels were covered with cheesecloth and incubated at 25 °C for 15 days. All fermentations were performed in duplicate.
2.3. Shotgun metagenomic analysis
Samples for DNA extraction were taken after 15 days from both the tea and the pellicle. The Geneall Exgene Soil SV extraction kit was used for all extractions, with some modifications. For the pellicle DNA ex-traction, 0.8 g were removed and washed twice in 500 μL of sterile water, cut into smaller pieces and placed in a powerbead tube. Then, 550 μL of SL buffer, 90 μL of lysozyme (50 mg/mL) and 50 μL of mu-tanolysin (100 μL/mL) were added. The mixture was incubated at 60 °C for 15 min with occasional vortexing. Twenty-eight μL of proteinase K were then added, with further 15 minute incubation, including occa-sional vortexing. The tube was then placed in a bead beater (Qiagen Tissue lyser 2) for 10 min at 20 oscillations/s. The manufacturer's in-structions were then followed, including pelleting and washing steps, with a final volume of 30 μL of elution buffer added at the final step.
Sample DNA extractions were performed by resuspending kom-bucha tea sample by stirring and 50 mL of tea were collected in a 50 mL falcon tube. Then the tube was centrifuged at 5000 rpm for 10 min at room temperature. The supernatant was discarded and the pellet was
= −
%inhibition 100 (Abs(control) Abs(sample))/Abs(control)
2.5.2. Anti-inflammatory activity
This biological assay was performed against the enzyme 15-LOX using a previously described method (Villarreal-soto et al., 2019). One hundred and fifty microliters of 100 mM phosphate buffer (pH 7.4), 20μL of the extract solution at a concentration of 3 mg/mL, 60 μL of linoleic acid (3.5 mmol/L), and 20μL of 5-LOX (Soybean 500 U) were placed in a 96-well plate. The mixture was then incubated at 25 °C for 10 min and the absorbance was measured at 234 nm. The anti-in-flammatory activity was defined as the percentage of inhibition of the 15-LOX enzyme. Nordihydroguaiaretic acid (NDGA) was used as a standard.
2.5.3. Antiproliferation evaluation
Antiproliferation test of kombucha extracts on human colon cancer (HCT-116) and human breast cancer (MCF7) cell lines was estimated as described previously (Villarreal-soto et al., 2019). Cancer cells were maintained at 37 °C in a humidified 5% CO2 incubator (NBS Eppendorf, Germany) using Dulbecco's modified Eagle's medium (DMEM, Sigma Aldrich, USA) for the human breast cancer cell line and RPMI-1640 (Sigma Aldrich, USA) for the colon cancer cell line, respectively. Cells were then seeded in 96-well plates at a concentration of 3 × 10⁴cells/ well in 100μL of culture medium, and then 100 μL of culture medium containing each sample at different concentrations were added. Non-treated cells were used as a control for the growth inhibition. The plates were incubated at 37 °C for 48 h, then the supernatant was then re-moved and 50μL of MTT solution were added followed by an incuba-tion for 40 min. After removing the MTT reagent (Sigma, M-5655), 80 μL of DMSO were added to solubilize the formazan crystals. The absorbance was measured at 605 nm. All extracts were re-suspended in DMSO followed by dilution in the buffer so that the DMSO did not exceed 1% as cells continue to multiply at this concentration. Tamox-ifen was used as a positive control.
2.5.4. Phenolic and aromatic compounds determination
The dried extracts were injected at a concentration of 20 mg/mL of acetonitrile and water (20:80 v/v) and then phenolic and aromatic compounds were identified and quantified by HPLC-DAD (Thermo Scientific Dionex Ultimate 3000). Standard solutions were separately prepared at concentrations of 50, 20, 10, 5, and 1 mg/L using a (80:20 v/v) water/acetonitrile solution. Chemical composition was performed by gas chromatography–mass spectrometry (GC–MS) Varian Saturn 2000 (Les Ulis, France). Total phenolic composition was quan-tified using the Folin-Ciocalteu assay.
3. Results and discussion
3.1. Fermentation kinetics of different consortia and their produced metabolites
Sugar consumption and the production of the primary metabolites Fig. 1. Evolution of the main compounds during kombucha fermentations. All the data are average values of triplicate analysis. Sucrose left Y-axis, Glucose, Fructose, Glycerol, Ethanol and Acetic acid, right Y-axis.
equation (y = mx + b). Where the obtained value is the percentage of inhibition as a function of the log [concentration]. Dilutions were made in order to obtain a final DMSO concentration below 1% in each well. The non-fermented tea (NF) was also evaluated.
2.5.1. Antioxidant activity
The DPPH assay was measured according to a previously described method (Villarreal-soto et al., 2019). Twenty microliters of the Kom-bucha fermented extracts were mixed with 180 μL of a 0.2 mM me-thanolic DPPH solution. The reaction mixture was then incubated at 25 °C for 30 min. A control experiment was also performed using as-corbic acid as a standard with the same procedure without the sample and the absorbance was read at 520 nm. The free radical-scavenging activity of each sample was then calculated by using the following formula:
across the respective kombucha fermentations were analyzed. Despite the fermentation conditions remaining constant, differences in the specific microbial populations present had an impact on the kinetics and evolution of the process. Differences in the levels of sugar con-version were observed between days 0 and 3 (Fig. 1), where a 10 fold difference was apparent between the samples. The concentration of residual sugar was greatest for consortium H (~35 g/L), which may explain why ethanol production was lowest (6 g/L) in this sample after 15 days of fermentation. Sucrose was hydrolyzed into glucose and fructose in all cases. However, the manner in which they were con-sumed differed (Fig. 2). In sample F, sugars were completely depleted at 12 days, while for kombuchas G and H, sugars remained in the media. As noted kombucha H was extreme in this regard. More specifically, in this case fructose reached 12 g/L after 15 days. A similar sugar profile was observed by Chen and Liu (2000)andKallel et al. (2012)were fructose was poorly metabolized compared to glucose, probably be-cause the latter is used for the biosynthesis of cellulose and for the production of organic compounds, such as gluconic acid, or because it is preferred as a carbon source by the specific kombucha microbiota present. However, it should be noted that in another kombucha study,
Sievers et al. (1995)observed that fructose was metabolized prior to glucose, again possibly due to differences in the specific microbial composition and/or initial carbon source (Malbaša et al., 2008). Acetic acid concentrations were similar across the three samples regardless of sugar consumption or ethanol production, reflecting the ability of the microbial populations present to use several metabolic pathways to produce acetic acid (Gomes et al., 2018).
3.2. Metagenomics of solid and liquid phases
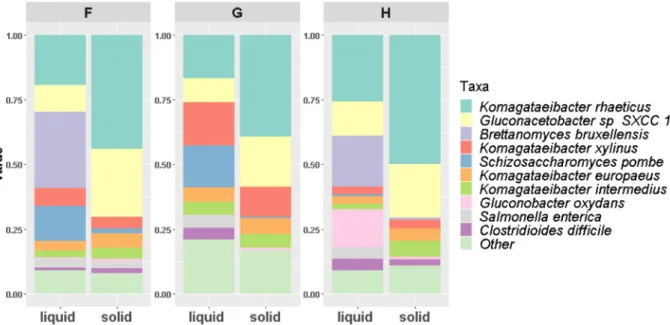
Shotgun metagenomics was used to examine the microbiota of these three kombucha communities (solid and liquid phases) after 15 days (Fig. 3). The relative abundance of bacteria was 2-fold higher in the pellicle than in the liquid phase with the relative abundance of yeast being highest in the liquid phase in all cases. Actinobacteria and Pro-teobacteria were identified in all samples, with Acetobacteraceae being the dominant family. In the case of the yeasts, the dominant taxa be-longed to the Saccharomycetaceae and Schizosaccharomycetaceae fa-milies, both of which correspond to the phylum Ascomycota. 3.2.1. Microbial taxonomy
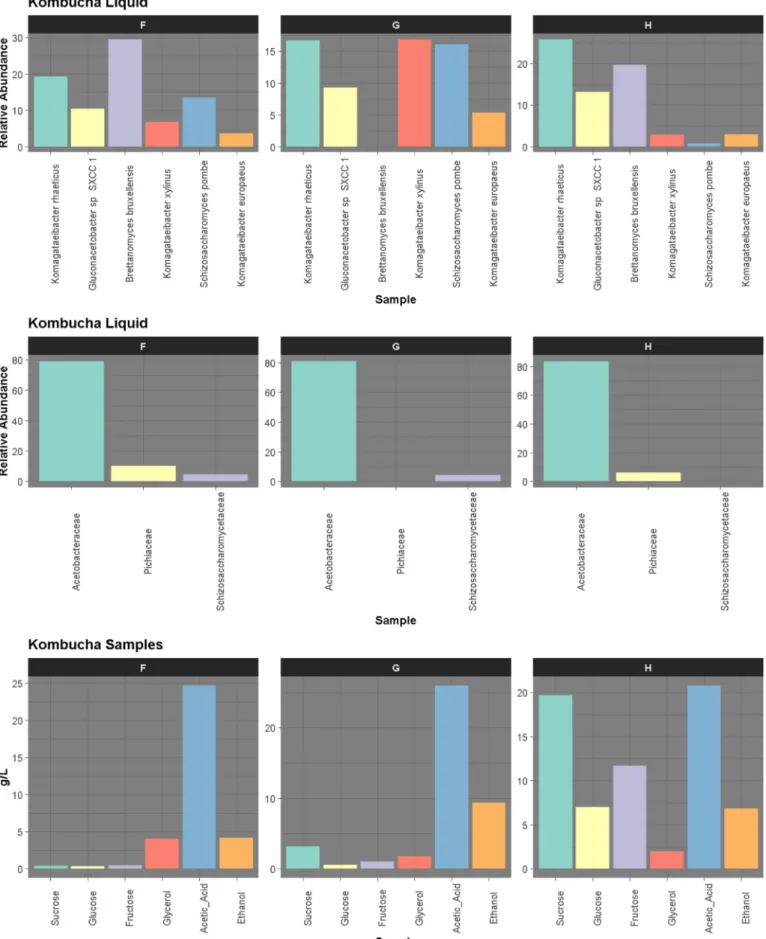
Almost 80% of the microbes present were Acetobacteraceae, with the dominant genera being Komagataeibacter, Gluconacetobacter and Gluconobacter (Fig. 4). Several species from the genus Acetobacter genus were also identified (A. malorum, A. pasteurianus, A. pomorum, and A. tropicalis). More specifically, at the species level, Komagataeibacter rhaeticus was the dominant bacteria (16–49%), followed by
Gluconacetobacter sp. SXCC1 (9–26%), both being present in greatest proportions in the solid phases (Fig. 3). Komagataeibacter xylinus had a higher abundance in the liquid (16.89%) of kombucha G. Notably, it has been noted that strains from this species have an ability to survive gastric conditions, such as low oxygen pressure and the presence of bile salts and acidity (Lavasani et al., 2019).Fig. 4also shows the quantity of sugars, acetic acid, glycerol and alcohol for the three consortia. The most notable difference between the three liquid phase compositions is the low levels of Schizosaccharomycetaceae (S. pombe at species level) in H, which corresponds to the highest levels of all sugars left at the end of the experiment.
Four genera of yeast, i.e., Candida arabinofermentans, Brettanomyces bruxellensis, Schizosaccharomyces pombe and Zygosaccharomyces bailii, were identified across the three kombuchas.
The dominant fungal species, found primarily in the liquid phases, were B. bruxellensis (29.56%) and S. pombe (16.11%). Similar results were obtained byCoton et al. (2017), who revealed that their relative abundance changed with time. At day zero, most of the yeasts were found in the solid phase while at day 8 their abundance in the liquid increased. The same pattern was observed in this study, where yeasts proportion was higher in the liquid phases after 15 days of fermenta-tion. From the perspective of individual kombuchas, sample F had the highest proportion of S. pombe and B. bruxellensis in the liquid phase. This may explain it having the fastest rate of sugar consumption (Fig. 2) and highest levels of ethanol production (17 g/L). However, B. brux-ellensis was not detected in the liquid or solid phase of sample G, which had the slowest rate of sugar consumption and hydrolysis. As noted, even though Gluconacetobacter and Brettanomyces typically dominate the kombucha microbiome, several studies have highlighted variability (Coton et al., 2017;Marsh et al., 2014;Reva et al., 2015;Teoh et al., 2004).
Salmonella enterica-associated reads were assigned by Kaiju in all 3 liquid samples and one solid sample, H, at abundances from 2.6% to 4.6%. While Kaiju was chosen as it outperformed other classifiers (Kraken2 (Wood and Salzberg, 2014) and Bracken (Lu et al., 2017)) with respect to assigning the eukaryotic-associated reads, a vital con-sideration with respect to kombucha fermentation, Kaiju's reliance on the NR database, which has a disproportionate amount of pathogenic taxa due in part to their importance to science and medicine. Notably Salmonella was undetected above the 0.1% threshold by other classifiers and no Salmonella metagenome-associated genomes (MAGs) were gen-erated. Metagenome-Assembled Genomes (MAGs) were also assembled for all kombucha samples. Seventeen medium quality MAGs were produced in total (above 80% complete, less than 10% contamination). These MAGs were all members of the Gluconobacter, Komagataeibacter and Pseudomonas genera with no MAGs being assembled for Salmonella. This adds further evidence that Salmonella was not in the samples, but Fig. 2. Evolution of average hydrolysis (left) and sugars consumption (right) rates for the three fermentations of kombucha.
some of the short reads (prior to assembly) were being mapped to Salmonella due to the large number of Salmonella genomes in the NR database.
3.3. Functional profile
The functional profile of the three kombucha samples, as assessed by SuperFocus, was relatively homogenous. However, some differences were observed (Fig. 5). The kombucha H microbiota had the lowest proportion of genes associated with carbohydrate metabolism and re-spiration, reflecting the associated taxonomy and possibly explaining the higher quantities of sugar remaining in this sample. A deeper ana-lysis (supplementary) reveals that, more specifically, kombucha H had less pathways involved in fermentation and central carbohydrate me-tabolism than kombucha F and G. Kombucha G had the highest abun-dance of pathways involved in sugar alcohols and was also the sample in which ethanol concentrations were highest at the end of the fer-mentation. Other interesting differences from the perspective of kom-bucha manufacturing include several amino acid synthesis pathways (such as the superpathway responsible for branched amino acid bio-synthesis, ~0.2% higher in Kombucha H than both other samples) and the highest abundance of acetyl-CoA biosynthesis in Kombucha H (~0.5% higher than both F & G). Analysis of the data using Melonnpan was also performed. Melonnpan is a software tool used to predict the potential metabolites of a microbiome. Although many metabolites were measured (see subsequent sections), Melonnpan had the potential to predict if other desirable metabolites are produced in the samples. The predicted metabolites from this analysis were similar across the pellicle and tea samples from all kombuchas (Fig. 6). A secondary bile acid, deoxycholic acid, was predicted to be the most abundant meta-bolite in all cases. Deoxycholic acid is important in both human health research (Deeks, 2016) and in industry (Kim et al., 2005). Its use as an emulsifier of fats in particular is driving the growth of its value globally. Glutamate was predicted to be the next most abundant metabolite. Glutamate is a neurotransmitter and is known for its role in mental health (Cryan and O'Leary, 2010). The profile also includes many short chain fatty acids, polyunsaturated fatty acids, other bile salts, vitamins (mostly B vitamins), and volatile compounds.
3.4. HPLC analysis of phenolic compounds
Polyphenols are major plant secondary metabolites that exhibit a
remarkably diverse range of bio-physicochemical properties, and are ubiquitous in plant extracts (Quideau et al., 2011). HPLC analysis was performed in order to identify the main phenolic compounds produced in the 3 kombucha beverages (Table 1). Gallic acid was produced by the three consortia in similar concentrations. This is consistent with the presence of genes encoding the enzyme responsible for gallic acid production, i.e., shikimate dehydrogenase, across all three micro-biomes. Catechin and epicatechin decreased after fermentation in all cases.Jayabalan et al. (2007)observed the same pattern when studying the changes in tea polyphenols during kombucha fermentation and attributed the phenomenon to biodegradation by enzymes secreted by yeasts and bacteria. This decrease was also observed byPayne et al. (2010)when studying the fermentation of cacao beans but, in contrast, a previous kombucha study (Villarreal-soto et al., 2019) noted an in-crease in catechin concentrations after a 21 day fermentation when a higher surface/height ratio was employed. Caffeic acid, previously observed to be produced from the microbial conversion of other phe-nolic acids (Lin and Yan, 2012), increased after fermentation. Some observations related to specific kombuchas only, for example, theo-bromine, rutin and chlorogenic acid production was favored by con-sortium G. It was also noted that only trace amounts of coumaric, ferulic and trans-cinnamic acids were found after fermentation across all three kombuchas. This may be due to the ability of Brettanomyces bruxellensis to catalyse the transformation of ρ-coumaric and ferulic acids into vinyl- and ethyl-phenols (Romano et al., 2008).Fig. 7shows the high-resolution separation of 22 compounds in the ethyl acetate extracts of the three different consortia. A number of these compounds were identified and quantified as 3-gallic acid; 13-chlorogenic acid; 18-coumaric acid; 19-ferulic acid; 20-taxifolin and 22-trans-cinnamic acid (Table 1). When comparing patterns to those of non-fermented tea, it was observed that several compounds were transformed. Moreover, compounds 2, 8 and 12 were produced after fermentation, but their presence varied depending on the kombucha tested.
As depicted (Fig. 7), a number of notable differences were observed in the case of kombucha F, with gallic acid and compounds 4 and 5 greatly increasing after fermentation and compound 9 being unique to this community. In addition, peak“a” was completely transformed after fermentation of kombucha F, but remained in the other two kombu-chas.
3.5. Gas chromatography-mass spectrometry analysis of kombucha metabolites
GC–MS also contributed to metabolite analysis and led to the identification several organic acids, sugars, alcohols and phenolic compounds (Table 2). Before derivatization, 2,2-methylenebis(4-me-thyl-6-tert-butylphenol) was the only compound detected in the ethyl acetate extracts from any of the three kombuchas or the non-fermented tea. In order to improve the identification and volatility of the produced compounds, silylation was performed, leading to the detection of twenty-six compounds. Organic acids such as isovaleric, succininc, malic, pentanoic and citric were predominantly found, in similar
proportions, in kombuchas F and H, but propanoic acid was present in 4- fold higher abundance in sample (H). Kombucha G had the lowest levels of organic acids, corresponding to the absence of B. bruxellensis (Andrade et al., 2007). Succinic acid is a dicarboxylic acid produced mainly as an intermediate of the tricarboxylic acid cycle during aerobic respiration and is also one of the fermentation end products of anae-robic metabolism (Chidi et al., 2018). The formation of organic acids, such as succinic acid, is reported to vary significantly with different fermentation conditions (Lamikanra, 1997). Its production also varies according to the microbial population, as was also observed in this study.L-(-)-Sorbofuranose was only detected in Kombucha F, but
sev-eral sugars were unique to kombucha H, which was also the kombucha Fig. 5. Differences in the SuperFocus Level 1 pathways. A) Shows what pathways G and H have a higher relative abundance of (in red), or lower relative abundance of (in blue) than sample F. B) Shows samples F and H compared to G, and C) shows samples F and G compared to H. (For interpretation of the references to colour in thisfigure legend, the reader is referred to the web version of this article.)
with the highest concentration of residual sugars afterfifteen days of fermentation. 2,3 butanediol, 2-phenylethanol, glycerol and 2-(4-hy-droxyphenyl) ethanol were detected in all the samples, with the ex-ception that 2-phenylethanol was not detected in kombucha G. The greatest proportions of these compounds were produced in kombucha F, which was also the fermented tea with the highest level of ethanol production (18 g/L). Among other detected compounds, all of the produced phenolic compounds were present in the three kombuchas in similar proportions, except from catechin, which was only detected in
kombuchas F and H. Results from a previous study (Villarreal-soto et al., 2019) showed higher quantities of glycerol production compared to those observed here, possibly as a consequence of the differences in the fermentation kinetics. Even if most of the yeast species have similar central carbon metabolic pathways, differences in nutrient uptake and utilization, as well as in the regulation of fermentation and respiration, may yield different secondary metabolites (Chidi et al., 2018) Fig. 6. Melonnpan results showing the top 50 most abundant predicted metabolites from F, G and H. Both the predicted metabolites from the SCOBY and Tea sequences are shown in the plot.
3.6. Biological evaluation of Kombucha teas
In the interest of evaluating the beneficial potential of the fermented teas different in-vitro assays were performed.
3.6.1. Antioxidant capacity and total phenolic composition
As observed previously, similar concentrations of phenolic com-pounds were obtained in the non-polar extracts of all our samples (Fig. 8). Ethyl acetate has also been reported to extract the highest amount of total phenolic compounds and total flavonoids in some previous studies (Boussoussa et al., 2014;Rahmani et al., 2019). Gallic acid showed its highest concentration in the ethyl acetate extracts ac-cording to the HPLC-DAD analysis. This acid has been found to exhibit the greatest antioxidant capacity among various polyphenols (Badhani et al., 2015), which may explain why the highest inhibition percentage against the DPPH radical was achieved with the non-polar extracts obtained in this study. The attained inhibition percentages are higher than those reported by other authors (Malbaša et al., 2011;Vohra et al., 2019), who established around 60% of inhibition after 7–10 days of fermentation. The antioxidant activity of the phenolic acids is affected by several factors such as the phenolic aromatic arrangement or the position of the hydroxyl group (Badhani et al., 2015). In addition, the extraction of the phenolic compounds depends on their polarity and the affinity for the organic solvent. This could explain the difference in the total phenolic compound composition and consequently in the anti-oxidant activity of the butanolic extracts and aqueous phases. It can be observed (Fig. 8) that the phenolic composition of the ethyl acetate extracts is 2-fold higher than that of the butanolic extracts. Never-theless, the extraction yields of the ethyl acetate extracts are lower than those of the butanolic extracts (Fig. 9). Both extracts exhibit similar inhibition percentages against the free radicals at 50μg/mL. A higher concentration of its IC50value, of 16 μg/mL was obtained with the butanolic extracts compared to 7μg/mL with the ethyl acetate extracts (Table 3). Suggesting that the non-polar phenolic compounds are more stable and thus have a higher antioxidant activity. The higher anti-oxidant activity of the ethyl acetate extracts could be related to the higher presence of gallic acid in the three consortia (11,997.7–13,020.9 mg/kg of dry extract), however no other com-pound was detected in similar concentrations in the butanolic extracts, which also showed a good antioxidant activity. This suggests that there may be other phenolic compounds present, responsible for preventing the oxidation that were not quantified in this study.
3.6.2. Anti-inflammatory activity
The anti-inflammatory activity of kombucha tea, as revealed by in vitro assays, has been reported previously (Vázquez-Cabral et al., 2017;
Villarreal-soto et al., 2019), highlighting improved inhibition of some enzymes responsables of inflammation by kombucha relative to un-fermented tea. It is thought that the bioactivity of thefinal product is directly related to the processing technologies and its microbial and chemical composition (Michalska and Grzegorz, 2015). In the present study, it was observed (Fig. 10) that the highest anti-inflammatory activity after fermentation was obtained with kombucha G with an inhibition percentage of 44.5%, followed by 28% with consortium (H) in the ethyl acetate extracts. These results confirmed that kombucha consortia have anti-inflammatory potential against the 15-lipoxygenase enzyme.
3.6.3. Antiproliferative activity on human tumor cell lines
The anti-cancer effect of kombucha extracts against the human cancer cell lines HCT-116, MCF-7 and OVCAR was investigated. The samples showed a higher selective anti-proliferative activity against HCT-116 line in the case of the butanolic extracts compared to the non-fermented tea (Table 4). In particular, kombucha G extracts seemed to best inhibit this cell line, with a 50% increase in inhibition being ob-served with the ethyl acetate and butanol extracts from the 21 day of
Table 1 Content of phenolic compounds, theobromine and ca ff eine from black tea (NF) and kombucha extracts by HPLC (mg/kg of dry extract). Compound Sample Gallic acid Theobromine Catechin Chlorogenic acid (− )-Epicatechin Ca ff eic acid Ca ff eine ρ-Coumaric acid Ferulic acid Rutin Taxifolin Trans-Cinnamic acid NF-EtOAc 50 ± 1.8 337.8 ± 1.8 205.3 ± 1.6 44.4 ± 0.5 27.2 ± 0.3 NF-BuOH 25.9 ± 0.0 114.5 ± 0.7 NF-H2 O 5.06 ± 0.0 1.02 ± 0.1 1.4 ± 0.5 3.3 ± 0.0 F-EtOAc 11,997.7 ± 771.9 3.1 ± 0.6 F-BuOH 2407.7 ± 73.6 0.5 ± 0.3 3.1 ± 0.2 F-H2 O 54.3 ± 4.5 54.3 ± 5.6 1.7 ± 0.0 11.3 ± 0.0 0.1 ± 0.0 0.2 ± 0.0 0.1 ± 0.0 G-EtOAc 12,966.5 ± 285.7 493.6 ± 0.0 155.6 ± 0.0 G-BuOH 490.0 ± 142.5 414.5 ± 11.3 18.7 ± 0.5 G-H2 O 178.0 ± 61.8 25.5 ± 2.1 0.1 ± 0.0 0.1 ± 0.0 H-EtOAc 13,020.9 ± 66.8 20.7 ± 1.3 H-BuOH 1319.5 ± 76.3 1.2 ± 0.3 H-H2 O 20.1 ± 0.5 9.7 ± 0.0 0.1 ± 0.0 0.1 ± 0.0
fermentation compared to the non-fermented tea. This antiproliferative effect against human colon cancer cells has been previously reported by
Jayabalan et al. (2011) andVillarreal-soto et al. (2019), who found greater inhibition after fermentation reaching around 60%. In the case of the MCF-7 cancer cell line, kombucha F showed a slight increase in activity after 15 days of fermentation compared to the non-fermented tea. However, the remaining extracts did not show any increase in ac-tivity compared to the control. Moreover, kombucha extracts did not show cytotoxic activity against the OVCAR cancer cells. Indeed, in this instance cytoxicity decreased with fermentation.
4. Conclusions
The study of metagenomic DNA from the solid and liquid phases of three kombucha consortia revealed differences across kombuchas and between the two phases. Fermentation kinetics showed an association between the microbiota and sugar consumption as well as secondary metabolite production. Some similarities were observed between the three different microbial populations. The most abundant species of bacteria were the same in all the samples, differing only in relative abundance. The yeast populations differed most considerably and, as a consequence, the sugar profile differed, in a manner that reflected the presence or absence of S. pombe. Microbiota differences also corre-sponded with difference in the biological profiles of the obtained teas, Fig. 7. HPLC chromatograms of (a) ethyl acetate and (b) butanol kombucha extracts from the three consortia.
with extracts from kombucha G, which contained the highest relative abundance of Komagataeibacter xylinus in both solid and liquid phases and Schizosaccharomyces pombe in the liquid phase, demonstrating the greatest anti-inflammatory and anti-proliferation activities.
Chemical group Compound NF F G H
EtOAc BuOH H2O EtOAc BuOH H2O EtOAc BuOH H2O EtOAc BuOH H2O
Without derivatization
Phenolic 2,2-Methylenebis(4-methyl-6-tert-butylphenol) 550 505 127 500 With derivatization
Organic acids Carbonic acid 41
Propanoic acid 80 87 344 Isovaleric acid 53 47 Pentanoic acid 83 18 65 Succinic acid 1115 990 1092 Malic acid 18 56 2-(Hydroxymethyl)benzoic acid 3 5 3 L-Phenyl lactate 26 5 18 L-propene-1,2,3-tricarboxylic acid 4 17 Citric acid 11 14 Sugars L-(-)-Sorbofuranose 63 D-Arabino-1,4-lactone 136 D-(-)-Fructofuranose 410 D-(-)-Tagatofuranose 200 377 α-D-Xylopyranose 4 Myo-Inositol 2 D-(+)-Turanose 135 1790 173 Lactulose 19 Alcohols 2,3 Butanediol 183 25 36 2-Phenylethanol 23 12 Glycerol 136 293 105 2-(4-hydroxyphenyl) etanol 134 45 78 Phenolics 2-tert-butyl-6-methylphenol 226 197 69 259 4-hydroxyphenyllactic acid 95 10 4-hydroxyphenylacetic acid 3
Fig. 8. Extraction yields of different solvents and residual aqueous phases from the three different consortia.
Fig. 9. Antioxidant activity and total phenolic content (TPC) of black tea (NF) and kombucha samples from the three consortia. Table 3
Half-maximal inhibitory concentration of the antioxidant activity of three kombucha consortia and black tea (NF).
Solvents Samples IC50(μg/mL)
NF F G H
EtOAc 7 ± 0.2 7.0 ± 0.4 6 ± 0.3 8 ± 0.9 BuOH 30 ± 0.5 12 ± 0.3 13.0.1 24 ± 0.8 H2O > 50 > 50 > 50 > 50
IC50values were calculated for inhibition percentages higher than 70% at 25 and 5μg/mL ± standard deviations (n = 3).
Table 2
GC–MS analysis (area x106) of kombucha tea samples and black tea (NF) without and with derivatization.
Ultimately, this study employed a variety of approaches to in-vestigate the fermentation profiles, microbiota, metabolites and health promoting potential of a variety of kombucha teas. These insights will prove valuable with respect to the optimization of the microbiota of kombuchas with respect to industrial production and health promoting attributes.
Declaration of competing interest
The authors declare that they have no known competingfinancial interests or personal relationships that could have appeared to influ-ence the work reported in this paper.
Acknowledgments
The authors thank the Mexican Council of Science and Technology (CONACYT- México) for funding the doctoral scholarship. In addition, they thank the TEAGASC research center for the facilities, Paul Cotter for reviewing the manuscript and John Leech for the bioinformatics analysis and interpretations. The metagenomics and bioinformatics analysis were conducted with the financial support of Science Foundation Ireland (SFI).
References
Andrade, P.B., Martins, V., Trujillo, M.E., Vela, E., 2007. Influence of Dekkera bruxellensis
on the contents of anthocyanins, organic acids and volatile phenols of Dao red wine. Food Chem. 100, 64–70.https://doi.org/10.1016/j.foodchem.2005.09.010. Ayed, L., Abid, S. Ben, Hamdi, M., 2016. Development of a beverage from red grape juice
fermented with the kombucha consortium. Ann. Microbiol.https://doi.org/10.1007/ s13213-016-1242-2.
Badhani, B., Sharma, N., Kakkar, R., 2015. Gallic acid : a versatile antioxidant with promising therapeutic and industrial applications. Royal Society of Chemistry Journals 27540–27557.https://doi.org/10.1039/c5ra01911g.
Boussoussa, H., Hamia, C., Djeridane, A., Boudjeniba, M., 2014. Effect of different solvent polarity on extraction of phenolic compounds from Algerian Rhanterium adpressum flowers and their antimicrobial and antioxidant activities. Curr. Chem. Biol. 43–50. Četojević-Simin, D.D., Velićanski, A.S., Cvetković, D.D., Markov, S.L., Mrdanović, J.Ž.,
Bogdanović, V.V., Šolajić, S.V., 2012. Bioactivity of lemon balm Kombucha. Food Bioprocess Technol. 5 (5), 1756–1765.https://doi.org/10.1007/s11947-010-0458-6. Chen, C., Liu, B.Y., 2000. Changes in major components of tea fungus metabolites during prolonged fermentation. J. Appl. Microbiol. 89, 834–839.https://doi.org/10.1046/j. 1365-2672.2000.01188.x.
Chidi, B.S., Bauer, F.F., Rossouw, D., 2018. Organic acid metabolism and the impact of fermentation practices on wine organic acid metabolism and the impact of fermen-tation practices on wine acidity : a review. South African Journal for Enology and Viticulture.https://doi.org/10.21548/39-2-3164.(September).
Core Team, R., 2014. A language and environment for statistical computing. R Foundation for Statistical Computing, Vienna, Austria.
Coton, M., Pawtowski, A., Taminiau, B., Burgaud, G., Deniel, F., Coulloumme-Labarthe, L., Coton, E., 2017. Unraveling microbial ecology of industrial-scale kombucha fer-mentations by metabarcoding and culture-based methods. FEMS Microbiol. Ecol. 93 (5), 1–16.https://doi.org/10.1093/femsec/fix048.
Cryan, John, O’Leary, Olivia, 2010. A glutamate pathway to faster-acting anti-depressants? Science (New York, N.Y.) 329, 913–914.https://doi.org/10.1126/ science.1194313.
Cvetković, D., Markov, S., Djurić, M., Savić, D., Velićanski, A., 2008. Specific interfacial area as a key variable in scaling-up kombucha fermentation. J. Food Eng. 85 (3), 387–392.https://doi.org/10.1016/j.jfoodeng.2007.07.021.
Deeks, Emma, 2016. Deoxycholic acid: a review in submental fat contouring. Am. J. Clin. Dermatol. 17.https://doi.org/10.1007/s40257-016-0231-3.
Domizio, P., Liu, Y., Bisson, L.F., Barile, D., 2017. Cell wall polysaccharides released during the alcoholic fermentation by Schizosaccharomyces pombe and S. japonicus: quantification and characterization. Food Microbiol. 61, 136–149.https://doi.org/ 10.1016/j.fm.2016.08.010.
Doyle, C.J., Gleeson, D., Toole, P.W.O., Cotter, P.D., 2017. High-throughput metataxo-nomic characterization of the raw milk microbiota identifi es changes reflecting lactation stage and storage conditions. Int. J. Food Microbiol. 255 (May), 1–6.
https://doi.org/10.1016/j.ijfoodmicro.2017.05.019.
Gomes, R.J., Hernan, R.J., Spinosa, A., 2018. Acetic Acid Bacteria in the Food Industry : Systematics, Characteristics and Applications. vol. 0262. pp. 0–2.https://doi.org/10. 17113/ftb.56.02.18.5593.
Hoon, L.Y., Choo, C., Watawana, M.I., Jayawardena, N., Waisundara, V.Y., 2014. Kombucha“tea fungus” enhances the tea polyphenol contents, antioxidant activity and alpha-amylase inhibitory activity offive commonly consumed teas. J. Funct. Foods.https://doi.org/10.1016/j.jff.2014.07.010.
Jain, C., Rodriguez-R, L.M., Phillippy, A.M., Konstantinidis, K.T., Aluru, S., 2018. High throughput ANI analysis of 90K prokaryotic genomes reveals clear species bound-aries. Nat. Commun. 9, 1–8.https://doi.org/10.1038/s41467-018-07641-9. Jayabalan, R., Marimuthu, S., Swaminathan, K., 2007. Changes in content of organic
acids and tea polyphenols during kombucha tea fermentation. Food Chem. 102 (1), 392–398.https://doi.org/10.1016/j.foodchem.2006.05.032.
Jayabalan, R., Chen, P.N., Hsieh, Y.S., Prabhakaran, K., Pitchai, P., Marimuthu, S., Yun, S.E., 2011. Effect of solvent fractions of kombucha tea on viability and invasiveness of cancer cells-characterization of dimethyl 2-(2-hydroxy-2-methoxypropylidine) mal-onate and vitexin. Indian J. Biotechnol. 10 (1), 75–82.
Kallel, L., Desseaux, V., Hamdi, M., Stocker, P., Ajandouz, E.H., 2012. Insights into the fermentation biochemistry of kombucha teas and potential impacts of kombucha drinking on starch digestion. Food Res. Int. 49 (1), 226–232.https://doi.org/10. 1016/j.foodres.2012.08.018.
Kang, D.D., Froula, J., Egan, R., Wang, Z., 2015. MetaBAT, an efficient tool for accurately reconstructing single genomes from complex microbial communities. PeerJ 2015, 1–15.https://doi.org/10.7717/peerj.1165.
Kim, Kwangmeyung, Kwon, Seunglee, Park, Jae, Chung, Hesson, Jeong, Seo, Kwon, Ick, Kim, In-San, 2005. Physicochemical characterizations of self-assembled nanoparticles of glycol chitosan−deoxycholic acid conjugates. Biomacromolecules. 6, 1154–1158.
https://doi.org/10.1021/bm049305m.
Lamikanra, O., 1997. Changes in organic acid composition during fermentation and aging of noble muscadine wine. J. Agric. Food Chem. 935–937.https://doi.org/10.1021/ jf960447k.
Lavasani, P.S., Motevaseli, E., Sanikhani, N., Modarressi, M.H., 2019. Komagataeibacter xylinus as a novel probiotic candidate with high glucose conversion rate properties. Heliyon.https://doi.org/10.1016/j.heliyon.2019.e01571.(November 2018, 1–15). Li, H., Durbin, R., 2009. Fast and accurate short read alignment with Burrows-Wheeler transform. Bioinformatics 25, 1754–1760.https://doi.org/10.1093/bioinformatics/ btp324.
Lin, Y., Yan, Y., 2012. Biosynthesis of caffeic acid in Escherichia coli using its endogenous hydroxylase complex. Microb. Cell Factories 3–11.
Lu, J., Breitwieser, F.P., Thielen, P., Salzberg, S.L., 2017. Bracken: estimating species abundance in metagenomics data. PeerJ Computer Science 2017 (1), 1–17.https:// doi.org/10.7717/peerj-cs.104.
Malbaša, R., Lončar, E., Djurić, M., Klašnja, M., Kolarov, L.J., Markov, S., 2006. Scale-up Fig. 10. Anti-inflammatory activity of black tea (NF) and three kombucha
samples. All the data are average values of triplicate analysis.
Table 4
Antiproliferation activity against human colon cancer (HCT-116), human breast cancer (MCF-7) and human ovarian cancer (OVCAR) cell lines.
Sample Extract Inhibition % at 50μg/mL
HCT-116 MCF-7 OVCAR NF EtOAc 8.0 ± 0.7 14.6 ± 0.2 34.7 ± 4.7 BuOH 4.4 ± 2.0 N.A 16.5 ± 2.0 H2O N.A 14.0 ± 0.4 14.6 ± 1.2 F EtOAc 10.3 ± 0.4 6.9 ± 0.7 N.A BuOH 13.8 ± 0.7 4.5 ± 1.6 N.A H2O 1.7 ± 0.9 18.0 ± 1.4 N.A G EtOAc 16.3 ± 1.8 7.8 ± 0.2 29.1 ± 2.3 BuOH 10.5 ± 1.1 3.0 ± 0.3 1.1 ± 0.3 H2O N.A 15.3 ± 0.6 N.A H EtOAc 13.7 ± 1.1 10.5 ± 0.9 N.A BuOH 8.2 ± 0.2 N.A N.A
H2O N.A N.A N.A
All the data are average values of triplicate analyses. Where NF: black tea, N.A: not active.
the products of kombucha fermentation on molasses. Food Chem. 108 (3), 926–932.
https://doi.org/10.1016/j.foodchem.2007.11.069.
Malbaša, R.V., Lončar, E.S., Vitas, J.S., Čanadanović-Brunet, J.M., 2011. Influence of starter cultures on the antioxidant activity of kombucha beverage. Food Chem. 127 (4), 1727–1731.https://doi.org/10.1016/j.foodchem.2011.02.048.
Mallick, H., Franzosa, E.A., Mclver, L.J., Banerjee, S., Sirota-Madi, A., Kostic, A.D., Clish, C.B., Vlamakis, H., Xavier, R.J., Huttenhower, C., 2019. Predictive metabolomic profiling of microbial communities using amplicon or metagenomic sequences. Nat. Commun. 10, 1–11.https://doi.org/10.1038/s41467-019-10927-1.
Marsh, A.J., O’Sullivan, O., Hill, C., Ross, R.P., Cotter, P.D., 2014. Sequence-based ana-lysis of the bacterial and fungal compositions of multiple kombucha (tea fungus) samples. Food Microbiol. 38, 171–178.https://doi.org/10.1016/j.fm.2013.09.003. Menzel, P., Ng, K.L., Krogh, A., 2016. Fast and sensitive taxonomic classification for
metagenomics with Kaiju. Nat. Commun. 7, 1–9.https://doi.org/10.1038/ ncomms11257.
Michalska, A., Grzegorz,Ł., 2015. Bioactive compounds of blueberries : post-harvest factors influencing the nutritional value of products. Int. J. Mol. Sci. 18642–18663.
https://doi.org/10.3390/ijms160818642.
Nikolaev, Y.A., Plakunov, V.K., 2007. Biofilm —“City of microbes” or an analogue of multicellular organisms ? Microbiology 76 (2), 125–138.https://doi.org/10.1134/ S0026261707020014.
Parks, D.H., Imelfort, M., Skennerton, C.T., Hugenholtz, P., Tyson, G.W., 2015. CheckM: assessing the quality of microbial genomes recovered from isolates, single cells, and metagenomes. Genome Res. 25, 1043–1055.https://doi.org/10.1101/gr.186072. 114.
Payne, Mark J., Jeffrey Hurst, W., Miller, Kenneth B., Rank, Craig, S, D.A., 2010. Impact of fermentation, drying, roasting, and Dutch processing on epicatechin and catechin content of cacao beans and cocoa ingredients. J. Agric. Food Chem. 10518–10527.
https://doi.org/10.1021/jf102391q.
Quideau, S., Deffieux, D., Douat-Casassus, C., Pouységu, L., 2011. Plant polyphenols: chemical properties, biological activities, and synthesis. Angew. Chem. Int. Ed. 50 (3), 586–621.https://doi.org/10.1002/anie.201000044.
Rahmani, R., Beaufort, S., Villarreal-soto, S.A., Taillandier, P., Bouajila, J., Debouba, M., 2019. Kombucha fermentation of African mustard (Brassica tournefortii) leaves : chemical composition and bioactivity. Food Biosci. 30 (August 2018), 100414.
https://doi.org/10.1016/j.fbio.2019.100414.
Ramachandran, S., Fontanille, P., Pandey, A., Larroche, C., 2006. Gluconic acid : prop-erties, applications and microbial production. Food Technol. Biotechnol. 44 (2), 185–195.
Reiss, J., 1994. Influence of different sugars on the metabolism of the tea fungus. Zeitschrift Für Lebensmittel-Untersuchung Und-Forschung 198 (3), 258–261.https:// doi.org/10.1007/BF01192606.
Reva, O.N., Zaets, I.E., Ovcharenko, L.P., Kukharenko, O.E., Shpylova, S.P., Podolich, O.V, ... Kozyrovska, N.O., 2015. Metabarcoding of the kombucha microbial com-munity grown in different microenvironments. AMB Express 5 (1), 124.https://doi. org/10.1186/s13568-015-0124-5.
Romano, A., Perello, M.C., Revel, G. De, 2008. Growth and volatile compound production by Brettanomyces/Dekkera bruxellensis in red wine. J. Appl. Microbiol. 104, 1577–1585.https://doi.org/10.1111/j.1365-2672.2007.03693.x.
Rosma, A., Karim, A.A., Bhat, R., 2012. Fermentation of black tea broth (Kombucha): I. Effects of sucrose concentration and fermentation time on the yield of microbial. cellulose 19 (1), 109–117.
Sievers, M., Lanini, C., Weber, A., Schuler-Schmid, U., Teuber, M., 1995. Microbiology and fermentation balance in a kombucha beverage obtained from a tea fungus fer-mentation. Syst. Appl. Microbiol. 18 (4), 590–594. https://doi.org/10.1016/S0723-2020(11)80420-0.
Silva, G.G.Z., Green, K.T., Dutilh, B.E., Edwards, R.A., 2016. Sequence analysis SUPER-FOCUS : a tool for agile functional analysis of shotgun metagenomic data. Bioinformatics 32 (October 2015), 354–361.https://doi.org/10.1093/ bioinformatics/btv584.
Steensels, J., Daenen, L., Malcorps, P., Derdelinckx, G., Verachtert, H., Verstrepen, K.J., 2015. Brettanomyces yeasts - from spoilage organisms to valuable contributors to industrial fermentations. Int. J. Food Microbiol. 206, 24–38.https://doi.org/10. 1016/j.ijfoodmicro.2015.04.005.
Teoh, A.L., Heard, G., Cox, J., 2004. Yeast ecology of kombucha fermentation. Int. J. Food Microbiol. 95 (2), 119–126.https://doi.org/10.1016/j.ijfoodmicro.2003.12.020. Vázquez-Cabral, B.D., Larrosa-Pérez, M., Gallegos-Infante, J.A., Moreno-Jiménez, M.R.,
González-Laredo, R.F., Rutiaga-Quiñones, J.G., Rocha-Guzmán, N.E., 2017. Oak kombucha protects against oxidative stress and inflammatory processes. Chem. Biol. Interact. 272, 1–9.https://doi.org/10.1016/j.cbi.2017.05.001.
Villarreal-Soto, S.A., Beaufort, S., Bouajila, J., Souchard, J.-P., Taillandier, P., 2018. Understanding kombucha tea fermentation: a review. J. Food Sci. 83 (3), 580–588.
https://doi.org/10.1111/1750-3841.14068.
Villarreal-soto, S.A., Beaufort, S., Bouajila, J., Souchard, J., Renard, T., Rollan, S., Taillandier, P., 2019. Impact of fermentation conditions on the production of bioactive compounds with anticancer, anti-infl ammatory and antioxidant properties in kombucha tea extracts. Process Biochem. 0–1.https://doi.org/10.1016/j.procbio. 2019.05.004.(October 2018).
Vohra, B.M., Fazry, S., Sairi, F., Babul-airianah, O., 2019. Effects of medium variation and fermentation time on the antioxidant and antimicrobial properties of Kombucha. Malaysian Journal of Fundamental and Applied Sciences 2018 (1998), 298–302. Watawana, M.I., Jayawardena, N., Ranasinghe, S.J., Waisundara, V.Y., 2015a. Evaluation
of the effect of different sweetening agents on the polyphenol contents and anti-oxidant and starch hydrolase inhibitory properties of kombucha. Journal of Food Processing and Preservation 41 (1).https://doi.org/10.1111/jfpp.12752. Watawana, M.I., Jayawardena, N., Waisundara, V.Y., 2015b. Enhancement of the
func-tional properties of coffee through fermentation by “tea fungus” (kombucha). Journal of Food Processing and Preservation.https://doi.org/10.1111/jfpp.12509.(Clifford 1999), n/a-n/a.
Wickham, H., 2009. Ggplot2: Elegant Graphics for Data Analysis, 2nd Edition. Springer, New York.https://doi.org/10.1007/978-0-387-98141-3.
Wood, D.E., Salzberg, S.L., 2014. Kraken: ultrafast metagenomic sequence classification using exact alignments. Genome Biol. 15 (3). https://doi.org/10.1186/gb-2014-15-3-r46.
of black tea batch fermentation by Kombucha. Food Bioprod. Process. 84 (3), 193–199. https://doi.org/10.1205/fbp.05061.