Publisher’s version / Version de l'éditeur:
Vous avez des questions? Nous pouvons vous aider. Pour communiquer directement avec un auteur, consultez la première page de la revue dans laquelle son article a été publié afin de trouver ses coordonnées. Si vous n’arrivez pas à les repérer, communiquez avec nous à PublicationsArchive-ArchivesPublications@nrc-cnrc.gc.ca.
Questions? Contact the NRC Publications Archive team at
PublicationsArchive-ArchivesPublications@nrc-cnrc.gc.ca. If you wish to email the authors directly, please see the first page of the publication for their contact information.
https://publications-cnrc.canada.ca/fra/droits
L’accès à ce site Web et l’utilisation de son contenu sont assujettis aux conditions présentées dans le site LISEZ CES CONDITIONS ATTENTIVEMENT AVANT D’UTILISER CE SITE WEB.
Aerosol and Air Quality Research, 20, 4, pp. 730-740, 2020-04-01
READ THESE TERMS AND CONDITIONS CAREFULLY BEFORE USING THIS WEBSITE. https://nrc-publications.canada.ca/eng/copyright
NRC Publications Archive Record / Notice des Archives des publications du CNRC : https://nrc-publications.canada.ca/eng/view/object/?id=8d825f73-bca3-42ac-ab96-c7052f506cee https://publications-cnrc.canada.ca/fra/voir/objet/?id=8d825f73-bca3-42ac-ab96-c7052f506cee
This publication could be one of several versions: author’s original, accepted manuscript or the publisher’s version. / La version de cette publication peut être l’une des suivantes : la version prépublication de l’auteur, la version acceptée du manuscrit ou la version de l’éditeur.
For the publisher’s version, please access the DOI link below./ Pour consulter la version de l’éditeur, utilisez le lien DOI ci-dessous.
https://doi.org/10.4209/aaqr.2020.01.0006
Access and use of this website and the material on it are subject to the Terms and Conditions set forth at
Typical and atypical morphology of non-volatile particles from a diesel
and natural gas marine engine
Baldelli, Alberto; Trivanovic, Una; Corbin, Joel C.; Lobo, Prem; Gagné,
Stephanie; Miller, J. Wayne; Kirchen, Patrick; Rogak, Steven
ISSN: 1680-8584 print / 2071-1409 online doi: 10.4209/aaqr.2020.01.0006
Typical and Atypical Morphology of Non-volatile Particles from a Diesel and
Natural Gas Marine Engine
Alberto Baldelli
1, Una Trivanovic
1, Joel C. Corbin
2, Prem Lobo
2, Stephanie Gagné
2,
J. Wayne Mille
3, Patrick Kirchen
1, Steven Rogak
11 Department of Mechanical Engineering, University of British Columbia, Vancouver, BC, V6T 1Z4, Canada 2 Metrology Research Centre, National Research Council Canada, Ottawa, Ontario K1A 0R6, Canada
3 Department of Chemical and Environmental Engineering, Bourns College of Engineering, University of California,
Riverside, CA 92521, USA
ABSTRACT
Non-volatile particle emissions from a marine engine fueled by either diesel or natural gas (NG) blended with diesel pilot gas were investigated via transmission electron microscopy (TEM). The most common particles (> 95% by number) were soot aggregates. These “typical” aggregates exhibited primary particle diameters of 20.7 ± 1.9 and 26.9 ± 1.7 for 100 nm aggregates when diesel and NG fuel were used, respectively. Highly non-uniform aggregates, with distinct groups of smaller and larger monomers, were visible in all of the samples but occurred most frequently with diesel fueling at high loads. The observed “atypical” particles included super-aggregates, small compact aggregates, spheres, mineral-like polyhedral particles, and fibers. Such particles, although rare (averaging 3% by number, as calculated by counting the number of particles for each type depicted in all of the collected images), were found in most of the samples and could have been produced by a variety of mechanisms. For instance, the spheres (approximately 300 nm in diameter) most likely arose from metals within the lubricating oil.
Keywords: Natural gas; Diesel; Transmission electron microscope; Primary particle diameter; Projected-area-equivalent
diameter; Marine exhaust.
INTRODUCTION
Carbonaceous aerosols such as soot have an impact on the environment and human health (Janssen et al., 2011). They are major contributors to radiative heating of the atmosphere (Jacobson, 2010). Important sources of soot include internal combustion engines, biomass burning, waste incineration, house and forest fires, furnaces, and flares (Rockne et al., 2000; Bond et al., 2004; Kazemimanesh et al., 2019; Popovicheva et al., 2019).
In internal combustion engines, different operating conditions, such as load, result in soot with different properties and with different impact on the environment (e.g., Gent et al., 2019). Diesel engines are popular due to their reliability, power, and fuel economy, and the nature of its combustion emissions has been deeply investigated (Zhu et al., 2005; Neer and Koylu, 2006; Patel et al., 2012; Vyavhare et al., 2019). However, diesel engine emissions are significant and are expected to increase with vehicle population. This motivates
* Corresponding author.
E-mail address: baldelli.alberto@yahoo.com
the use of alternative fuel types for emissions reduction. Natural gas (NG) is emerging as an attractive alternative to diesel for marine engines due to its lower cost, lower soot, CO2 and NOx (Sommer et al., 2019, Corbin et al., 2019)
emissions, and negligible sulfur content. There are relatively few studies of soot emissions from NG combustion in marine engines (Brynolf et al., 2014; Anderson et al., 2015; Lehtoranta et al., 2019; Corbin et al., 2020) and even fewer that address particle morphology (Moldanová et al., 2009; Popovicheva, 2009; Trivanovic, 2019). The environmental impact of soot contained in marine emissions includes radiative forcing (Bond et al., 2013), and detrimental effects on human health (Sofiev et al., 2018) and the marine ecosystem (Mari et al., 2014). An estimated 70% of shipping emissions occur within 400 km of coastlines, further increasing the particulate matter (PM) emissions in populated areas and contributing to local mortality (Corbett et al., 2007). Although the use of NG in shipping will reduce many emissions relative to diesel fueling, the increase in NG use for marine applications (Korakianitis et al., 2011; Corbin et al., 2019) is a concern, and it is important to understand the characteristics of the emissions. Furthermore, NG has potential for serious GHG emissions (CH4), and these need to be effectively managed
Particle morphology affects the physical properties of the emissions and provides some clues to formation mechanisms (Olfert and Rogak, 2019). Both the aggregate size (characterized by projected-area-equivalent diameter, da) and primary particle diameter (dp) are important. Fig. 1
shows an example of soot aggregate produced by a marine engine burning NG with a small amount of diesel fuel as pilot (at 11% load); here da and dp are represented as a dashed
blue and a continuous red circle, respectively.
Recent studies identify a clear correlation between the two parameters where an increase in dp is linked with an
increase in da (Dastanpour, 2016; Baldelli and Rogak, 2019;
Olfert and Rogak, 2019). Eq. (1) characterizes this relationship between da and dp, using two parameters. Here, dp,100 is the
primary particle size for an aggregate with a projected-area-equivalent diameter of 100 nm, and DTEM is characteristic
exponent. .100 100 nm TEM D a p p d d d (1)
Fig. 1. Illustration of the projected-area-equivalent diameter
(da), larger and dashed blue line, and the primary particle
diameter (dp), smaller and continuous red line. The image
represents one soot aggregate generated by a NG-fueled engine at 50% load.
Several studies investigate this relation for soot produced by different fuels (China et al., 2013; Dastanpour, 2016; Wang et al., 2017; Yang et al., 2019; Olfert and Rogak, 2019; Trivanovic et al., 2019). Trivanovic et al. (2019) investigated the same dual-fueled NG-diesel engine studied in the present paper. Two power laws fit, one applicable to soot generated by diesel operation only (Eq. (2), and one for NG operation only (Eq. (3)):
22 1.5
0.41 0.06 100 nm a p d d (2)
28 1.0
0.29 0.04 100 nm a p d d (3)Olfert and Rogak (2019) derived a “universal” fit that could be applied to soot produced by a variety of combustion systems using non-premixed flames:
17.8
0.35 100 nm a p d d (4)However, explicit reporting of these relations between dp
and da is very recent and most prior work reports dp
independently of aggregate size. Table 1 summarizes recent literature reporting TEM image analysis of soot from diesel or a dual-fueled NG-diesel engine. A small number of studies analyzed NG emissions (Anderson et al., 2015; Trivanovic, 2019).
Trivanovic et al. (2019) analyzed soot produced by the same marine dual-fuel engine studied in this paper, but used a different particle sampler and did barely consider the effects of engine load on morphology or the presence of atypical particles—although their existence is briefly noted. Atypical particles refer to any sort of particle that differ from
Table 1. Primary particle diameter (dp) and projected-area-equivalent diameter (da) derived from transmission electron
microscope (TEM) images analysis and for engines using diesel or NG.
Study Engine type Load [%] � [nm]
� [nm]
dp,100
[nm] DTEM
Lee et al., 2002 Diesel (heavy-duty, 4-cylinder) 0–50 240 ± 130 32 ± 6 NA NA Zhu et al., 2005 Diesel (light-duty, 1.7 L) 0–100 119 ± 34* 26 ± 7 NA NA Neer and Koylu, 2006 Diesel (6-cylinder) 10–100 187 ± 163 27 ± 7 NA NA Mustafi and Raine, 2009 Diesel (single-cylinder) 20–80 123 ± 98 25 ± 6 NA NA
Dual diesel and NG 58–80 and 20–42 165 ± 49 28 ± 7 Soewono and Rogak,
2011
Diesel (light-duty, 1.9 L) 6–8 118 ± 53 29 ± 3 NA NA
Ajtai et al., 2016 Diesel (heavy-duty) 25–75 123 ± 84 NA NA NA Nithyanandan et al., 2016 Diesel (single-cylinder) 100 350 ± 90* 21 ± 8 NA NA Addition of NG 40 and 70 390 ± 100* 24 ± 9 NA NA Lapuerta et al., 2017 Diesel (four-cylinder, 2.2 L,
direct-injection)
19–45 NA 23 ± 6 NA NA
Trivanovic, 2019 Diesel 0–70 214 ± 38 29 ± 2 20.7 ± 2 0.42 NG marine 0–90 191 ± 12 34 ± 1 26.9 ± 2 0.29 * Values are extracted from plots.
the typical appearance of soot aggregates. Some examples of atypical particles observed in previous studies are aggregates larger than a few micrometers, carbon nanotubes (CNTs) (Lagally et al., 2012; Swanson et al., 2016), mineral-like particles (Zhang et al., 2018), and oil droplets (Rönkkö et al., 2014; Anderson et al., 2015; Xing et al., 2019). A few studies focus on atypical particles generated by different exhaust, such as diesel combustion (Jung et al., 2013; Rönkkö et al., 2014; Zhang and Kook, 2015; Zhang et al., 2018; Xing et al., 2019), gasoline (Xing et al., 2019), and NG (Anderson et al., 2015). The lack of prior work on atypical particles from natural gas engine combustion and the low number of references analyzing atypical particles in any type of engine are a reason for the focus of the present paper.
MATERIALS AND METHODS Engines and Sampling System
The engines and sampling methods are described by Trivanovic (2019). Briefly, one of two 4320 kWh, dual-fuel, four-stroke, nine-cylinder, compression-ignition engines on a commercial in-use vessel was used. The engine has a 150 mm bore and 180 mm stroke and operates at a nominal 1500 rev min−1 with a maximum 80 kW output power. The fuel used was diesel (ultra-low sulfur diesel), while the NG was mostly composed by methane (90–92%) (Trivanovic et al., 2019). The engine operated with both NG and diesel fuel; the diesel pilot generates about 2% of the energy at high load and 10% of energy at low loads, with the remainder of the energy coming from the NG ignited by the diesel pilot combustion. For the idle condition, the diesel accounted for more of the fuel energy. Even though we are not certain of what the proportion is at idle, we assume that it is more diesel that NG since there is a minimum amount that the diesel injector can inject.
Emissions were sampled on board the vessel through a port in the engine exhaust system. The sampling and dilution system were in accordance with ISO 8178-1 and is described in full by Corbin et al. (2019). Of about 60 L min−1 of diluted sample flow, 1 L min−1 was sampled through a 2 m long sampling line to an electrostatic precipitator (ESPnano Model 100; DASH Connector Technology, Inc.), which sampled particles at 100 cm3 min−1 onto an
amorphous-carbon-coated copper TEM grid. Engine was operated with just diesel or diesel/NG and some duplicates were taken.
Morphology Characterization
A Hitachi H7600 transmission electron microscope (TEM) was used to image soot aggregates. This TEM unit, thanks to a 20 kV tungsten filament, was capable of 0.35 nm point-to-point resolution when utilizing a liquid nitrogen cold finger. The H7600 TEM was equipped with a side-mounted AMT XR50 CCD camera. Magnification values ranging from 8 to 100 k× were used to account for different sizes of aggregates.
Images for each sample were analyzed using the pair correlation method (PCM) (Dastanpour, 2016; more details in Supplementary Information [SI]). This code was also used by Trivanovic et al. (2019). Between 40 and 75 images
were analyzed for each sample. Each sample is defined as one grid; different grids are used for the same operating conditions in order to obtain a more statistically appropriate approach. Additionally, 8–15 images were taken in 5 different areas of the grid, as shown in the SI. The aggregates were randomly selected by scanning the 5 different areas manually. Samples of particles were collected for a variety of engine loads and fueling conditions (diesel or NG with diesel pilot). Different load percentages are used for NG emissions (5, 11, 30, 50, 75, and 90%) and for diesel emissions (5, 25, 60, and 75%). The samples were categorized by the fuel used, NG or diesel, and the load percentage (low for load ≤ 30%, medium for loads > 30% and ≤ 60%, and high for loads ≥ 75%). A total of 13 samples, among which 10 differ in at least one operating condition, were collected from NG operation emissions, and 8 samples were generated from diesel operation emissions. More information can be found in SI (Table S1).
RESULTS AND DISCUSSION Typical Soot Aggregates
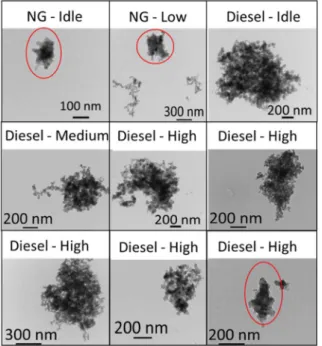
The typical structure of soot aggregates is well known (Tree and Svensson, 2007) to be small primary spherules combined in clusters with a fractal-like structure. Fig. 2 compares dp and da, according to engine operating condition
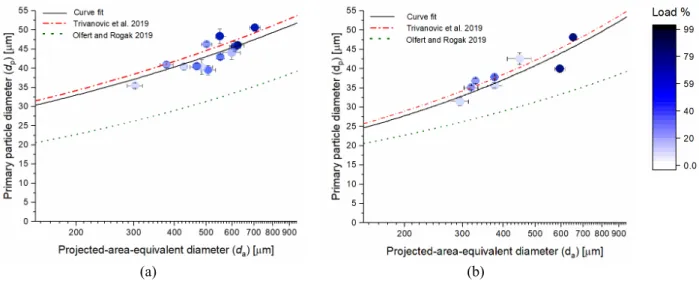
and fueling. The data points indicate the average of all the soot aggregates analyzed in each sample and the error bars indicate the 95% confidence interval around these means. The curve fit is obtained from a linear fit in log-log space to all of the individual aggregate measurements. Results from other research studies are also shown as a comparison. The power law fits are obtained using Eqs. (2) and (3), for diesel and NG emissions by Trivanovic et al. (2019), and Eq. (4) for a “universal” fit by Olfert and Rogak (2019). The consistency of results for diesel and NG in this engine could support the hypothesis (Corbin et al., 2019) that in NG mode the soot particles originate from the diesel pilot fuel, rather than from the NG. However, a larger dataset and additional experiments using other engines would confirm such hypothesis. Higher engine loads generate higher average da
and dp, which is clear in the averages plotted in Fig. 2 but
not in the sample images of Fig. 3. Lapuerta et al. (2017) recognize a minor influence of the impact of the load to the distribution of dp for diesel soot. The engine load is known
not to directly affect the soot formation and oxidation. Instead, this is the result of changes in in-cylinder conditions (temperature, local and global air-fuel ratio, charge motion, and turbulence) (Virtanen et al., 2004). Collection time did not have a significant influence on dp and da (Fig. S2).
Our curve fits in Fig. 2 are represented by the equations below for diesel and NG emissions (R2 = 0.99), respectively:
20.7 1.9
0.42 0.05 100 nm a p d d (5)
26.7 1.7
0.29 0.08 100 nm a p d d (6)(a) (b)
Fig. 2. Relationship between the primary particle diameter and the equivalent-projected-area diameter for (a) NG and
(b) diesel emissions. Data point represents the average of each sample listed in Table 1. The 95% confidence interval is shown by the error bars. The red dashed line represents the marine engine using diesel and NG (Trivanovic, 2019) and the dotted blue line represents the universal fit presented in Olfert and Rogak (2019).
Fig. 3. Images of typical soot aggregates generated by a marine engine operated on NG with diesel pilot fuel (top row) and
on diesel fuel (bottom row).
These fitting parameters are not significantly different from those reported by Trivanovic et al. (2019) for an independent analysis of particles from this same engine, but are significantly different from the “universal fit” of Olfert and Rogak (2019), which included data from many low-pressure burners as well as compression-ignition engines. In Fig. 3, typical soot is shown for the low, medium, and high engine load. The ring structures of soot aggregates identified by Baldelli et al. (2019), where monomers form a closed loop within the aggregate, cannot be positively identified without 3-D tomography, but it appears to be present in the images of Fig. 3 for NG (medium and high loads) and diesel (high load).
Atypical Soot
Soot with Non-uniform Primary Particles
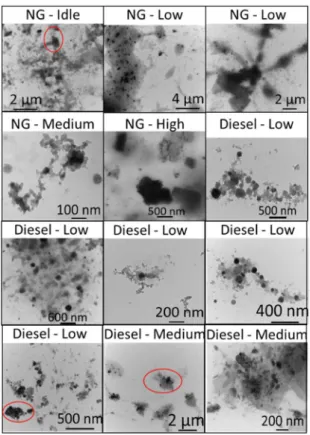
Aggregates with some primary particle size variation within aggregates have been analyzed, Fig. 4. In some cases, these variations are extreme, but it is clear that primary
particle diameters are uniform within large portions of the aggregate, as highlighted in Fig. 4. The red, blue, and green circles identify primary particle with large, medium, and small average primary particle diameter. Some previous references reported TEM images containing soot aggregates with a non-uniform distribution of primary particles; however, a size distribution was not reported (Neer and Koylu, 2006; Ushakov et al., 2013; Kook et al., 2016). For diesel at 75% load, 30 out of 75 images contained aggregates composed of primary particles with different diameters or containing aggregates with significantly different average primary particle diameters.
An interesting observation is that the group with the smallest primary particles appear at the outer edge of the aggregate in about 60% of the images containing soot with non-uniform primary particles. The loading density on the grids was sufficiently low that we are seeing the effect of coagulation rather than seeing multiple aggregates sampled on top of each other.
Fig. 4. Images of non-uniform primary particles within aggregates in typical soot aggregates generated by a marine engine
operated on NG with diesel pilot fuel (top row) and on diesel fuel (bottom row). For the NG case, the loads of low, medium, and high correspond to 10, 50, and 90% loads, respectively. For diesel, the corresponding values are 25, 50, and 75%. Red, blue, and green circles identify dispersion of small-, medium-, and large-sized primary particles. The number connected to these circles identifies the average primary particle diameter in nm.
Super-aggregates
Both fueling conditions occasionally produced super-micron aggregates (“super-aggregates”; Kim et al., 2006; Chakrabarty et al., 2012). Here, we classify as a super-aggregate any aggregate with da three times the average for the related fuel
and load condition. Occasionally aggregates exceed 6 microns (Fig. 5), possibly the result of wall shedding (Timko et al., 2009), but formation through coagulation is possible. In general, the super-aggregates have a lower aspect ratio than typical smaller aggregates. Restructuring after post-flame coagulation is a plausible mechanism for producing large
Fig. 5. Examples of “super-aggregate” particles produced
by NG and diesel at different loads. These particles show a projected-area-equivalent diameter that is at least three times larger than the average projected-area-equivalent diameter for the related case.
compact structures; in this case the bonds between components of the aggregate would be weak relative to the large Brownian forces. Super-aggregates are visible in images for NG and diesel operation; however, a larger fraction of images contain super-aggregates for diesel operation (more details in Section 3.4).
Small Compact Aggregates
The largest aggregates appear unusually compact (with no or few internal voids in the TEM images of soot aggregates), but so do some smaller aggregates, shown in Fig. 6. Previous studies show particles with a similar appearance (Xi and Zhong, 2006; Liati and Eggenschwiler, 2010; Barone et al., 2012; La Rocca et al., 2013; Xing et al., 2019) and the compaction is hypothesized to occur upon either the condensation or evaporation of volatile material (Zangmeister et al., 2014). Here, such compacted aggregates were mostly observed for diesel operation at high loads; in the case of diesel at 75% of loads, 10 out of 75 images contained one or more compacted aggregates.
Most of the small compact aggregates have distinct primary particles. Such aggregates are frequently mentioned in the literature (Virtanen et al., 2004; Bambha et al., 2013; Xing et al., 2019). Some speculate that these regular compacted aggregate are due to the high presence of oxygenated hydrocarbons (Lu et al., 2008; Miljevic et al., 2012) or sulfuric acid (Khalizov et al., 2009; Henning et al., 2012; Pei et al., 2018). These compacted aggregates may have high hygroscopicity affecting cloud formation (Pei et al., 2018). A few small compact aggregates have no distinct primary particles and are denoted here as “fused,” shown in Fig. 6 within red circles. These are found in only 7 images (out of a total of 753) and they are, thus, a very minor group. They appear similar to some examples shown in Xing et al. (2019) for a port-fueled gasoline engine; these authors suggest the source of particles is lubricating oil.
Non-soot Atypical Particles
The sections above discuss variations of soot aggregate morphologies. Below we consider less common types of
Fig. 6. Examples of the small compact aggregate particles.
These particles are found in emission from natural gas (NG)-fueled engine at 5 and 10% load, and in diesel-(NG)-fueled engine at idle and 60 and 75% load. Red circles identify “fused” cases where it is difficult to visualize the primary particles.
particles rarely discussed in the literature. Artifacts from the sample collection (ESPnano) cannot be completely ruled out, but there are no reports of such artifacts in the literature.
Spheres
Spheres are visible in the samples from NG operation at 5% load, and diesel operation at 25% load and idle. The highest number of cases observed are, however, for emissions of diesel engine at idle (estimated at 5%) where 6 cases are imaged, as shown in Fig. 7 highlighted with red circles. In case of emissions of NG at 5% and of diesel at 25%, about 5 and 2% of the images contained spheres, respectively. For diesel operation at idle (5%), about 5% of the images obtained contained one or more spheres. Independent of the fuel, these spheres have diameters from 190 to 350 nm. Furthermore, in most of the cases visualized (67%), these spheres are overlapping or located in the same spot as an aggregate. Some 33% of spheres are visualized far from any aggregate, as shown in Fig. 7.
Xing et al. (2019) and Rönkkö et al. (2014) identify similar particles, showing a spherical shape and containing mainly Ca, P and O. In both these cases, the formation rate of soot was extremely low because in the first study a port-fueled gasoline engine was used, and in the second case the engine was motored (i.e., there was no combustion). It is well known that large amounts of unburned lubrication oil are emitted by diesel engines compared to NG-fueled engines, comprising 95% of the total volatile emissions (Sakurai et al., 2003). Alternatively, this lubrication oil may undergo partial combustion. It is therefore most likely that the observed spheres originate from lubrication oil. These spheres are the most common type of non-soot particle found in emissions
Fig. 7. Images of the atypical particles named “sphere.”
These particles are found in emission from natural gas (NG)-fueled engine at 5% load, diesel-(NG)-fueled engine at 25% load, and diesel-fueled engine at idle.
of heavy-duty diesel engines, and are higher at the idle running state (Rönkkö et al., 2014).
Mineral-like Particles
A few samples contained small, very dark particles identified by strong electron scattering typical of metals or minerals. These “mineral-like” particles are shown in Fig. 8. In particular, the cases of 5, 10, 30, and 75% loads with NG show mineral-like particles for about 5% of the images collected. For 25 and 60% loads with diesel show 10% of the images containing some mineral-like particles. The case of diesel emissions at 25% load contains the highest count of this type of particles. Mineral-like particles were occasionally mixed with soot; in up to 90% of the images with mineral-like particles, they are spread over a large area of the grid. In addition, mineral-like particles are surrounded by a darker gray area indicating the presence of volatile organics (Bernard et al., 2013). These areas are common in diesel- and gasoline-fueled engines (Müller et al., 2006; Zhang et al., 2017).
Mineral particles can be produced from fuel/oil additives or contamination, and they are so rare that we cannot conclusively determine their source here. However, we can make a couple of hypotheses. If these mineral-like particles are derived from the additives in the fuel engines, they are oxides and thus insoluble in water. However, if the cause of these minerals is the engine oil, a large quantity (possibly above a few mg) of this oil would be needed to generate large mineral-like crystals, 20–100 nm. Thus, oil as a source of mineral-like particles is not probable. Zhang et al. (2018) noticed particles with a similar appearance in exhaust from residential coal burning. They notice that mineral-like crystals of a large size can suggest an influence of water vapor from the environment during collection or after deposition (Li et al., 2011; Liu et al., 2017). Salt microparticles present in the environment can deposit on the collection system or substrate before or after collecting the engine emissions. In addition, the mineral-like particles appear polyhedral and spherical independently of the fuel type and load. Some
Fig. 8. Examples of atypical polyhedral mineral-like particles.
These particles are found in emission from natural gas (NG)-fueled engine at 5, 10, 30, 50, and 75% load, and in diesel-fueled engine at 25 and 75% load. Red circles identify examples of single mineral-like particles.
previous studies identify polyhedral and spherical particles deposited in samples collected from the environment and with high sodium (Na) content (Xing et al., 2019). Sodium containing particles can lead to different types of morphology according to their formation process that is mostly influenced by temperature, humidity, and solute/water ratio (Baldelli and Vehring, 2016a; Baldelli and Vehring, 2016b; Ferraz-Albani et al., 2017). In general, the longer the time these salts are in contact with water vapor and the larger the crystals size grows (Baldelli et al., 2016; Azhdarzadeh et al., 2016). Consequently, the mineral-like particles visualized in this project are estimated to be derived from the environment. However, most of the air directed to the engine is filtered, reducing the possibility of an infiltration of salt from the environment of the engine, most likely sea salt. Therefore, there could be rather an infiltration in the collection system or a presence of impurities on the collected substrate.
Fibers
Fibers were observed only in samples from NG operation. Higher loads show the highest percentages of fiber numbers (Fig. 9). Some fibers were surrounded by spheres with darker gray tones, which indicate the presence of volatile organics (expected since the majority of particle emissions from this engine were volatile organics; Corbin et al., 2019). In other cases, these fiber particles are visible while embedded in a large soot aggregate or in a disordered and
Fig. 9. Images of the atypical particles named “fibers.”
These particles are found in emission from natural gas (NG)-fueled engine at 30, 50, and 75% engine load.
clustered area of the sample (Fig. 9). In addition, several fibers are embedded with small soot aggregates; in most of the cases, these fibers are separated by soot aggregates. Fiber particle are the least common for NG emissions (7 images out of 1025) and totally absent in diesel emissions. Based on previous work by Jung et al. (2013), Lagally et al. (2012) and Swanson et al. (2016), these fibers are most likely carbon nanotubes, presumably formed with aid of iron particles derived from wear or lubricant additives (Okada et al., 2003). A similar study shows that Fe-bearing NPs, produced by vehicles, can be composed of magnetite, hematite, and goethite. Particles composed of goethite appear very similar to the example shown in Fig. 9 at NG 30% load (Gonet and Maher, 2019).
Frequency of Particle Types
Table 2 shows the frequency of each type of particles encountered in the samples taken for NG and diesel operation. A higher number of particles were imaged for NG emissions (1025) compared to diesel emissions (633). In any case, the typical soot aggregates represent the majority of the recorded particles. The frequency represents the percentage of a type of particle with respect to the total number of aggregates and particles manually counted in all the images recorded. The number of each type of particle is obtained by manually counting the number of particles of each type contained in all the images collected. The number of images collected per engine condition varies between 40 and 150 images.
Some particle types (e.g., super-aggregates, small compact aggregates) typically show only one of that type per image. However, for other types (e.g., fibers), an image will have multiple particles of that type, possibly introducing a positive bias in the observed frequency. On the other hand, such as for mineral-like particles and fibers, the identification of particles was challenging due to low contrast, low magnification, and/or the weak difference in grayscale between the particles and the background, which would result in underestimates of the frequency for these particle types.
As shown in Table 2, diesel emissions contain the highest number of atypical soot aggregates, while NG emissions produce the highest number of other types of particles, such
Table 2. Percentages of each type of particle by fuel type and load category. The number of aggregates counted is
reported (N). Type of particles
NG (N = 1025 particles) Diesel (N = 633 particles) Low Medium High Low Medium High (N = 375) (N = 455) (N = 195) (N = 103) (N = 270) (N = 260) Typical soot 59.1 58.5 67.5 49.8 38.2 21.2 Atypical soot Non-uniform primaries 14 13 16 21 46 51 Super-aggregates 6.6 0.8 6.0 2.9 13 6.1 Compacted 10 7.4 7.9 18 1.3 21 Atypical non-soot Sphere 1.4 6.8 0 0 0 0 Mineral-like 5.7 12 2.1 8.3 1.5 0.7 Fibers 3.2 1.5 0.5 0 0 0
as sphere, mineral-like, and fibers. Non-uniform aggregates dominate in high loads of diesel, while mineral-like particles are elevated in medium loads of NG. Fiber particles are not present for diesel operation and spheres are contained only in cases of low loads of NG. These patterns are least partly explained by the much higher soot emission for diesel fueling, which will result in more coagulation between soot particles (Trivanovic et al., 2019), as well as lower fractions of non-soot particles. We note that for the rarest atypical particles, zero observations do not necessarily indicate zero abundance of those particles.
CONCLUSION
Typical and atypical soot aggregates and atypical non-soot aggregates produced by an engine dual-fueled by NG and diesel were examined via TEM. The relation between da
and dp exhibited by the typical soot particles provided fitting
parameters that reproduced the values from independent work on the same engine model within 95% confidence intervals. Comparing our results with those in a previous study, differences in collection procedure and microscope operation generated an average difference of 7% in the primary particle size. Higher engine loads slightly tended to produce larger aggregates and larger primary particle sizes, and the averages for each load closely followed the correlations fitting the individual aggregate data.
The atypical soot particles were identified and counted, and their potential sources were suggested. Non-uniform soot aggregates, which displayed clearly different average primary particle sizes for different regions of an aggregate, were also identified and were attributed to the coagulation of pre-existing aggregates following combustion; these aggregates were more common in the diesel samples. Additionally, super-aggregates and compact aggregates were observed and attributed to wall shedding or coagulation, and the evaporation of volatile organics or possibly water during emission or sampling, respectively. All of these soot aggregates were considered to have originated from the diesel fuel (as either the main fuel or the pilot fuel).
Atypical non-soot particles were detected during both NG and diesel operation, and their sources were investigated by referring to the literature. In the cases of low or medium loads with NG, fibers possessing the same morphology and appearance as carbon nanotubes (CNTs) reported in
previous engine emission studies were observed. Mineral-like particles, either from contaminants or fuel/oil additives, were very rare, but some of the observed spheres may have been generated by ash formed from elements (Ca and P) in the lubricating oil.
Overall, the atypical particles comprised a small fraction of the total particles; thus, they would not have significantly influenced the extensive properties of the observed aerosol. Our quantification of these particles therefore increases our confidence in our earlier conclusions that the emissions of this NG engine are dominated by soot and volatile organic compounds. However, future atmospheric studies may find the presence of these atypical particles to be useful in tracing marine engines or NG combustion sources. Furthermore, the influence of such particles is not yet fully understood and may warrant a more dedicated investigation.
ACKNOWLEDGEMENT
The authors would like to thank the vessel operator for their support and assistance during the progress of this study.
SUPPLEMENTARY MATERIAL
Supplementary data associated with this article can be found in the online version at http://www.aaqr.org.
REFERENCES
Ajtai, T., Pintér, M., Utry, N., Kiss-Albert, G., Gulyás, G., Pusztai, P., Puskas, R., Bereczky, A., Szabados, G. and Szabó, G. (2016). Characterisation of diesel particulate emission from engines using commercial diesel and biofuels. Atmos. Environ. 134: 109–120.
Anderson, M., Salo, K. and Fridell, E. (2015). Particle- and gaseous emissions from a LNG powered ship. Environ. Sci. Technol. 49: 12568–12575.
Azhdarzadeh, M., Shemirani, F.M., Ruzycki, C.A., Baldelli, A., Ivey, J., Barona, D., Church, T., Lewis, D., Olfert, J.S., Finlay, W.H. and Vehring, R., (2016). An atomizer to generate monodisperse droplets from high vapor pressure liquids. Atomization Sprays 26: 121–134. Baldelli, A., Power, R.M., Miles, R.E., Reid, J.P.,Vehring,
R. (2016). Effect of crystallization kinetics on the properties of spray dried microparticles. Aerosol Sci.
Technol. 50: 693–704.
Baldelli, A. and Vehring, R. (2016a). Analysis of cohesion forces between monodisperse microparticles with rough surfaces. Colloids Surf., A 506: 179–189.
Baldelli, A. and Vehring, R. (2016b). Control of the radial distribution of chemical components in spray-dried crystalline microparticles. Aerosol Sci. Technol. 50: 1130–1142.
Baldelli, A. and Rogak, S.N. (2019). Morphology and Raman spectra of aerodynamically classified soot samples. Atmos. Meas. Tech. 12: 4339–4346.
Baldelli, A., Trivanovic, U. and Rogak, S.N. (2019). Electron tomography of soot for validation of 2d image processing and observation of new structural features. Aerosol Sci. Technol. 53: 575–582.
Bambha, R.P., Dansson, M.A., Schrader, P.E. and Michelsen, H.A. (2013). Effects of volatile coatings and coating removal mechanisms on the morphology of graphitic soot. Carbon 61: 80–96.
Barone, T.L., Storey, J.M., Youngquist, A.D. and Szybist, J.P. (2012). An analysis of direct-injection spark-ignition (DISI) soot morphology3 Atmos. Environ. 49: 268–274. Bernard, S., Wirth, R., Schreiber, A., Bowen, L., Aplin, A.,
Mathia, E., Schulz, H., Horsfield, B., Aplin, A. and Mathia, E. (2013). FIB-SEM and TEM investigations of an organic-rich shale maturation series from the lower toarcian posidonia shale, Germany: Nanoscale pore system and fluid-rock interactions. In Electron Microscopy of Shale Hydrocarbon Reservoirs, Camp, W.K., Diaz, E. and Wawak, B. (Eds.), American Association of Petroleum Geologists, 102: 53–66.
Bond, T.C., Streets, D.G., Yarber, K.F., Nelson, S.M., Woo, J.H. and Klimont, Z. (2004). A technology-based global inventory of black and organic carbon emissions from combustion. J. Geophys. Res. 109: D14203.
Brynolf, S., Fridell, E. and Andersson, K. (2014). Environmental assessment of marine fuels: Liquefied natural gas, liquefied biogas, methanol and bio-methanol. J. Cleaner Prod. 74: 86–95.
Chakrabarty, R.K., Moosmüller, H., Garro, M.A. and Stipe, C.B. (2012). Observation of superaggregates from a reversed gravity low-sooting flame. Aerosol Sci. Technol. 46: i–iii.
China, S., Mazzoleni, C., Gorkowski, K., Aiken, A.C. and Dubey, M.K. (2013). Morphology and mixing state of individual freshly emitted wildfire carbonaceous particles. Nat. Commun. 4: 1–7.
Corbett, J.J., Winebrake, J.J., Green, E.H., Kasibhatla, P., Eyring, V. and Lauer, A. (2007). Mortality from ship emissions: a global assessment. Environ. Sci. Technol. 41: 8512–8518.
Corbin, J., Czech, H., Massabò, D., de Mongeot, F.B., Jakobi, G., Liu, F., Lobo, P., Mennucci, C., Mensah, A. and Orasche, J. (2019). Infrared-absorbing carbonaceous tar can dominate light absorption by marine-engine exhaust. Clim. Atmos. Sci. 2: 12.
Corbin, J.C., Peng, W., Yang, J., Sommer, D.E., Trivanovic, U., Kirchen, P., Miller, J.W., Rogak, S., Cocker, D.R., Smallwood, G.J. and Lobo, P. (2020). Characterization of
particulate matter emitted by a marine engine operated with liquefied natural gas and diesel fuels. Atmos. Environ. 220: 17030.
Dastanpour, R. (2016). Characterization of primary particle size variation and its influence on measurable properties of aerosol soot, PhD thesis, University of British Columbia.
Ferraz-Albani, L.A., Baldelli, A., Knapp, C.J., Jäger, W., Vehring, R., Nobes, D.S., Olfert, J.S. and Kostiuk, L.W. (2017). Enhanced evaporation of microscale droplets with an infrared laser. J. Heat Transfer. 139: 011503.
Gonet, T. and Maher, B.A. (2019). Airborne, vehicle-derived Fe-bearing nanoparticles in the urban environment: A review. Environ. Sci. Technol. 53: 9970–9991.
Henning, S., Ziese, M., Kiselev, A., Saathoff, H., Möhler, O., Mentel, T., Buchholz, A., Spindler, C., Michaud, V. and Monier, M. (2012). Hygroscopic growth and droplet activation of soot particles: Uncoated, succinic or sulfuric acid coated. Atmos. Chem. Phys. 12: 4525–4537.
Hesterberg, T.W., Lapin, C.A. and Bunn, W.B. (2008). A comparison of emissions from vehicles fueled with diesel or compressed natural gas. Environ. Sci. Technol. 42: 6437–6445.
Jacobson, M.Z. (2010). Short-term effects of controlling fossil-fuel soot, biofuel soot and gases, and methane on climate, arctic ice, and air pollution health. J. Geophys. Res. 115: 1–24.
Janssen, N.A., Hoek, G., Simic-Lawson, M., Fischer, P., Van Bree, L., Ten Brink, H., Keuken, M., Atkinson, R.W., Anderson, H.R., Brunekreef, B. and Cassee, F.R. (2011). Black carbon as an additional indicator of the adverse health effects of airborne particles compared with PM10 and PM2.5. Environ. Health Perspect. 119: 1691–
1699.
Jung, H.S., Miller, A., Park, K. and Kittelson, D.B. (2013). Carbon nanotubes among diesel exhaust particles: Real samples or contaminants? J. Air Waste Manage. Assoc. 63: 1199–1204.
Kazemimanesh, M., Dastanpour, R., Baldelli, A., Moallemi, A., Thomson, K.A., Jefferson, M.A., Johnson, M.R., Rogak, S.N. and Olfert, J.S. (2019). Size, effective density, morphology, and nano-structure of soot particles generated from buoyant turbulent diffusion flames. J. Aerosol Sci. 132: 22–31.
Khalizov, A.F., Zhang, R., Zhang, D., Xue, H., Pagels, J. and McMurry, P.H. (2009). Formation of highly hygroscopic soot aerosols upon internal mixing with sulfuric acid vapor. J. Geophys. Res. 114: D05208. Kim, W., Sorensen, C.M., Fry, D. and Chakrabarti, A.
(2006). Soot aggregates, superaggregates and gel-like networks in laminar diffusion flames. J. Aerosol Sci. 37: 386–401.
Kook, S., Zhang, R., Chan, Q.N., Aizawa, T., Kondo, K., Pickett, L.M., Cenker, E., Bruneaux, G., Andersson, O. and Pagels, J. (2016). Automated detection of primary particles from transmission electron microscope (TEM) images of soot aggregates in diesel engine environments. SAE Int. J. Engines 9: 279–296.
(2011). Natural-gas fueled spark-ignition (SI) and compression-ignition (CI) engine performance and emissions. Prog. Energy Combust. Sci. 37: 89–112. La Rocca, A., Di Liberto, G., Shayler, P. and Fay, M. (2013).
The nanostructure of soot-in-oil particles and agglomerates from an automotive diesel engine. Tribol. Int. 61: 80–87. Lagally, C.D., Reynolds, C.C.O., Grieshop, A.P., Kandlikar, M. and Rogak, S.N. (2012). Carbon nanotube and fullerene emissions from spark-ignited engines. Aerosol Sci. Technol. 46: 156–164.
Lapuerta, M., Barba, J., Sediako, A.D., Kholghy, M.R. and Thomson, M.J. (2017). Morphological analysis of soot agglomerates from biodiesel surrogates in a coflow burner. J. Aerosol Sci. 111: 65–74.
Lehtoranta, K., Aakko-Saksa, P., Murtonen, T., Vesala, H., Ntziachristos, L., Rönkkö, T., Karjalainen, P., Kuittinen, N. and Timonen, H. (2019). Particulate mass and nonvolatile particle number emissions from marine engines using low-sulfur fuels, natural gas, or scrubbers. Environ. Sci. Technol. 53: 3315–3322.
Li, W., Shao, L., Shen, R., Yang, S., Wang, Z. and Tang, U. (2011). Internally mixed sea salt, soot, and sulfates at Macao, a coastal city in South China. J. Air Waste Manage. Assoc. 61: 1166–1173.
Liati, A., Schreiber, D., Eggenschwiler, P.D., Dasilva, Y.A.R. and Spiteri, A.C. (2016). Electron microscopic characterization of soot particulate matter emitted by modern direct injection gasoline engines. Combust. Flame 166: 307–315.
Liati, A. and Eggenschwiler, P.D. (2010). Characterization of particulate matter deposited in diesel particulate filters: visual and analytical approach in macro-, micro-and nano-scales. Combust. Flame 157: 1658–1670.
Liu, L., Kong, S., Zhang, Y., Wang, Y., Xu, L., Yan, Q., Lingaswamy, A., Shi, Z., Lv, S. and Niu, H. (2017). Morphology, composition, and mixing state of primary particles from combustion sources—crop residue, wood, and solid waste. Sci. Rep. 7: 5047.
Lu, Z., Hao, J., Hu, L. and Takekawa, H. (2008). The compaction of soot particles generated by spark discharge in the propene ozonolysis system. J. Aerosol Sci. 39: 897– 903.
Mari, X., Lefèvre, J., Torréton, J.P., Bettarel, Y., Pringault, O., Rochelle-Newall, E., Marchesiello, P., Menkes, C., Rodier, M. and Migon, C. (2014). Effects of soot deposition on particle dynamics and microbial processes in marine surface waters. Global Biogeochem. Cycles 28: 662–678.
Miljevic, B., Surawski, N.C., Bostrom, T. and Ristovski, Z.D. (2012). Restructuring of carbonaceous particles upon exposure to organic and water vapours. J. Aerosol Sci. 47: 48–57.
Moldanová, J., Fridell, E., Popovicheva, O., Demirdjian, B., Tishkova, V., Faccinetto, A. and Focsa, C. (2009). Characterisation of particulate matter and gaseous emissions from a large ship diesel engine. Atmos. Environ. 43: 2632–2641.
Müller, J.O., Su, D.S., Jentoft, R.E., Wild, U. and Schlögl, R. (2006). Diesel engine exhaust emission: Oxidative
behavior and microstructure of black smoke soot particulate. Environ. Sci. Technol. 40: 1231–1236. Mustafi, N.N. and Raine, R.R. (2009). Electron microscopy
investigation of particulate matter from a dual fuel engine. Aerosol Sci. Technol. 43: 951–960.
Nithyanandan, K., Lin, Y., Donahue, R., Meng, X., Zhang, J. and Lee, C.F. (2016). Characterization of soot from diesel-CNG dual-fuel combustion in a CI engine. Fuel 184: 145–152.
Okada, S., Kweon, C.B., Stetter, J.C., Foster, D.E., Shafer, M.M., Christensen, C.G., Schauer, J.J., Schmidt, A.M., Silverberg, A.M. and Gross, D.S. (2003). Measurement of trace metal composition in diesel engine particulate and its potential for determining oil consumption: ICPMS (inductively coupled plasma mass spectrometer) and ATOFMS (aerosol time of flight mass spectrometer) measurements. SAE Trans. 112: 338–351.
Olfert, J. and Rogak, S. (2019). Universal relations between soot effective density and primary particle size for common combustion sources. Aerosol Sci. Technol.: 53: 485–492.
Patel, M., Ricardo, C.L.A., Scardi, P. and Aswath, P.B. (2012). Morphology, structure and chemistry of extracted diesel soot—Part I: Transmission electron microscopy, Raman spectroscopy, X-Ray photoelectron spectroscopy and synchrotron X-Ray diffraction study. Tribol. Int. 52: 29–39.
Pei, X., Hallquist, M., Eriksson, A.C., Pagels, J., Donahue, N.M., Mentel, T., Svenningsson, B., Brune, W. and Pathak, R.K. (2018). Morphological transformation of soot: investigation of microphysical processes during the condensation of sulfuric acid and limonene ozonolysis product vapors. Atmos. Chem. Phys. 18: 9845–9860. Popovicheva, O., Kireeva, E., Shonija, N., Zubareva, N.,
Persiantseva, N., Tishkova, V., Demirdjian, B., Moldanová, J. and Mogilnikov, V. (2009). Ship particulate pollutants: Characterization in terms of environmental implication. J. Environ. Monit. 11: 2077–2086.
Popovicheva, O., Timofeev, M., Persiantseva, N., Jefferson, M., Johnson, M., Rogak, S. and Baldelli, A. (2019). Microstructure and chemical composition of particles from small-scale gas flaring. Aerosol Air Qual. Res. 19: 2205–2221.
Rockne, K.J., Taghon, G.L. and Kosson, D.S. (2000). Pore structure of soot deposits from several combustion sources. Chemosphere 41: 1125–1135.
Rönkkö, T., Pirjola, L., Ntziachristos, L., Heikkilä, J., Karjalainen, P., Hillamo, R. and Keskinen, J. (2014). Vehicle engines produce exhaust nanoparticles even when not fueled. Environ. Sci. Technol. 48: 2043–2050. Sakurai, H., Tobias, H.J., Park, K., Zarling, D., Docherty,
K.S., Kittelson, D.B., McMurry, P.H. and Ziemann, P.J. (2003). On-line measurements of diesel nanoparticle composition and volatility. Atmos. Environ. 37: 1199– 1210.
Soewono, A. and Rogak, S. (2011). Morphology and Raman spectra of engine-emitted particulates. Aerosol Sci. Technol. 45: 1206–1216.
Prank, M., Soares, J., Vira, J., Kouznetsov, R., Jalkanen, J.P. and Corbett, J.J. (2018). Cleaner fuels for ships provide public health benefits with climate tradeoffs. Nat. Commun. 9: 406.
Sommer, D.E., Yeremi, M., Son, J., Corbin, J.C., Gagné, S., Lobo, P., Miller, J.W. and Kirchen, P. (2019). Characterization and reduction of in-use Ch4 emissions from a dual fuel marine engine using wavelength. Environ. Sci. Technol. 53: 2892–2899.
Swanson, J.J., Febo, R., Boies, A.M. and Kittelson, D.B. (2016). Fuel sulfur and iron additives contribute to the formation of carbon nanotube-like structures in an internal combustion engine. Environ. Sci. Technol. Lett. 3: 364–368.
Timko, M.T., Yu, Z., Kroll, J., Jayne, J.T., Worsnop, D.R., Miake-Lye, R.C., Onasch, T.B., Liscinsky, D., Kirchstetter, T.W., Destaillats, H. and Holder, A.L. (2009). Sampling artifacts from conductive silicone tubing. Aerosol Sci. Technol. 43: 855–865.
Tree, D.R. and Svensson, K.I. (2007). Soot processes in compression ignition engines. Prog. Energy Combust. Sci. 33: 272–309.
Trivanovic, U., Corbin, J.C., Baldelli, A., Peng, W., Yang, J., Kirchen, P., Miller, J.W., Lobo, P., Gagné, S. and Rogak, S.N. (2019). Size and morphology of soot produced by a dual-fuel marine engine. J. Aerosol Sci. 138: 105448. Ushakov, S., Valland, H., Nielsen, J.B. and Hennie, E.
(2013). Particle size distributions from heavy-duty diesel engine operated on low-sulfur marine fuel. Fuel Process. Technol. 106: 350–358.
Virtanen, A.K., Ristimäki, J.M., Vaaraslahti, K.M. and Keskinen, J. (2004). Effect of engine load on diesel soot particles. Environ. Sci. Technol. 38: 2551–2556.
Vyavhare, K., Bagi, S., Patel, M. and Aswath, P.B. (2019). Impact of diesel engine oil additives-soot interactions on physiochemical, oxidation and wear characteristics of soot. Energy Fuels 33: 4515–4530.
Wang, Y., Liu, F., He, C., Bi, L., Cheng, T., Wang, Z., Zhang, H., Zhang, X., Shi, Z. and Li, W. (2017). Fractal
dimensions and mixing structures of soot particles during atmospheric processing. Environ. Sci. Technol. Lett. 4: 487–493.
Xing, J., Shao, L., Zhang, W., Peng, J., Wang, W., Hou, C., Shuai, S., Hu, M. and Zhang, D. (2019). Morphology and composition of particles emitted from a port fuel injection gasoline vehicle under real-world driving test cycles. J. Environ. Sci. 76: 339–348.
Yamamoto, T., Mimura, T., Otsuka, N., Ito, Y., Ehara, Y. and Zukeran, A. (2010). Diesel Pm collection for marine and automobile emissions using Ehd electrostatic precipitators. IEEE Trans. Ind. Appl. 46: 1606–1612. Yuan, Q., Xu, J., Wang, Y., Zhang, X., Pang, Y., Liu, L., Bi,
L., Kang, S. and Li, W. (2019). Mixing state and fractal dimension of soot particles at a remote site in the southeastern Tibetan plateau. Environ. Sci. Technol. 53: 8227–8234.
Zangmeister, C.D., Radney, J.G., Dockery, L.T., Young, J.T., Ma, X., You, R. and Zachariah, M.R. (2014). Packing density of rigid aggregates is independent of scale. Proc. Natl. Acad. Sci. U.S.A. 111: 9037–9041. Zhang, Y., Kim, D., Rao, L., Zhang, R., Kook, S., Kim, K.S.
and Kweon, C.B. (2017). The soot particle formation process inside the piston bowl of a small-bore diesel engine. Combust. Flame 185: 278–291.
Zhang, Y., Yuan, Q., Huang, D., Kong, S., Zhang, J., Wang, X., Lu, C., Shi, Z., Zhang, X. and Sun, Y. (2018). Direct observations of fine primary particles from residential coal burning: Insights into their morphology, composition, and hygroscopicity. J. Geophys. Res. 123: 12964–12979. Zhu, J., Lee, K.O., Yozgatligil, A. and Choi, M.Y. (2005). Effects of engine operating conditions on morphology, microstructure, and fractal geometry of light-duty diesel engine particulates. Proc. Combust. Inst. 30: 2781–2789.
Received for review, January 6, 2020 Revised, February 28, 2020 Accepted, February 28, 2020