Publisher’s version / Version de l'éditeur:
Vous avez des questions? Nous pouvons vous aider. Pour communiquer directement avec un auteur, consultez la première page de la revue dans laquelle son article a été publié afin de trouver ses coordonnées. Si vous n’arrivez pas à les repérer, communiquez avec nous à [email protected].
Questions? Contact the NRC Publications Archive team at
[email protected]. If you wish to email the authors directly, please see the first page of the publication for their contact information.
https://publications-cnrc.canada.ca/fra/droits
L’accès à ce site Web et l’utilisation de son contenu sont assujettis aux conditions présentées dans le site LISEZ CES CONDITIONS ATTENTIVEMENT AVANT D’UTILISER CE SITE WEB.
mAbs, 11, 7, pp. 1300-1318, 2019-07-19
READ THESE TERMS AND CONDITIONS CAREFULLY BEFORE USING THIS WEBSITE. https://nrc-publications.canada.ca/eng/copyright
NRC Publications Archive Record / Notice des Archives des publications du CNRC :
https://nrc-publications.canada.ca/eng/view/object/?id=0c949240-61b0-4677-8818-225315b4f12a https://publications-cnrc.canada.ca/fra/voir/objet/?id=0c949240-61b0-4677-8818-225315b4f12a
NRC Publications Archive
Archives des publications du CNRC
This publication could be one of several versions: author’s original, accepted manuscript or the publisher’s version. / La version de cette publication peut être l’une des suivantes : la version prépublication de l’auteur, la version acceptée du manuscrit ou la version de l’éditeur.
For the publisher’s version, please access the DOI link below./ Pour consulter la version de l’éditeur, utilisez le lien DOI ci-dessous.
https://doi.org/10.1080/19420862.2019.1632114
Access and use of this website and the material on it are subject to the Terms and Conditions set forth at
Binding symmetry and surface flexibility mediate antibody
self-association
Schrag, Joseph D.; Picard, Marie-Ève; Gaudreault, Francis; Gagnon,
Louis-Patrick; Baardsnes, Jason; Manenda, Mahder S.; Sheff, Joey; Deprez,
Christophe; Baptista, Cassio; Hogues, Hervé; Kelly, John F.; Purisima,
Enrico O.; Shi, Rong; Sulea, Traian
Full Terms & Conditions of access and use can be found at
https://www.tandfonline.com/action/journalInformation?journalCode=kmab20
mAbs
ISSN: 1942-0862 (Print) 1942-0870 (Online) Journal homepage: https://www.tandfonline.com/loi/kmab20
Binding symmetry and surface flexibility mediate
antibody self-association
Joseph D. Schrag, Marie-Ève Picard, Francis Gaudreault, Louis-Patrick
Gagnon, Jason Baardsnes, Mahder S. Manenda, Joey Sheff, Christophe
Deprez, Cassio Baptista, Hervé Hogues, John F. Kelly, Enrico O. Purisima,
Rong Shi & Traian Sulea
To cite this article: Joseph D. Schrag, Marie-Ève Picard, Francis Gaudreault, Louis-Patrick Gagnon, Jason Baardsnes, Mahder S. Manenda, Joey Sheff, Christophe Deprez, Cassio Baptista, Hervé Hogues, John F. Kelly, Enrico O. Purisima, Rong Shi & Traian Sulea (2019) Binding
symmetry and surface flexibility mediate antibody self-association, mAbs, 11:7, 1300-1318, DOI: 10.1080/19420862.2019.1632114
To link to this article: https://doi.org/10.1080/19420862.2019.1632114
© 2019 The Author(s). Published with
license by Taylor & Francis Group, LLC. View supplementary material
Published online: 18 Jul 2019. Submit your article to this journal
Article views: 1878 View related articles
REPORT
Binding symmetry and surface flexibility mediate antibody self-association
Joseph D. Schrag*a, Marie-Ève Picard *b, Francis Gaudreault *a, Louis-Patrick Gagnon a, Jason Baardsnes a, Mahder S. Manenda b, Joey Sheff c, Christophe Deprez a, Cassio Baptistaa, Hervé Hoguesa, John F. Kellyc, Enrico O. Purisimaa, Rong Shi b, and Traian Sulea a
aHuman Health Therapeutics Research Centre, National Research Council Canada, Montreal, QC H4P 2R2, Canada;bDépartement de Biochimie, de Microbiologie et de Bio-informatique, PROTEO, and Institut de Biologie Intégrative et des Systèmes (IBIS), Université Laval, Pavillon Charles-Eugène-Marchand, Québec City, QC G1V 0A6, Canada;cHuman Health Therapeutics Research Centre, National Research Council Canada, Ottawa, ON K1A 0R6, Canada
ABSTRACT
Solution stability is an important factor in the optimization of engineered biotherapeutic candidates such as monoclonal antibodies because of its possible effects on manufacturability, pharmacology, efficacy and safety. A detailed atomic understanding of the mechanisms governing self-association of natively folded protein monomers is required to devise predictive tools to guide screening and re-engineering along the drug development pipeline. We investigated pairs of affinity-matured full-size antibodies and observed drastically different propensities to aggregate from variants differing by a single amino-acid. Biophysical testing showed that antigen-binding fragments (Fabs) from the aggre-gating antibodies also reversibly associated with equilibrium dissociation constants in the low-micromolar range. Crystal structures (PDB accession codes 6MXR, 6MXS, 6MY4, 6MY5) and bottom-up hydrogen-exchange mass spectrometry revealed that Fab self-association occurs in a symmetric mode that involves the antigen complementarity-determining regions. Subtle local conformational changes incurred upon point mutation of monomeric variants foster formation of complementary polar interac-tions and hydrophobic contacts to generate a dimeric Fab interface. Testing of popularin silico tools generally indicated low reliabilities for predicting the aggregation propensities observed. A structure-aggregation data set is provided here in order to stimulate further improvements ofin silico tools for prediction of native aggregation. Incorporation of intermolecular docking, conformational flexibility, and short-range packing interactions may all be necessary features of the ideal algorithm.
ARTICLE HISTORY Received 18 March 2019 Revised 6 June 2019 Accepted 11 June 2019 KEYWORDS
Aggregation; native folding; single point mutation; structure-aggregation relationship; prediction method
Introduction
Protein instability in solution is a long-standing problem in the biopharmaceutical industry. It affects many critical aspects of the biologic drug discovery and development process, including binding affinity, biological activity, protein expres-sion, manufacturability, storage, handling, delivery, efficacy, and safety.1–7 Controlling and mitigating aggregation pro-blems by molecular re-engineering in such a multi-factorial landscape is a challenging task.8,9 The challenge is further exacerbated by a relatively limited understanding of aggrega-tion mechanisms at the molecular level, which impacts our ability to accurately predict aggregation propensities upon molecular redesign or modification.10–12
Protein aggregation is commonly perceived as resulting from non-specific interactions between hydrophobic core regions exposed by unfolding or misfolding and is related to the con-formational or folding stability.10,13 Another critical, albeit somewhat under-appreciated14and less well understood,9 path-way for protein aggregation is self-association of natively folded protein monomers.4 These interactions typically lead to
reversible homo-oligomers that may nucleate irreversible aggre-gates in dilute solution,10 and contributes to viscosity at high concentrations required for sub-cutaneous administration.3,15In dilute solution, native self-association is thought to occur mainly due to exposure of hydrophobic patches at the surface of the folded monomers, with some contributions from domain-level charge distributions,11,16,17 whereas at high concentration it is mainly driven by electrostatic forces between the charge distri-butions of the folded structures with secondary contridistri-butions from hydrophobic interactions.18–21
Much of our understanding of protein-protein interactions and self-assembly at the molecular level has been derived from analysis of crystal structures and crystal packing, and more recently from cryo-electron microscopy (cryo-EM) studies.22,23 Substantial efforts have been dedicated to characterizing the self-assembling interfaces deduced from crystal structures in order to discern specific homodimers existing in solution from packing interac-tions occurring at high concentration during crystallization.24–29 This included calculations of interfacial properties such as size, shape, spatial distribution, chemical composition, hydrogen
CONTACTTraian Sulea [email protected] Human Health Therapeutics Research Centre, National Research Council Canada, 6100 Royalmount Ave., Montreal, QC H4P 2R2, Canada
Color versions of one or more of the figures in the article can be found online atwww.tandfonline.com/kmab. *These authors contributed equally to this work.
Supplemental data for this article can be accessed on thepublisher’s website. 2019, VOL. 11, NO. 7, 1300–1318
https://doi.org/10.1080/19420862.2019.1632114
© 2019 The Author(s). Published with license by Taylor & Francis Group, LLC.
This is an Open Access article distributed under the terms of the Creative Commons Attribution-NonCommercial-NoDerivatives License (http://creativecommons.org/licenses/by-nc-nd/4.0/), which permits non-commercial re-use, distribution, and reproduction in any medium, provided the original work is properly cited, and is not altered, transformed, or built upon in any way.
bonding, shape complementarity and interfacial water, with cer-tain property combinations especially helpful in detecting true self-association. In general, larger and more hydrophobic inter-faces with good shape complementarity and fewer internal cavities filled with water are indicative of specific oligomeric interactions, which can be accompanied by local induced-fit conformational changes. The development of the core-rim spatial architecture of protein-protein interfaces also indicated a “dry” hydrophobic interface-core surrounded by a“wet” hydrophilic interface-rim in the case of specific associations, whereas no core can be distin-guished for crystal contacts due to small buried area and residue composition resembling typical protein surfaces.30–32The more objective definition of the newer core-support-rim interface archi-tecture allows calculation of interface propensity scores that can be used to predict the self-association effects of mutations within a given surface patch.33
The fundamental role of symmetric oligomerization in bio-chemistry was recognized long ago by the Monod-Wyman-Changeaux model of allosteric transitions of proteins made up of identical subunits.34It became clear that the difference between monomeric and oligomeric structures is small and can have large effects on structure and function. For example, a single mutation in hemoglobin leads to filament formation and sickle cell.35The importance of symmetry in oligomerization was underscored by studies in which symmetry was used to design oligomerization interfaces and by random mutations that led to assembly into fibers.36Perhaps one of the most compelling molecular views of reversible self-interactions between natively folded proteins is supramolecular symmetric self-assembly into fibers gleaned from single-particle cryo-EM at 7–8 Å resolution.14One fundamental observation stemming from this study is that the naturally evolved tendency of proteins towards homo-oligomerization is deeply rooted in symmetry, which amplifies energetic effects,37triggering formation or destruction of large self-assemblies dependent on a single mutation.
In two cases during the development of therapeutic antibodies, X-ray crystallography has been employed to associate aggregation or high viscosity with symmetric homo-dimerization of the anti-gen-binding fragments (Fabs) via the antigen complementarity-determining region (CDR),38,39and in a third case it has been associated with symmetric homo-tetramerization of the Fabs, also implicating CDR residues.40–42In these cases, a few mutations at the crystallographically observed self-association interface sufficed to eliminate aggregation, suggesting that the contacts observed in the crystal lattice were not merely due to crystal packing, but may reflect true self-assembly modes in solution. Some success in preventing aggregation via mutagenesis targeting aggregation hot spots mapped within the CDR has also been reported, although the implicated self-association interfaces were not directly elucidated at the atomic level.9
We recently conducted a structure-based affinity maturation campaign in which antigen binding and not self-association repre-sented the pressure along an“evolutionary” pathway consisting of only a few dozens of variants.43 Affinity-matured IgG variants differing by a single point mutation were observed to differ sub-stantially in their propensity to aggregate. In this study, we describe biophysical and structural characterization of these variants and their Fabs and investigate the structural determinants of the self-association. We also characterized the aggregation propensities of
the other mutants generated along the original affinity maturation campaign, and built a Structure-native-Aggregation-Relationship (SnAggR) dataset around the crystal structures determined for self-associating Fab variants. This dataset deepens our mechanistic understanding of self-association between natively folded mono-mers, and could spur improvements in in silico structure-based prediction methods for native-folded aggregation.11,16,17
Results
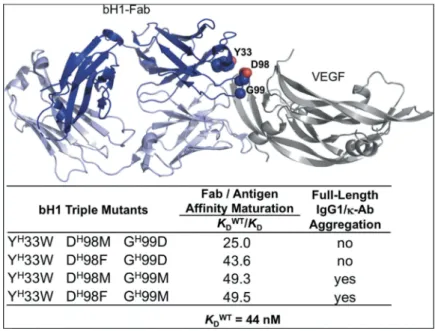
Single substitutions lead to distinct aggregation profiles of full-length antibodies
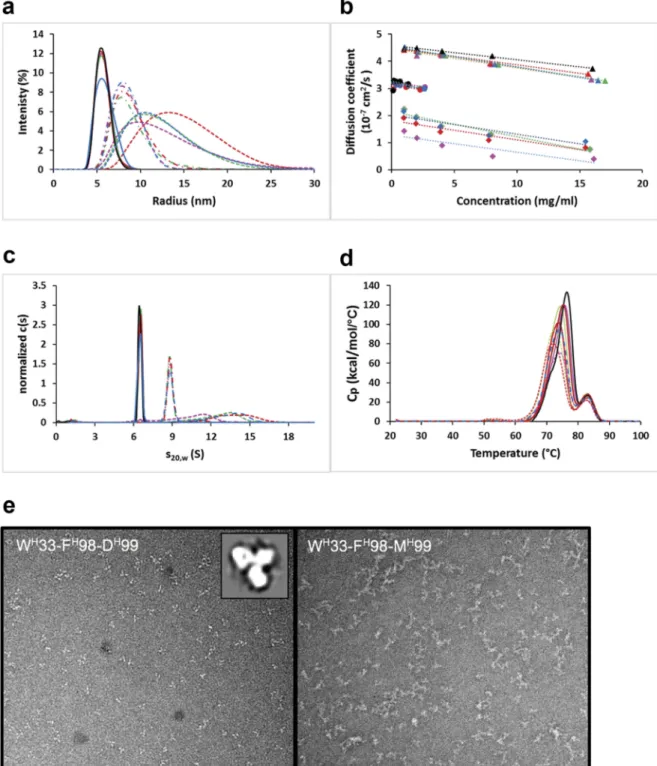
The parental anti-vascular endothelial growth factor (VEGF)-A Fab bH1,44,45and eight variants affinity-matured via the Assisted Design of Antibody and Protein Therapeutics (ADAPT) platform,43were produced as full-length human IgG1 antibodies and underwent a developability assessment in terms of aggrega-tion propensity. The variants included four triple heavy chain mutants (listed in Figure 1) and four variants containing the same triple heavy chain mutations plus an additional light chain mutation. The parental and four affinity-matured variants behave mainly as monomeric antibodies. By size exclusion chromatogra-phy (SEC) we observed a large peak accounting for ~90% of the absorbance with an apparent molecular weight of ~150 kDa, as expected for monomeric protein (Figure S1). Small peaks accounting for the remainder of the absorbance have apparent molecular weights consistent with small oligomers, most of which are expected to be dimers and trimers. Dynamic light scattering (DLS) analysis of the major SEC peak indicates particles with a hydrodynamic radius of ~5.5 nm and a self-diffusion coefficient, D0, of ~4.5 × 10⁻⁷cm2/s (Figure 2(a,b), Table S1) after 2 weeks of
storage at 40°C, both values being consistent with monomeric IgG.46,47Similar diffusion data were obtained at 4°C (Table S1). Sedimentation velocity analytical ultracentrifugation (AUC) data showed a c(s) distribution with >90% of the population sediment-ing as 6.5 S particles (Figure 2(c)), consistent with monomeric IgG. Analysis of the minor SEC peak showed a predominance of ~9 S particles with a hydrodynamic radius of ~8 nm and a diffu-sion coefficient of ~3 × 10⁻⁷cm2/s, all consistent with dimeric IgG. In contrast, the other four affinity matured-variants eluted from SEC columns as broad peaks with unusual elution times indicative of stationary phase interactions, had a broad distribu-tion of hydrodynamic radii greater than 10 nm (Figure 2(a)), diffusion coefficients of 1–2 × 10⁻⁷ cm2/s (Figure 2(b), Table
S1), and showed a broad c(s) distribution with a predominance of 12–15 S particles (Figure 2(c)), all suggesting aggregation into larger multimers, perhaps ranging from trimers to pentamers. These variants remained oligomers at concentrations ranging from 1–20 mg/mL. The melting temperatures (Tm) of all variants
as measured by differential scanning calorimetry (DSC) were found to be similar to that of the parental full-length antibody with a major transition at ~72–76°C and a secondary transition around 83°C (Figure 2(d)), suggesting that self-interactions of the aggregating variants are not a result of major conformational changes that alter thermal stability. The difference between aggre-gating affinity-matured triple mutant monoclonal antibodies (mAbs) and those that did not aggregate was a single amino
acid substitution, Met versus Asp at heavy-chain position H99 (Chothia numbering adopted throughout this work) (Figure 1).
Negative stain transmission electron microscopy (TEM) analysis confirmed these findings. The major SEC peak of the antibody variant having the GH99D mutation contains monodisperse antibodies with the expected “Y” shape (Figure 2(e), left image). By contrast, the antibody variant having the GH99M mutation shows an ensemble of oligomeric structures of varying sizes and geometries, including open-ended as well as circular shapes with discernable“Y”-shaped building blocks (Figure 2(e), right image).
Fabs of aggregating antibodies form dimers
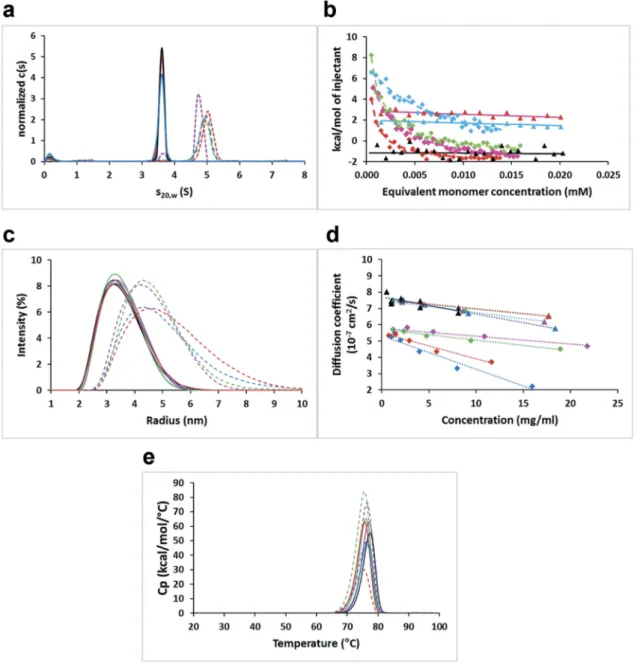
In order to shed light into the aggregation mechanism of the full-length IgG variants, we analyzed the self-association of the corre-sponding Fabs of the affinity-matured variants. At a concentration of 1 mg/mL, sedimentation velocity data indicated over 97% monomer in the cases of the parental bH1 Fab and the affinity-matured triple mutants bearing Asp at position H99, whereas about 90% dimer formation was observed for the affinity-matured variants with Met at this position (Figure 3(a)). This strongly suggests that the full-length antibody variants self-associate via Fab-Fab intermolecular interactions. The equili-brium dissociation constant (KD) calculated from the
sedimenta-tion velocity data using a monomer-dimer fast equilibrium model gave values of 10–50 μM. By isothermal titration calorimetry (ITC) the KD values for the Fab variants forming dimers were
determined to be below 10μM with a large exothermic enthalpy contribution, whereas no binding was detected for the monomeric Fab variants (Figure 3(b)). DLS experiments further corroborated the AUC and ITC data, with lower intrinsic diffusion coefficients (D0) for the preferentially dimeric variants relative to the
predo-minantly monomeric ones after two weeks of storage at 40°C (Figure 3(c,d), Table S2). Similar DLS data were obtained at 4°C
(Table S2), especially in terms of self-diffusion coefficients, D0.
Diffusion interaction parameter, kD, values were generally more
negative after two-weeks storage at 40°C than with storage at 4°C, reflecting an increased tendency for self-interactions due to the stress imposed by storage at higher temperature. The thermal stabilities of these Fab variants are similar to those of the parental bH1-Fab, with Tmvalues measured by DSC around 76°C (Figure
3(e)), which further suggests self-assembly between native-like folded monomers and not via an unfolding pathway.4
Fab dimers display symmetric geometries
In order to gain an atomic-level understanding of Fab dimeriza-tion leading to the aggregadimeriza-tion of full-length antibodies, we determined crystal structures of the four dimeric Fab variants. In each case the asymmetric unit of the crystal is a dimer. As shown inFigure 4for the Fab variant WH33-FH98-MH99, dimer-ization occurs via a non-crystallographic 2-fold symmetry axis mediating head-to-head interactions of the CDRs. The total solvent-accessible surface area (SASA) of two Fab molecules buried upon their association is approximately 2600 Å2, with a per-monomer interfacial area of 1294 Å2. This is well within the range observed for protein-protein interfaces,28and is larger than typical antigen-antibody interfaces,26including the parental bH1 Fab-VEGF complex, which has a total buried SASA of 1542 Å2. Distinguishing dimer interfaces from crystal contacts based on buried surface areas is imperfect, but the interfacial areas observed here are more typical of homodimer interactions than crystal contacts.24,25,27,29 In addition to buried interface area, we calculated a dozen interface properties proposed to help discern true homodimeric interface in solution from crystal packing (Table S3). Taken together, these data confirm that the observed symmetric dimer interface does not fit the crystal packing characteristics. In particular, two powerful discriminat-ing property combinations consistdiscriminat-ing of either: 1) buried
Figure 1.Affinity-matured antibody variants with distinct aggregation behaviors due to single mutation. Location of key positions for affinity maturation on the crystal structure (PDB code 3BDY) of bH1-Fab (heavy chain shown in dark blue, light chain shown in light blue) bound to the VEGF antigen (gray). Affinity maturation data taken from ref. 43.
nonpolar interface area (fnpB) of 1294 Å2, fraction of buried
atoms (fbu) of 41% and residue propensity (RP) score of 3.7;24
or 2) buried interface area (B) of 2588 Å2and gap volume (GV) index of 0.7525assign this interface to the soluble homodimeric class. Crystal structures determined for WH33-MH98-MH99 and
two other dimeric Fab variants indicate the same mode of assembly (Table 1and Figure S2) with similar interface metrics (Table S3). Careful analysis of the electron density maps showed no evidence of methionine oxidation at positionH99, further supported by comparison with electron density maps of
high-Figure 2.Aggregation behavior of parental bH1 and affinity-matured human IgG1/κ full-size antibody variants. (a) DLS intensity distributions. (b) Concentration dependence of the diffusion coefficient as measured by DLS. (c) Sedimentation velocityc(s) distributions normalized to equal total areas. (d) DSC thermograms. In A-D solid lines or triangles represent the main peaks from SEC of parental bH1 (black lines and symbols) or variants containing DH99. The minor SEC peaks of parental bH1 and variants containing DH99 are represented with broken lines (-·-) or circles. Dashed lines (-– -) or diamonds represent variants with MH99. (e) Negative stain
transmission electron microscopy (TEM) images for a DH99 containing variant (left) and an MH99 (right) affinity-matured variant. Sample image at 280k× magnification with a 50-nm scale bar. Inset shows 2D class average of independent particles.
resolution structures (< 1.4 Å) from the Protein Data Bank (PDB) containing methionine sulfoxides. Attempts to crystallize a monomeric Fab variant, the parental bH1, were unsuccessful, possibly due to the absence of significant Fab self-interactions even at the high concentration used for crystallization.
HX-MS supports symmetric self-assembly configuration
Hydrogen exchange– mass spectrometry (HX-MS) was used to confirm the dimerization mode in solution. HX-MS has previously been used to map conformational behavior of self-associating mAb variants.48,49The high propensity for dimerization at work-able experimental concentrations of the WH33-FH98-MH99 var-iant and strictly monomeric behavior of the WH33-FH98-DH99 variant prevented the direct comparison of distinct molecular assemblies for each variant. Therefore, the summed deuteration
(Ds) over 5 timepoints spanning 0.05 to 60 min was compared
between the monomeric (WH33-FH98-DH99) and the dimeric (WH33-FH98-MH99) Fab variants (Figure S3). The full set of kinetic plots are shown in Figure S4. A total of 57 heavy-chain and 57 light-chain peptides were analyzed, resulting in 80 and 99% total sequence coverage, respectively. Peptides overlapping posi-tionH99 were excluded due to inherent differences in the intrinsic exchange rates of Asp and Met mutants, accounting for the lower overall coverage of the heavy chain. A reduction in deuteration was observed in heavy-chain peptides spanning residues NH28-FH67 (CDR-H1/2) and YH100a-LH110 (CDR-H3), and light-chain pep-tides CL23-GL31 (CDR-L1), LL47-LL73 (CDR-L2), and YL 87-FL115 (CDR-L3). Significant differences in summed deuteration (ΔDs) were mostly confined to the CDR regions and the proposed
dimerization interface (Figure S3C). The lack of significant differ-ences in non-interfacial regions suggests that the global
Figure 3.Self-association behavior of parental bH1 and affinity-matured Fab variants. (a) Sedimentation velocityc(s) distributions normalized to equal total areas. (b) ITC plots showing the integrated heats of select Fab variants titrated into buffer and curve-fit to the dimer-dissociation model. (c) DLS intensity distributions. (d) Concentration dependence of diffusion coefficients as measured by DLS. (e) DSC thermograms. Solid lines or triangles represent parental bH1 (black lines or symbols) or variants containing DH99. Dashed lines or diamonds represent variants with MH99.
conformational impact of the mutation is minor. Therefore, observed mass shifts can be attributed to local conformational divergence between the two Fab variants and increased stabiliza-tion as a result of dimerizastabiliza-tion. Our HX results suggest that the symmetric geometry of self-assembly of the Fab variants persists in solution and is not an artifact of crystal packing.
Self-assembly engages short-range complementary interactions
The crystal structure of the dimeric bH1-Fab variant WH33-FH98-MH99 (for primary sequence information see Figure S5) solved at 1.95-Å resolution provides a detailed view of the self-assembly interface. Symmetrical engage-ment between the 6 CDR loops from the two Fab mono-mers leads to numerous polar and non-polar contacts involving predominantly side-chain atoms. No less than 12 direct hydrogen (H)-bonds can be established between
Figure 4.Crystal structure of the dimeric bH1-Fab variant WH33-FH98-MH99, representative of other dimeric Fab structures determined in this study. (a) The overall
geometry is shown on top from two viewing directions. The interface region is expanded in the bottom panels. Interacting Fab molecules are colored in shades of red and blue, with the heavy chains in darker tones and the light chains in paler tones. In the zoomed-in panels, residues establishing intermolecular contacts are rendered as sticks, H-bonds are shown as yellow dashes, and interfacial water molecules and chloride ions are shown as red and green spheres, respectively. Stereoviews detailing dimer interface interactions around key positions, including: (b) inter-Fab contacts implicating CDR-H1 residue WH33 and CDR-H3 residues FH98
and MH99, and (c) inter-Fab contacts established by CDR-L1 residue RL30b present in the related variant WH33-FH98-MH99-RL30b. Residues corresponding to the positions probed in the SnAggR dataset fromTable 2are highlighted by translucent sphere models. Color coding of protein chains is as in (a).
the two Fabs (Figure 4(a)), engaging mainly side-chain atoms of charged (Arg), polar (Ser, Asn) and aromatic (Tyr, Trp) residue types, along with a few H-bonds impli-cating main-chain atoms. This corresponds to ~200 Å2 of buried surface area per direct intermolecular H-bond, which also clearly assigns this interface to the solution
homodimer class and not to crystal packing.25
Additionally, as exchange kinetics are sensitive to changes in the H-bonding network, the two main-chain H-bonds involving backbone amides should be detectable by HX-MS. Protection from exchange was observed in 2 peptides cov-ering TL94(NH) (YL87-VL114 and YL87-FL115), which is involved in H-bonding with SL30b(C = O). The H-bond between FH98(NH) and YH52(C = O) was not detected due to a gap in sequence coverage. A cavity buried at the dimerization interface contains 13 water molecules and 2 atoms interpreted as chloride ions. These solvent molecules establish further water-mediated H-bond bridges between the Fab monomers (Figure S6). This “wet” region of the interface is in sharp contrast with the rest of the interface that is “dry”, consisting of densely packed solute atoms with absolutely no interfacial water molecules. A total of 24 aromatic residues are found in this “dry” region of the dimer interface (7 Tyr, 3 Trp and 2 Phe from each mono-mer), engaging in a variety of aromatic ring-stacking modes, hydrophobic contacts and H-bonds (Figure 4(a)). Aliphatic groups are rare at the interface, and are limited to 6 hydrophobic side-chains (2 Ile and 1 Met from each Fab) and 6 methyl groups (from 3 Thr of each Fab). This dimeric Fab interface appears to fit the “core-support-rim” protein binding model of Levy et al.33since: 1) the number of amino-acid residues involved in each of the core, sup-port and rim categories are comparable; and 2) the buried surface area of the interface core is significantly larger than those of interface support and rim regions.
Local conformational changes upon mutation promote aggregation
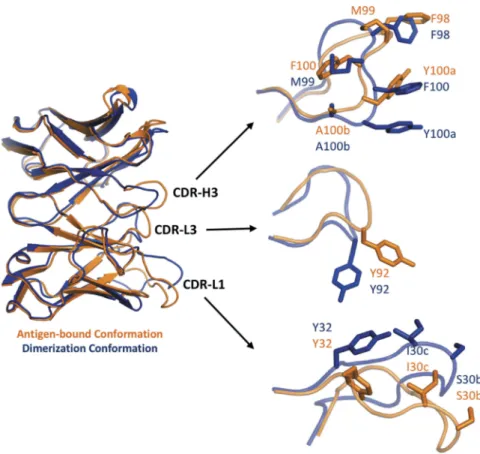
In addition to the dimerizing conformation, the CDR of the bH1-Fab variant WH33-FH98-MH99 can adopt at least one other low-energy conformation, i.e., the antigen-binding conformation. An overlay between these two conformations is shown in Figure 5. Here, a model is shown of the antigen-bound conformation that was previously generated during the ADAPT affinity maturation campaign using the antigen-bound crystal structure of the parental Fab as a template.43–45 Relative to the antigen-bound conformation, the most significant changes seen upon dimerization are located in the CDR-H3 loop, which was targeted during affinity maturation and also establishes extensive direct contacts between the Fab monomers. The CDR-H3 confor-mational change is accompanied by conforconfor-mational changes in the CDR loops L1 and L3, which have a less intimate involvement in the Fab dimerization interface. The flexibil-ity of the solvent-exposed loop CDR-L1 has been previously reported.44,45
The two sets of CDR conformations are specific for their cognate partners. When superimposed onto the antigen-bound structure, the dimerization conformation would clash with VEGF. Similarly, two Fab molecules in the anti-gen-binding conformation would clash if they approach each other in the observed dimerization mode (Figure S7). A rotation in the CDR-H3 main-chain torsion angles around the YH100a-AH100b peptide bond leads to different exposures of side chains FH98, MH99, FH100 and YH100a (Figure 5), making them fitted either for antigen binding or for self-association. The duality of CDR-H3 loop conforma-tions may rely on the fact that both MH99 or FH100 are capable of strong non-polar packing into an intramolecular hydrophobic pocket, stabilizing either the dimerization or the antigen-binding conformations, respectively. The
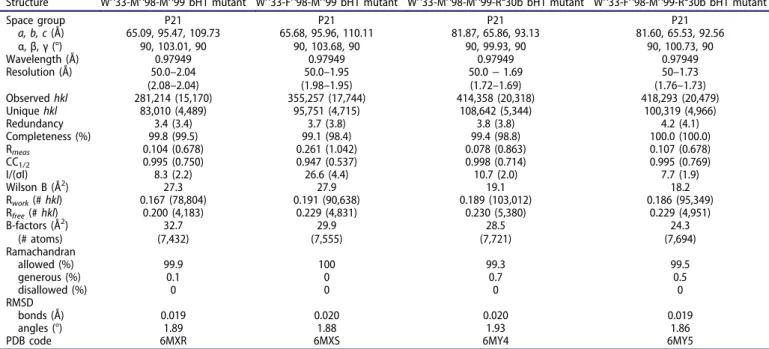
CDR-Table 1.X-ray data collection and refinement statistics.
Structure WH33-MH98-MH99 bH1 mutant WH33-FH98-MH99 bH1 mutant WH33-MH98-MH99-RL30b bH1 mutant WH33-FH98-MH99-RL30b bH1 mutant
Space group P21 P21 P21 P21 a, b, c (Å) α, β, γ (°) 65.09, 95.47, 109.7390, 103.01, 90 65.68, 95.96, 110.11 90, 103.68, 90 81.87, 65.86, 93.13 90, 99.93, 90 81.60, 65.53, 92.56 90, 100.73, 90 Wavelength (Å) 0.97949 0.97949 0.97949 0.97949 Resolution (Å) 50.0–2.04 (2.08–2.04) 50.0–1.95 (1.98–1.95) 50.0− 1.69 (1.72–1.69) 50–1.73 (1.76–1.73) Observedhkl 281,214 (15,170) 355,257 (17,744) 414,358 (20,318) 418,293 (20,479) Uniquehkl 83,010 (4,489) 95,751 (4,715) 108,642 (5,344) 100,319 (4,966) Redundancy 3.4 (3.4) 3.7 (3.8) 3.8 (3.8) 4.2 (4.1) Completeness (%) 99.8 (99.5) 99.1 (98.4) 99.4 (98.8) 100.0 (100.0) Rmeas 0.104 (0.678) 0.261 (1.042) 0.078 (0.863) 0.107 (0.678) CC1/2 0.995 (0.750) 0.947 (0.537) 0.998 (0.714) 0.995 (0.769) I/(σI) 8.3 (2.2) 26.6 (4.4) 10.7 (2.0) 7.7 (1.9) Wilson B (Å2) 27.3 27.9 19.1 18.2 Rwork(#hkl) 0.167 (78,804) 0.191 (90,638) 0.189 (103,012) 0.186 (95,349) Rfree(#hkl) 0.200 (4,183) 0.229 (4,831) 0.230 (5,380) 0.229 (4,951) B-factors (Å2) (# atoms) 32.7 (7,432) 29.9 (7,555) 28.5 (7,721) 24.3 (7,694) Ramachandran allowed (%) 99.9 100 99.3 99.5 generous (%) 0.1 0 0.7 0.5 disallowed (%) 0 0 0 0 RMSD bonds (Å) 0.019 0.020 0.020 0.019 angles (°) 1.89 1.88 1.93 1.86
H3 antigen-binding conformation might be slightly more stable than the dimerizing conformation, since this same conformation has been previously observed in complex with two different antigens of completely unrelated structures.44,45
Structure-native-aggregation relationship along the affinity maturation path
The ADAPT platform affinity matures an existing antibody by focusing on only a few CDR amino-acids and requires stepwise generation of only a small set of mutants, typically 30–50.43,50 That self-association can be observed within such a limited set of variants is noteworthy and reinforces recent views on the vulner-ability of proteins to self-assembly.14,51–53Analysis of the points along this affinity maturation path at which self-association occurs could be instructive and advise as to how readily aggrega-tion is induced by a single mutaaggrega-tion. To this end, we reconsti-tuted the ADAPT trail of heavy-chain mutants from the parental bH1-Fab leading to the affinity matured species including the self-associating triple mutants. We also included another affi-nity-maturing mutation at a fourth position, SL30bR in the light chain. Table 2 presents experimental data for self-association propensities in this SnAggR set consisting of the parental bH1-Fab and 32 affinity-matured variants with systematic substitu-tions at 4 CDR posisubstitu-tions.
The greatest improvement in the antigen binding affinity resulted from the presence of a hydrophobic amino acid (Met, Trp or Phe) at position H98. Secondary selections along the maturation path involved mutations at positionsH33 andH99. None of the designed single or double-point mutants of the parental Fab at these three positions show signs of self-association. However, given any combination of designed mutations at two of these sites, designed mutations at the third site triggers self-association. Given hydrophobic residues at H98 and H99, position H33 becomes a switch that may trigger self-association. Even the conservative substitution YH33W in this context is sufficient to initiate self-association. The double mutant with YH33W in addition to a hydrophobic residue atH98 is not prone to self-association, but in this context, a single mutation at positionH99 to a Met residue renders the molecule prone to self-association. The double mutant containing both YH33W and GH99M is not prone to self-association. In this case, it is mutation of posi-tionH98 to a hydrophobic residue that becomes the trigger for self-association. The double-point mutants of the parental Fab can be regarded as single-point mutants with respect to the aggregating triple mutants, and as such underscore the fact that single mutations can become the tipping points toward self-association. The crystal structures of dimeric triple mutants shed light on the self-associating roles of residues at these positions.
As mentioned earlier, the dimerization interface deter-mined here obeys the core-support-rim protein interaction
Figure 5.Local CDR conformational changes required for self-association. The variable domain of the bH1-Fab variant WH33-FH98-MH99 is shown on the left as an overlay between its dimerization conformation (crystal structure) and antigen-bound conformation (modeled on the antigen-bound structure of the parental bH1-Fab; PDB code 3BDY). The largest conformational changes are seen for three CDR loops as detailed on the right.
Table 2. Structure-native-aggregation-relationship (SnAggR) data set of affinity-matured Fabs. Mutated CDR positions b Tm (°C) D0 (10 – 7 cm 2 /s) d dimer % e KD dimer (μ M) Res. (Å) Affinity maturation cycle ΔΔ Gbind a (kcal/mol) SPR H33 H98 H99 L30b DSF c DSC DLS AUC AUC ITC X-ray Parent Reference YD G S 81.1 77.4 7.9 2.8 16000 NB NC Singles − 0.09 WD G S 80.8 7.8 1.2 1469000 − 1.33 YM G S 80.9 7.8 1.4 179000 − 1.18 YF G S 80.6 7.6 1.0 1290 − 1.23 YW G S 76.7 6.9 2.8 5730 − 0.48 YD M S 79.9 8.1 2.4 220000 − 0.22 YD G R 76.7 7.7 2.6 8940 Doubles − 1.26 WM G S 80.6 7.8 1.8 5120000 − 1.74 WF G S 76.7 7.4 3.3 3210 NB − 1.57 WW G S 76.3 7.7 1.4 2680 − 1.75 YM M S 80.6 7.8 2.1 19900 − 1.13 YF M S 80.2 7.5 8.1 499 NB − 1.42 YW M S 79.8 7.5 1.1 725 − 1.17 WD M S 80.4 7.8 2.5 35800 NB − 1.23 YF G R 80.0 7.7 0.6 12800 Triples − 2.27 WM M S 79.7 76.4 5.9 86.1 27 8.4 2.04 − 2.30 WF M S 79.7 76.2 5.0 93.0 15 4.2 1.95 − 1.96 WW M S 79.5 75.9 6.5 78.6 74 45 − 1.91 WM D S 80.5 76.7 7.8 1.8 2910 − 2.22 WF D S 79.8 76.5 7.8 0.9 15400 NB − 2.72 WW D S 79.6 76.1 7.6 2.7 3240 − 1.71 YM M R 80.1 76.3 7.3 0.3 1210000 NB − 1.58 YM D R 80.7 77.0 7.8 0.6 185000 − 1.88 YW D R 79.3 7.6 4.1 4530 − 0.97 YW R R 76.0 6.7 46.7 132 174 − 1.51 WM G R 75.7 7.6 1.6 5610 − 1.09 WF G R 80.4 7.9 1.0 72500 NB Quads − 2.27 WM M R 79.6 75.6 6.1 89.2 13 3.1 1.69 − 2.42 WF M R 79.2 75.2 5.8 93.5 13 2.1 1.73 − 2.07 WW M R 80.0 75.1 6.1 86.7 36 22 − 1.89 WM D R 79.9 76.0 7.7 0.9 3980 − 2.04 WF D R 80.0 75.7 8.1 1.1 79100 NB − 2.57 WW D R 79.0 75.2 7.6 1.2 1330 aAntigen binding affinity data taken from ref. 43 except for the Triples and Quads with arginine at position L30b determined in this study. ΔΔ Gbind = ΔG bind (Mutant) – ΔG bind (Parent). b Chothia numbering scheme. Amino-acids mutated relative to the Parent are highlighted. cSee Table S4 for standard deviations. d After 14 days of storage at 40°C. Concentration dependence of diffusion coefficients is shown in Figure S11 that also includes data at time-point zero and at 4°C. Diffusion coefficients at tested concentration, as well as calculated self-diffusion coefficients and diffusion interaction parameters are listed in Tables S2. eDetermined at 1 mg/mL concentration. NB: no binding. NC: no crystals.
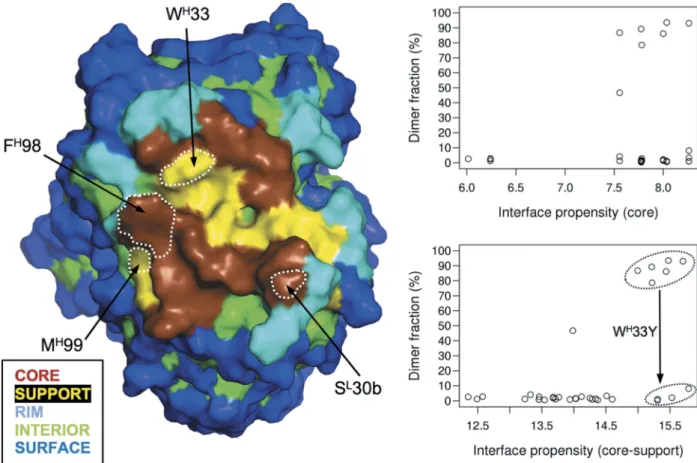
model.33The component interface categories according to this model are shown in Figure 6. An interesting question is whether, starting with this a priori determined assembly mode, the interface core propensity (ICP) score associated with the core-support-rim model33 can explain the self-association trends in the SnAggR dataset. We found that the ICP score calculated only for the interface core residues is not able to correctly classify this data set in terms of self-association propensity (Figure 6, right upper plot). Notably, including interface support residues in the interface propen-sity calculations improves the classification (Figure 6, right bottom plot). However, some variants remain over-predicted to self-associate even with the combined interface core+sup-port propensity (ICSP) score.
The main culprit for this misclassification is the interface support residue WH33. It packs tightly against three aromatic rings from the partner Fab molecule and two intramolecular aromatic residues, each occurring twice per Fab dimer due to the symmetry of the interaction mode (Figure 4(b)). Molecular modeling indicated that a Tyr side-chain would fit less well energetically in this stacking mode, with most of the calculated loss of binding affinity upon WH33Y mutation arising from van der Waals contributions (Figure S8). Calculations also indicated that Phe at position H33 would lead to a further reduction in the tendency for self-association due to the additional loss of an inter-chain H-bond contact
(Figure S8). However, even after including the support cate-gory in the propensity calculation, the ICSP score fails to discriminate YH33 variants, which are predominantly mono-meric, from self-associating WH33 containing variants (Figure 6). Understandably, the stickiness scale,33 used for ICSP cal-culations, is unable to capture the intricate details of short-range interactions established in the complex.
Residue MH99 also belongs to the support category, having a small surface area buried upon self-association. The crystal structures of the dimeric Fab variants show that the MH99 side chain does not interact with the partner Fab, but rather with an intramolecular hydrophobic pocket (Figure 4(b)). Introducing the charged Asp side chain or the parental Gly residue at this position completely eliminates self-association, despite the fact that these substitutions appear not to intro-duce direct steric or electrostatic conflicts in the observed dimerization mode. Inclusion of this support residue in the interface propensity score calculation led to improved corre-lation with the observed trends in the SnAggR dataset, even though over-prediction of self-association for some of the variants (e.g., bearing GH99) still remains. One possible expla-nation is the conformational freedom of the CDR-H3 loop described earlier, with destabilization of the dimerization con-formation by mutating MH99 to flexible (GH99) or charged (DH99) residues.
Figure 6.Correlations of experimental self-association propensities in the SnAggR dataset with calculated interface propensities based ona priori knowledge of the self-assembly mode. Experimental AUC data on dimer fraction is taken fromTable 2. Surface categories and interface core propensity (ICP) and interface core+support propensity (ICSP) scores are based on the core-support-rim protein interaction model of Levy et al.33Key positions in the SnAggR dataset are delineated by white dotted contours on the surface map on the left.
At position
H98, mutating Asp to hydrophobic
resi-dues converts a completely monomeric Fab (bearing
W
H33 and M
H99) into a self-associating protein. There
appears to be some tolerance at this position for several
hydrophobic side chains, as either Met, Phe or Trp lead
to Fab dimers, albeit with different self-association
strengths that vary in the order Trp < Met < Phe. The
crystal structures show that position
H98 interacts
inter-molecularly with itself (
Figure 4(b
)). In the parent
molecule, two charged Asp side chains at this position
would face one another and may lead to an electrostatic
incompatibility in addition to the loss of non-polar
packing, thus explaining the absence of
self-association
of
the
D
H98-containing
variants.
A hydrophobic residue at position
H98 clearly belongs
to the interface core, with interface propensity scores
accounting for the SnAggR dataset trends at this
position.
The SL30bR mutation in the CDR-L1 loop of the light chain appears to further strengthen the affinity of the dimeric Fab variants (Table 2). While the increased presence of hydrophobic residues exposed at the protein surface is typically considered indicative of stronger self-association,11,17this mutation demon-strates that other factors may also come into play. In order to understand the structural basis for this behavior, we solved the crystal structures of two Fab variants that incorporate RL30b along with WH33, M/FH98 and MH99. These structures show that the introduced Arg side chain of each Fab in the dimer establishes salt-bridge contacts with two Asp side chains, one each from the light and heavy chains of the partner Fab (Figure 4 (c)). Interestingly, theL30b position changes classification from interface core for the parental Ser to interface rim for the mutant Arg. In the context of RL30b, the variant with Arg at positionH99 showed a reasonable level of dimerization (Table 2), possibly owing to the aliphatic portion of its side chain and to a possible additional intramolecular salt-bridge contact with DH101. Notably, this variant introducing two Arg side chains, RL30b and RH99, partially dimerized in the presence of YH33 that is suboptimal for dimer formation, as discussed earlier.
Performance of in silico methods for aggregation prediction
In contrast with the above analysis based on interface propensity scores, aggregation predictions in typical real-life prospective research have to be made without a priori knowledge of the self-association structure. Using the SnAggR data set, we evaluated several popular aggregation prediction methods. The most rele-vant for our study of self-association between folded monomers are the 3-dimensional (3D)-structure-based methods. In this category, we evaluated 4 approaches: 1) the Spatial Aggregation Propensity (SAP) method based on molecular dynamics (MD) ensembles;11,162) the SAP-related Developability Index (DI),17 which was fitted to the present data; 3) the AGGRESCAN3D method in both static and dynamics modes;54and 4) the struc-turally corrected version of the CamSol algorithm.55Although sequence-based methods are more suitable for predicting aggre-gation via the unfolding pathway, including the propensity to form β-amyloid fibrils, we nevertheless tested several of the
many methods available in this category, including
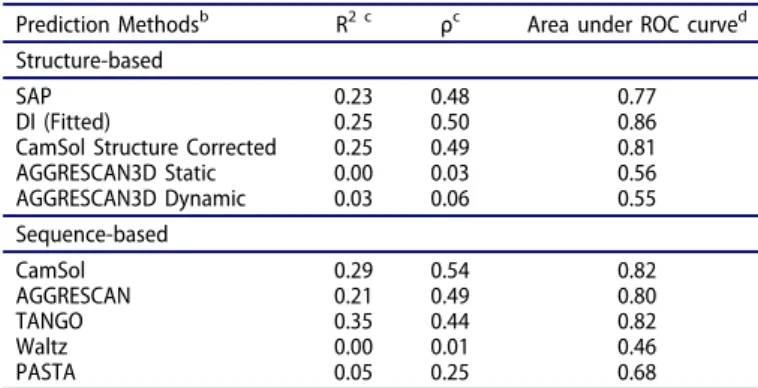
AGGRESCAN,56CamSol,55Waltz,57TANGO,58and PASTA.59 We note that this is not an exhaustive list, and interested practi-tioners may want to use our SnAggR data set for their own evaluation of other preferred methods. Aggregation prediction methods were assessed for their performance in terms of classi-fication of aggregation propensities measured as the fraction of dimer at 1 mg/mL, as well as for more quantitative ranking of aggregation propensities expressed as the logarithm of measured dimer dissociation constant. Performance metrics are given in Table 3, with prediction data for all variants listed in Table S5.
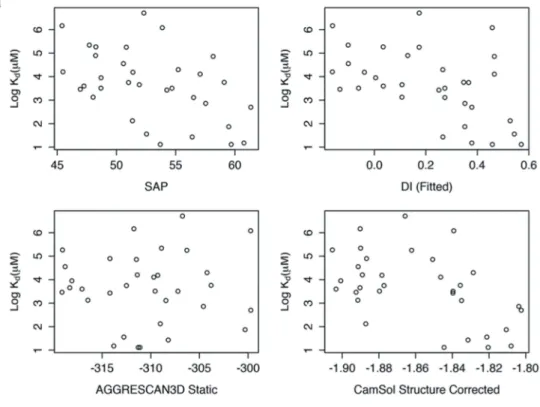
As can be seen, predictions obtained with the tested struc-ture-based methods showed only weak quantitative correlations with experimental aggregation propensities in our systematic SnAggR data set (Table 3,Figure 7(a), Figure S9). The perfor-mance for some of these methods increased to a moderate level when employed as classification tools, as indicated by the area under receiver-operating-characteristic (ROC) curve values reaching ~0.8 (ranging from 0.5 for random to 1 for perfect classifications). Notably, these performance levels for both quan-titative and qualitative predictions were not superior to those that could be obtained by some sequence-based methods (Table 3,Figure 7(b), Figure S10). Clearly, there was no advantage of including the 3D-based properties that were calculated on unbound structures, i.e., without evaluating possibilities to form self-assembled states. This suggests flexible protein-protein self-docking as a possible way towards improving native-state aggregation predictions.
Discussion
VThe notion that hydrophobic surface patches drive protein aggregation is widely accepted and has motivated efforts to predict hot spots for antibody aggregation.16In a test case of the predictive method, mutations in the CDR loops were found to meet the selective criteria of reducing aggregation, but sometimes at the expense of antigen interaction.16 In contrast, our study arises from an affinity maturation cam-paign in which antibody-antigen interactions were improved
Table 3.Performance of various aggregation prediction methods on the SnAggR set.a
Prediction Methodsb R2 c ρc Area under ROC curved
Structure-based
SAP 0.23 0.48 0.77
DI (Fitted) 0.25 0.50 0.86 CamSol Structure Corrected 0.25 0.49 0.81 AGGRESCAN3D Static 0.00 0.03 0.56 AGGRESCAN3D Dynamic 0.03 0.06 0.55 Sequence-based CamSol 0.29 0.54 0.82 AGGRESCAN 0.21 0.49 0.80 TANGO 0.35 0.44 0.82 Waltz 0.00 0.01 0.46 PASTA 0.05 0.25 0.68 a
Raw data given in Table S5.
bSee Methods section for details. c
Squared Pearson correlation coefficients and Spearman rank-order correlation coefficients are based on dimer LogKd(μM) data determined by analytical
ultracentrifugation and listed inTable 2and Table S5.
dArea under ROC curve (see alsoFigure 7(b)) values are based on dimer % data
by mutation of residues in the CDR loops of the antibody.43 We have shown that selection based on affinity introduced some hydrophobic residues that inadvertently generated
a propensity for symmetric Fab-Fab interactions that lead to aggregation of the antibodies.
Multiple modes of antibody self-association including Fab-Fab, Fab-Fc and Fc-Fc interactions have been documented.60
Figure 7.Performance of various popularin silico methods for aggregation predictions on the SnAggR data set without a priori knowledge of the self-assembly mode. (a) Scatter plots of experimentally measured self-association propensities expressed as the logarithm of dimer dissociation constant (Kd) determined by analytical
ultracentrifugation (Table 2)versus aggregation predictions from 3D-structure based methods (see methods section for details). Shown data is generated using the antigen-bound conformation of the CDR (PDB code 3BDY). Alternate predictions generated using the homo-dimeric conformation of the CDR (determined in this work) are provided in Figure S9. (b) Performance of structure and sequence-based methods in terms of classification of aggregation propensities. Receiver operating characteristic (ROC) curves are shown based on the 7 positives (>40% dimer) and 26 negatives (<10% dimer) in the SnAggR data set, with dimer fractions at 1 mg/mL concentration determined experimentally by analytical ultracentrifugation (Table 2). SeeTable 3for associated area under ROC curve values. Predicted values for all variants are listed in Table S5.
Since affinity maturation mutations studied here are in the CDR, Fc-Fc associations are not expected to play a role in self-association in this case. The strong correlation between mAb aggregation and Fab dimerization (Figures 2and3) indicates that the Fab-Fc interactions are also not a major factor.
Our structural data revealed that the antigen-recognition loops (CDR) are directly implicated in the Fab-Fab symmetric interaction interfaces examined here. Large surface areas become buried and the majority of interactions are hydro-phobic, although some polar residues and interactions as well as water-mediated contacts are also involved. These “sticky” surface patches formed mainly by aromatic residues do not interact non-specifically, but instead require precise aromatic stacking and are intertwined with short-range polar contacts such as H-bonds and salt-bridges across the interface. A noteworthy finding of this study, however, is that critical residues for self-association do not have to make direct con-tact across the interface, but instead seem to act as stabilizers of the dimerizing conformation. The best example is MH99, which appears to stabilize the CDR-H3 loop in the dimerizing conformation. With a solvent-exposed hydrophobic side-chain located near, but not engaged in, the homodimeric interface, MH99 is also classified as a support residue accord-ing the core-support-rim architecture of protein-protein interfaces.30,33Thus, another class of critical residues for self-association should also be taken into consideration, which consist of interface support residues located in flexible regions (such as antibody CDR-H3 loops) and which are capable of stabilizing self-associating conformations.
The favorable contribution of surface flexibility towards allowing productive conformations for self-association can also benefit from symmetry amplification. Another example revealed here is located in the flexible CDR-L1 loop allowing formation of intermolecular salt-bridges upon introduction of a charged Arg residue at positionL30b, which is formed twice in the homo-dimeric Fab. The hinge region connecting the Fab and Fc por-tions of full-size, homo-dimeric, IgG antibodies is another flexible region that not only enhances binding avidity, but can also modulate the size and shape of the higher-order homo-oligomers that can be created on the basis of symmetric contacts of each Fab arm, as revealed by electron microscopy images.
Given that low-energy self-assemblies are more likely symmetrical,37it is reasonable to expect that self-association by symmetric contacts is not limited to the variants studied here, but is a widespread mechanism of natively-folded aggregation. General support for this hypothesis is found in a recent study showing that symmetry amplifies supramolecular self-assemblies.14 The “all-or-nothing” behavior observed upon mutation of key positions can be explained on the basis of symmetry amplification of residue contributions to binding affinity, which also contributes to the high occurrence of sym-metric homo-oligomeric proteins in nature.14 Mutating a residue that makes contacts across a symmetric interface, including self-contact, has a doubly disruptive effect relative to mutating a non-symmetric contact. On the basis of symmetry amplification, it is thus not surprising that, in the previously confirmed cases of symmetric self-assemblies, disaggregation was achieved upon mutation of only a few residues.38–40,42
Symmetry effects may also contribute to the buffering effect of Asp and other charged residues in protecting against aggregate formation.14,61Introduction of Asp at the self-interacting posi-tionH98 of the Fab-Fab interface observed here provides a direct illustration of this buffering phenomenon at the structural level. The interfaces generated in the affinity maturation exercise have most of the features of known interfaces– buried surface area is significant and comparable to so-called specific interfaces, a cluster of hydrophobic residues contributes significantly to the buried surface, a conformational change contributes to the inter-action, complementary surfaces are generated, and few amino acid changes are required to tip the balance toward or away from aggregation. Despite all of those previously observed factors in protein-protein interaction, the sequence and structure-based predictive methods failed to reliably identify the self-aggregating variants. Our structural data is further enriched by aggregation measurements for a set of 33 variants with systema-tic mutations at key positions of the self-assembly interface. A SnAggR data set with this level of detail, which significantly augments the previous mutagenesis data on structurally charac-terized Fab self-assembled interfaces,38–40,42should be extremely useful for improving computational tools for native aggregation predictions.
Our study demonstrates that improvements must be made with respect to several aspects. Firstly, aggregation predictions with popular structure-based methods, which profile the folded monomer without evaluating possible self-assembled states, did not show quantitative correlations with the data in the present SnAggR set (Figure 7(a) and Figure S9). In fact, there was no clear advantage of including the 3D-structural information, as some of the sequence-based methods showed similar perfor-mances (Table 3, Figure 7(b) and Figure S10). This indicates that profiling the monomer structure may not be sufficient, and suggests that further improvements may necessarily require incorporation of structural predictions of protein-protein com-plexes, i.e., protein docking. Secondly, in the present case, 100-ns MD simulations were unable to achieve conversion of the anti-gen-bound conformation to the dimerization conformation of the CDR (data not shown), indicating that conformational sam-pling of the monomeric state via room-temperature MD may be insufficient for accurate prediction of self-interactions. Thirdly, short-range polar interactions do contribute to the self-assembly interface and subtle changes, such as residues with very similar hydrophobicities (e.g., Trp, Tyr, Phe), can lead to vastly different aggregation behaviors due to differences in packing and even H-bonding requirements. Exclusive focus on exposed hydro-phobicity and coarse electrostatics is thus not sufficient for accurate prediction of aggregation. Self-docking simulation of thoroughly explored ensembles of surface conformations emerges as the appropriate approach to address the required level of complexity observed in this study. Significant efforts have been deployed to improve these computational technolo-gies with some progress currently being made.62–65 Undoubtedly, protein engineering and antibody optimization will benefit greatly from more accurate predictions of native aggregation. Finally, most computational methods deal with the mechanistic aspects of aggregation and, thus, are meant to reflect the thermodynamics of reversible equilibria such as
non-covalent binding of natively folded monomers (as in this work) or reversible partial unfolding equilibria. However, within the complex pathways of aggregation, post-nucleation events and irreversible unfolding in non-native aggregation are mainly under kinetic control.4 Experimental measurement of kinetic effects uncoupled from thermodynamically controlled stages of aggregation would be useful for devising and calibrating com-putational tools intended to also capture kinetic contributions to the overall aggregation process.
Materials and methods Protein production
cDNA for the heavy and light chains of Fab and full-size human IgG1/κ antibody variants of bH1 were ordered from commercial vendors (Thermo-Fisher/Life Technologies Inc., Burlington, ON, Canada; GENEART, Regensburg, Germany). These contained signal peptide sequences, and for Fab var-iants heavy-chain C-terminal His8 tags. Productions were
carried out by co-transfection of CHO-3E7 cells as described previously,43 at various scales between 200 mL and 1 L. Transfections were performed at a cell density between 1.8 × 10⁶ to 2.0 × 10⁶ cells/mL with viability greater than 98%. Cells were distributed in 1.0 L to 2.8 L-shaker flasks and transfected with 1μg of total DNA per 1 mL of production (50% of total DNA contained heavy chain and light chain constructs at ratios of 1:1 (w/w)) using PEI MAXTM (Polysciences, Inc., Warrington, PA). The final DNA:PEI MAXTM ratio was 1:4 (w/w). Cell cultures were incubated for 24 h on an orbital shaking platform at an agitation rate of 110 rpm at 37°C in a humidified 5% CO2 atmosphere.
Twenty-four hours later, the cultures were fed with Tryptone N1 at 1% w/v final and Valproic acid sodium salt at 0.5 mM final concentration and transferred to 32°C for 6 days. Cell density and cell viability were determined by direct counting of cell samples with a Vi-CELL automated cell counting system (Beckman Coulter Life Sciences, Indianapolis, IN) using the trypan blue dye exclusion method.
Protein purification
Purifications from cell-culture supernatants were performed by immobilized metal-affinity chromatography for Fab var-iants and protein-A affinity chromatography for the full-size antibodies (FSAs) having a human IgG1 framework. Fab samples were loaded onto a 1 mL HisTrapTM Excel column (GE Healthcare Life Sciences, Uppsala, Sweden) equilibrated in HyCloneTM Dulbecco’s phosphate-buffered saline (DPBS). The column was washed with DPBS and Fabs were eluted with 500 mM imidazole in DPBS. Fractions containing the Fabs were pooled and the imidazole buffer was exchanged against DPBS on PD10 columns (GE Healthcare Life Sciences). For FSAs, purifications of cell-culture supernatants were performed by loading the FSAs onto a 5 mL MabSelectTM SuReTM column (GE Healthcare Life Sciences) equilibrated in DPBS. The column was washed with DPBS and FSAs were eluted with 100 mM citrate buffer pH 3.6. The 3 × 10 mL fractions containing FSAs were pooled and the
citrate buffer was exchanged against DPBS on CentriPure P100 columns (EMP Biotech, Berlin, Germany). Purified Fabs and FSAs were aseptically filtered through 0.2μm filters. All affinity purified samples were further purified by prepara-tive SEC on Superdex-200 pg columns (GE Healthcare Life Sciences). Selected peak fractions were concentrated by ultra-filtration using Vivaspin® 6 centrifugal concentrators with a membrane molecular weight cut off of 10 kDa (GE Healthcare Life Sciences) at 15°C following the manufac-turer’s instructions. During the process, the protein
concen-tration was monitored on a NanoDrop™ 2000
spectrophotometer (Thermo Fisher Scientific, Waltham, MA) using absorbance at 280 nm and the calculated specific extinction coefficient of each variant.
Differential scanning fluorimetry
Differential scanning fluorimetry (DSF) was used to deter-mine the melting temperatures (Tm) of the Fab variants.
DSF was carried out in a Rotor-Gene 6000 real-time PCR
instrument (Corbett Life Science, Mortlake, NSW,
Australia). Samples were diluted in DPBS (GE Healthcare Life Sciences) to a final concentration of 0.33 mg/mL. A total volume of 30 μL in 0.2 mL thin wall PCR tubes (Axygen, Oneonta, NY) was used. SYPRO® Orange (Life Technologies, Burlington, ON, Canada) was diluted 1,000-fold from the 5,000× concentrated stock to the working dye solution in DPBS and 15μL was added to 15 μL of sample just prior to the experiment. Thermal denaturation was carried out by increasing the temperature from 30°C to 94°C at a rate of 0.06°C/s. Fluorescence intensity, with excitation at 470 nm and emission at 610 nm, was collected at 1°C intervals and was analyzed with the Rotor Gene 6000 series software v1.7 (Corbett Life Science). The Tmvalues were determined from
the peak of the first derivative transformation of the raw data. Each sample was measured at least in triplicate and the average Tm values and standard deviations were reported
(Table S4).
Differential scanning calorimetry
DSC was used to determine the thermal transition midpoint (Tm) of selected Fabs and of FSAs. DSC experiments were
performed using a VP-Capillary DSC system (Malvern Instruments Ltd, Malvern, UK). Samples were diluted in DPBS (GE Healthcare Life Sciences) to a final concentration of 0.4 mg/mL. Thermal denaturation was carried out under 70 psi of nitrogen pressure by increasing the temperature from 20°C to 100°C at a rate of 60°C/h, with feedback mode/gain set at“low”, filtering period of 8 s, prescan time of 3 min. The experiment was run three times with the parental Fab as reference in order to report the precision of the method, but only one time for each other sample. All data were analyzed
with Origin 7.0 software (OriginLab Corporation,
Northampton, MA). Thermograms were corrected by subtrac-tion of corresponding buffer blank scans and normalized to the protein molar concentration. The Tm were determined
using the automated data processing with the rectangular peak finder algorithm for Tm.
Dynamic light scattering
DLS was used to determine the diffusion coefficient of the Fab and FSA variants. Diluted samples were prepared in duplicate in 384-well plate by serial dilution in DPBS (GE Healthcare Life Sciences) to obtain 5 dilution data points ranging from 0.5 to 16 mg/mL. The plates were heat sealed (2.7 s at 170°C, 88 psi) using a PlateLoc thermal microplate sealer (Agilent Technologies, Santa Clara, CA). A second 384-well plate was similarly prepared and incubated for 14 days at 40°C. DLS experiments were performed using a Zetasizer APS system (Malvern Instruments Ltd) equipped with an MRC 150 thermo-electric recirculating chiller (Laird Technologies Inc., Earth City, MO) to thermostat the plate holder at 10°C. The plates were centrifuged for 2 min at 500 × g in an Allegra X-14R centrifuge equipped with a SX-4750A rotor (Beckman Coulter, Brea, CA) prior to measurements. The measurements were carried out in triplicate at 25°C after 120 s equilibration time, with automatic measurement duration, number of runs and attenuation factor. All data were analyzed with the Zetasizer software v7.11 (Malvern Instruments Ltd, Malvern, UK), using the Protein Analysis algorithm. After data curation based on the software built-in quality criteria for measurement, the diffusion coeffi-cients were plotted as a function of the sample concentration. Median values of diffusion coefficients (Dmedian) from replicate
measurements at each tested concentration were used (Table S1 and Table S2). The self-diffusion coefficient (D0) was determined
from the intercept at zero concentration and the diffusion inter-action parameter (kD) was calculated from the slope divided by
the self-diffusion coefficient. The intercept and slope were obtained through a weighted linear fit attributing a weight pro-portional to the concentration to account for the higher data variability at lower concentrations (Figure S10). A requirement of at least three data points at a given concentration was imposed for a linear fit to be included.
Analytical ultracentrifugation
Sedimentation velocity experiments for Fab and FSA variants were performed on a Beckman XL-I analytical ultracentrifuge monitoring absorbance at 280 nm at a protein concentration of 1 mg/mL (~20 μM for Fabs and ~6.8 μM for FSAs) in PBS. Centerpieces were 0.3 cm charcoal-filled epon. Fabs were cen-trifuged at 48000 rpm and mAbs at 40000 rpm using an 8-hole rotor. The c(s) distributions were obtained using SEDFIT,66and integrated using GUSSI.67Binding parameters were obtained by fitting of the data to a monomer-dimer equilibrium model in SEDPHAT.68For self-associating variants and their counterparts that differed only by a point mutation, data was collected from 2 different protein lots. For all other Fabs, only a single replicate from a single lot of protein were analyzed. FSAs were analyzed before and after concentration to ~15–20 mg/mL.
Isothermal titration calorimetry
ITC was performed using a Malvern Microcal Auto VP-ITC (Westborough, MA) to determine the equilibrium dissociation constants, KD,for select Fab homodimers. All experiments were
carried out using a cell temperature of 25°C, 10 µCal/s reference
power and a stir speed of 1000 rot/min. The Fab variants at concentrations between 100 to 300μM were titrated into match-ing buffer in 32 intervals of 1μL. The resulting isotherms were analyzed using the dissociation model within Origin 7.0 software containing the Microcal macros and the v1.00 dissociation model update.
Surface plasmon resonance
VEGF antigen binding affinities for the Fab variants bear-ing SL30bR mutation (Table 2) were determined with the same protocol as described for the other Fab variants in this set.43 Briefly, surface plasmon resonance assays were carried out on a BioRad ProteOn XPR36 instrument (Bio-Rad Laboratories Ltd., Mississauga, ON) at 25°C using PBS running buffer containing 0.05% Tween 20 (Teknova, Hollister, CA) with the addition of 3.4 mM ethylenediami-netetraacetic acid. The GLC sensorchips (Bio-Rad) were prepared by injecting a 1:10 dilution of the standard BioRad sNHS/EDC solutions (Bio-Rad) for 140 s at
100 μL/min, followed by 2.5 mg/mL solution of VEGF
antigen (recombinant purified full-length isoform 165 of human VEGF-A) in 10 mM NaOAc pH 4.5 injected at a flow rate of 25μL/min until approximately 150 resonance units (RUs) of antigen were immobilized. Each Fab variant was injected at 3-fold serial dilutions (top nominal concen-trations of 30, 60 or 120 nM) and a buffer blank was simultaneously injected over the blank and VEGF surfaces at 50 μL/min for 120 s with a 900 s dissociation phase. Sensorgrams were aligned and double-referenced using the buffer blank injection and the blank interspots, and the
resulting sensorgrams were analyzed using ProteOn
Manager software v3.1. Data were fit to the 1:1 binding model to determine the kon (s−1M−1) and koff (s−1). The
binding affinity (KD) was determined from the ratio of koff
/kon. Each Fab variant was injected in triplicate.
Crystallization, data collection, structure determination and refinement
All four bH1 Fab variants were concentrated to 8–10 mg/
mL in DPBS buffer before crystallization setup.
Crystallization trials were carried out using the microbatch-under-oil method.69 Both bH1 variants WH33-MH98-MH99 and WH33-FH98-MH99 were crystallized in the condition containing 0.1 M tri-sodium citrate pH 5.6, 11% PEG-4000 and 8% isopropanol, whereas bH1 variants WH33-MH 98-MH99-RL30b and WH33-FH98-MH99-RL30b were obtained in the reservoir solution containing 0.04 M imidazole pH 8.0, 18% PEG-6K. Notably, the parental bH1 Fab did not yield any crystals despite numerous screening trials.
For data collection, the crystals were flash-cooled in liquid nitrogen using the corresponding reservoir solutions supple-mented with 15% ethylene glycol as cryo-protectant. Data for the four bH1 Fab variants WH33-MH98-MH99, WH33-FH 98-MH99, WH33-MH98-MH99-RL30b and WH33-FH98-MH 99-RL30b were collected at a wavelength of 0.9795 Å to a resolution of 2.04, 1.95, 1.69 and 1.73 Å, respectively, at the CMCF1 beam-line, Canadian Light Source. Data sets were indexed and
integrated using iMOSFLM,70and scaled using AIMLESS,71in the CCP4 suite.72 Crystals of both WH33-MH98-MH99 and WH33-FH98-MH99 are isomorphous and belong to the space group P21 with unit cell a = 65.7, b = 96.0, c = 110.1 Å, β = 103.7°. Both WH33-MH98-MH99-RL30b and WH33-FH
98-MH99-RL30b also crystallized in the P21 space group and have almost identical unit cells (a = 81.9, b = 65.9, c = 93.1 Å, β = 99.9°). There are two Fabs (two heavy chains and two light chains) in each asymmetric unit for all these crystals. The struc-ture solution for these Fabs was obtained by molecular replace-ment through MolRep,73using the parental bH1 Fab structure (PDB code 3BDY) as the search model. For each structure, multiple cycles of refinement using REFMAC5,74 followed by model rebuilding with Coot,75 were carried out to obtain the final model. All four structures have good stereochemistry as analyzed with PROCHECK.76 The final models have been deposited into PDB with the accession codes 6MXR, 6MXS, 6MY4 and 6MY5. Data collection and refinement statistics are shown inTable 1.
Hydrogen-exchange mass spectrometry
Stock solutions (5 mg/mL) were diluted to 40 µM with 1 × PBS (pH 7.9). Deuteration was initiated by a two-fold dilution with 1 × PBS in 90% D2O (final D2O 45%). Labeling was performed for
0.05, 0.16, 1, 15 and 60 min at 10°C. The reaction was quenched by a 30-fold dilution with 8 M urea/1 M tris(2-carboxyethyl) phosphine hydrochloride (TCEP) in 100 mM Gly-HCl (pH 3.0), and allowed to reduce for 3 min at 10°C. Samples (0.66 µM, 13 pmol) were manually injected into a 19 µL loop (13 pmol). Fabs were digested with a Poroszyme immobilized pepsin cartridge (30 x 2.1 mm) at 0°C for 3.5 min (100 µL/min, 3% acetonitrile (ACN), 0.1% formic acid (FA), pH 2.7).77The resulting peptides were trapped on a C18 PepMap100 µprecolumn (5 µm, 100 Å, 0.3 × 5 mm) and eluted with an 8-min gradient (15–35%) of mobile phase B (97% ACN, 0.1% FA, pH 2.7) at 5 µL/min and separated with a BioBasic-18 analytical column (5 µm, 300 Å, 50 × 0.32 mm). All columns were purchased from Thermo Fisher Scientific (Waltham, MA). The pepsin column was washed following a procedure proposed previously.78Data was collected with a Waters Ultima Q-TOF scanning from 300–1500 m/z coupled to Agilent 1100/1260 LC pumps. Coverage maps were generated with iterative data dependent MS/MS acquisitions with both fully reduced (8 M Urea/1 M TCEP at room temperature overnight) and “HX-compatible” samples.79Fitted deuteration was calculated using MS Studio. Data was collected in triplicate, and only peptides found in all replicates were included in the analysis. A 95% confidence inter-val of ±0.2 and 0.5 Da were calculated for individual and summed time points, respectively. Statistical significance was assigned based previously proposed criteria.80
Transmission electron microscopy
Carbon-coated grids (400 mesh, Ted Pella, Redding, CA) were glow discharged at 25 mA for 40 s. Antibody samples were diluted in DPBS to 10 µg/ml and 3 µl was spotted onto the glow discharged grid and allowed to absorb for 1 min. Excess solution was blotted and the grids were then washed with
MilliQ-H2O with blotting on Whatman paper between wash
steps, stained with 2% (w/v) uranyl acetate, blotted, air dried and imaged on a Hitachi 7500 TEM (Itachi, Ltd., Tokyo, Japan) operating at 80 keV. Particle selection, alignment and sorting for reference-free 2D class averaging was done in RELION 2.1.0 (MRC Laboratory for Molecular Biology, Cambridge, UK).
In silico predictions of aggregation propensities
SAP and DI were calculated as previously described16,17on the entire panel of variants. SAP calculations were performed using a sphere of radius 5 Å. Surfaces were generated using an in-house molecular surface generator. The different functional forms of DI were evaluated, and only the form with best pre-dictive power is reported. DI was calibrated against sedimenta-tion velocity AUC measurements (% dimer) using least-square linear regression in R.81 Median SAP values were based on conformational ensembles generated by MD, whereas DI values were calculated on static structures. The structure of the Fab of the variants was modeled using as template X-ray structures either: 1) the antigen-bound conformation (parental bH1-Fab, PDB code 3BDY), or 2) the dimerizing conformation (bH1-Fab variant WH33-FH98-MH99-RL30b, chains H and L, this study). The residues were mutated with the PyMOL program (Schrödinger, Inc., New York, NY) and the first rotameric state with steric clearance was selected. The backbone atoms were kept in their initial state. Conformational ensembles of the variants were then generated via MD simulations. Initial struc-tures for MD were prepared first with the Sybyl program (Tripos, Inc., St. Louis, MO) to add missing atoms and then using the tleap program from AMBER 16 software.82 The AMBER FF99SB force field,83 was used to perform the MD simulations. Each system was solvated in a truncated octahedron TIP3P water box.84The distance between the wall of the box and the closest atom of the solute was 12.0 Å. Counterions (Na+, Cl−) were added up to a final concentration of 0.1 M to maintain electroneutrality of the systems. Each system was minimized first, applying harmonic restraints with force constants of 1 kcal/(mol Å2) to all solute atoms, followed by heating from 10 to 150 K for 30 ps in the canonical ensemble (NVT) and from 150 to 300 K for 100 ps in the isothermal–isobaric ensemble (NPT). Each system was equilibrated to adjust the solvent den-sity under 1 atm pressure through 1 ns of NPT simulation. A 30-ns NVT production run was obtained with snapshots collected every 10 ps. For all simulations, a 2-fs time step and an 8-Å nonbonded cutoff were used.
The sequence-based prediction method AGGRESCAN56was run through the web server (http://bioinf.uab.es/aggrescan/) and the a4vSS score (window-averaged aggregation propensities values summed over the entire sequence) normalized for 100 residues (Na4vSS) was reported. The structure-based AGGRESCAN3D54 method was run via the Aggrescan3D 2.0 web server (http://biocomp.chem.uw.edu.pl/A3D2/) using a sphere of 10 Å separately for static and dynamic modes.
The CamSol55method was run in the sequence-based (intrin-sic) mode via the web server (http://www-mvsoftware.ch.cam.ac. uk/index.php/camsolintrinsic) and in the structurally corrected mode (http://www-mvsoftware.ch.cam.ac.uk/index.php/camsol