HAL Id: hal-01439952
https://hal.archives-ouvertes.fr/hal-01439952
Submitted on 15 Nov 2018
HAL is a multi-disciplinary open access
archive for the deposit and dissemination of
sci-entific research documents, whether they are
pub-lished or not. The documents may come from
teaching and research institutions in France or
abroad, or from public or private research centers.
L’archive ouverte pluridisciplinaire HAL, est
destinée au dépôt et à la diffusion de documents
scientifiques de niveau recherche, publiés ou non,
émanant des établissements d’enseignement et de
recherche français ou étrangers, des laboratoires
publics ou privés.
Distributed under a Creative Commons Attribution| 4.0 International License
Discovery of massive, mostly star formation quenched
galaxies with extremely large ly alpha equivalent widths
at z similar to 3
Yoshiaki Taniguchi, Masaru Kajisawa, Masakazu A. R. Kobayashi, Tohru
Nagao, Yasuhiro Shioya, Nick Z. Scoville, David B. Sanders, Peter L. Capak,
Anton M. Koekemoer, Sune Toft, et al.
To cite this version:
Yoshiaki Taniguchi, Masaru Kajisawa, Masakazu A. R. Kobayashi, Tohru Nagao, Yasuhiro Shioya,
et al.. Discovery of massive, mostly star formation quenched galaxies with extremely large ly alpha
equivalent widths at z similar to 3. The Astrophysical journal letters, Bristol : IOP Publishing, 2015,
809 (1), �10.1088/2041-8205/809/1/L7�. �hal-01439952�
DISCOVERY OF MASSIVE, MOSTLY STAR FORMATION QUENCHED GALAXIES
WITH EXTREMELY LARGE Lyα EQUIVALENT WIDTHS AT z ∼ 3
*
Yoshiaki Taniguchi1, Masaru Kajisawa1,2, Masakazu A. R. Kobayashi1, Tohru Nagao1, Yasuhiro Shioya1, Nick Z. Scoville3, David B. Sanders4, Peter L. Capak3,5, Anton M. Koekemoer6, Sune Toft7, Henry J. McCracken8,
Olivier Le Fèvre9, Lidia Tasca9, Kartik Sheth10, Alvio Renzini11, Simon Lilly12, Marcella Carollo12, Katarina Kovač12, Olivier Ilbert9, Eva Schinnerer13, Hai Fu14, Laurence Tresse9,
Richard E. Griffiths15, and Francesca Civano16,17
1
Research Center for Space and Cosmic Evolution, Ehime University, Bunkyo-cho, Matsuyama 790-8577, Japan;[email protected]
2
Graduate School of Science and Engineering, Ehime University, Bunkyo-cho, Matsuyama 790-8577, Japan
3
Department of Astronomy, California Institute of Technology, MS 105-24, Pasadena, CA 91125, USA
4
Institute for Astronomy, University of Hawaii, 2680 Woodlawn Drive, Honolulu, HI 96822, USA
5
Spitzer Science Center, California Institute of Technology, Pasadena, CA 91125, USA
6
Space Telescope Science Institute, 3700 San Martin Drive, Baltimore, MD 21218, USA
7
Dark Cosmology Centre, Niels Bohr Institute, University of Copenhagen, Juliane Mariesvej 30, DK-2100 Copenhagen, Denmark
8Institut d’Astrophysique de Paris, UMR7095 CNRS, Université Pierre et Marie Curie, 98 bis Boulevard Arago, F-75014 Paris, France 9
Aix Marseille Université, CNRS, LAM(Laboratoire d’Astrophysique de Marseille), UMR 7326, F-13388 Marseille, France
10National Radio Astronomy Observatory, 520 Edgemont Road, Charlottesville, VA 22903, USA 11
Dipartimento di Astronomia, Universita di Padova, vicolo dell’Osservatorio 2, I-35122 Padua, Italy
12
Department of Physics, ETH Zurich, 8093 Zurich, Switzerland
13
MPI for Astronomy, Königstuhl 17, D-69117 Heidelberg, Germany
14
Department of Physics & Astronomy, University of Iowa, Iowa City, IA 52245, USA
15
Physics & Astronomy, University of Hawaii at Hilo, STB-216, Hilo, HI 96720, USA
16
Yale Center for Astronomy and Astrophysics, 260 Whitney Avenue, New Haven, CT 06520, USA17 Smithsonian Astrophysical Observatory, 60 Garden Street, Cambridge, MA 02138, USA
ABSTRACT
We report a discovery of six massive galaxies with both extremely large Lyα equivalent widths (EWs) and evolved stellar populations at z ∼ 3. These MAssive Extremely STrong Lyα emitting Objects (MAESTLOs) have been discovered in our large-volume systematic survey for strong Lyα emitters (LAEs) with 12 optical intermediate-band data taken with Subaru/Suprime-Cam in the COSMOS field. Based on the spectral energy distribution fitting analysis for these LAEs, it is found that these MAESTLOs have (1) large rest-frame EWs of EW0 (Lyα) ∼
100–300 Å, (2) Må ∼ 1010.5–1011.1 Me, and (3) relatively low specific star formation rates of SFR/Må ∼ 0.03–1 Gyr−1. Three of the six MAESTLOs have extended Lyα emission with a radius of several kiloparsecs, although they show very compact morphology in the HST/ACS images, which correspond to the rest-frame UV continuum. Since the MAESTLOs do not show any evidence for active galactic nuclei, the observed extended Lyα emission is likely to be caused by a star formation process including the superwind activity. We suggest that this new class of LAEs, MAESTLOs, provides a missing link from star-forming to passively evolving galaxies at the peak era of the cosmic star formation history.
Key words: cosmology: observations – early universe – galaxies: evolution – galaxies: formation – galaxies: high-redshift
1. INTRODUCTION
Most of the massive galaxies in the present universe are passively evolving galaxies with little ongoing star formation (e.g., Kauffmann et al. 2003). In the current understanding of
galaxy evolution, massive galaxies are considered to have evolved more rapidly than less massive systems in the earlier universe: the so-called downsizing evolution of galaxies (Cowie et al.1996). These massive galaxies have formed their
stars actively by a cosmic age of a few Gyr(redshift z ∼ 2–3), when the cosmic star formation rate(SFR) density peaked (e.g., Bouwens et al. 2011). After this epoch, their star formation
stopped and they passively evolved into the elliptical galaxies seen today. However, the quenching mechanism of star formation in these massive galaxies has not yet been under-stood because the process may have occurred in a relatively short timescale, making it difficult to observe such events (e.g., Renzini2009; Peng et al.2010; Durkalec et al.2015; Mancini et al.2015).
To seek star-forming galaxies in the young universe, hydrogen Lyα emission provides the most useful tool. Therefore, many searches for redshifted Lyα emission have resulted in the discovery of young galaxies beyond z ∼ 7, corresponding to a cosmic age of750 Myr (Ono et al.2012; Shibuya et al.2012; Finkelstein et al.2013; Konno et al.2014; Schenker et al.2014). Among such Lyα emitting galaxies (Lyα
emitters, hereafter LAEs), those with a very large equivalent width (EW), i.e., extremely strong LAEs, are particularly important in that they can be galaxies in a very early stage of galaxy formation(e.g., Schaerer 2003; Nagao et al.2007).
*Based on observations with NASA/ESA Hubble Space Telescope, obtained at the Space Telescope Science Institute, which is operated by AURA, Inc., under NASA contract NAS 5-26555; also based on data collected at the Subaru Telescope, which is operated by the National Astronomical Observa-tory of Japan; and also based on data products from observations made with ESO Telescopes at the La Silla Paranal Observatory under ESO programme ID 179.A-2005 and on data products produced by TERAPIX and the Cambridge Astronomy Survey Unit on behalf of the UltraVISTA consortium.
area in the COSMOSfield, that is, the overlapped area between the COSMOS deep region and UltraVISTA DR1(McCracken et al. 2012). The wide survey area and wide wavelength
coverage of the 12 IA bands allow us to search for strong LAEs at 2.5< z < 5.8 over a very large volume of 5.5 × 10⁷Mpc3. As a result, we obtain a sample of 589 LAEs at
z
2.5< <5.3. In this sample, 18 LAEs have both an extremely large rest-frame equivalent width of EW Ly0( a) 100Å and a large stellar mass with
M 1010.5M
. Hereafter, we call these 18 LAEs MAssive,
Extremely STrong Lyα emitting Objects (MAESTLOs). Since our main interest is the star-forming activity in galaxies, we rejected possible AGNs by using the IRAC color criteria proposed by Donley et al. (2012). We also used the
XMM-COSMOS (Hasinger et al. 2007), Chandra-COSMOS (Elvis
et al. 2009; Civano et al. 2012), Chandra-COSMOS Legacy
(F. Civano et al. 2015, in preparation), and VLA-COSMOS (Schinnerer et al.2007) catalogs to reject the AGNs. In total, 12
MAESTLOs turn out to show evidence of AGNs. Accordingly, we obtain a sample of six MAESTLOs without evidence of AGNs.18 Their observational properties are summarized in Table1.
Their sizes are measured in the excess IA-band (i.e., Lyα image) and the COSMOS HST/ACS IF814W-band mosaics
(Koekemoer et al.2007), corresponding to the rest-frame UV
continuum, by using the GALFIT code(Peng et al.2002). We
fit the observed surface brightness with an exponential law, taking into account the point-spread function (PSF) of these data. Here, wefix the Sérsic index to n = 1 because our data are not deep enough to resolve the degeneracy between the radius and Sérsic index for our MAESTLOs. The PSF images of the excess IA-band and ACS data are measured by combining relatively bright isolated stars in each image. Note, however, that we cannot measure the ACS sizes for MAESTLO No. 2 since this object is out of the HST/ACS field. Furthermore, we also measure the sizes of the rest-frame UV continuum using the i¢-band data taken with the same instrument as that of the excess IA-band data. Note that the half-light radius of the PSF in the excess IA bands is 0.75–0.83 arcsec, while that in the i¢ band is 0.51 arcsec. In order to estimate the uncertainty in the size measurements including the systematic effects such as the background fluctuation, we carry out the Monte Carlo simulation as in previous studies(e.g., Straatman et al.2015). After adding the
best-fit model profile to the image at 200 random positions around the original position (in a 2¢ ´ ¢ region), we re-2 measure their sizes. The standard deviation of these 200 measurements is adopted as the size uncertainty. In order to check whether the object is significantly extended or not, we also calculated the fraction of the cases that GALFIT returned the “unresolved” flag, funres, in the 200 measurements. The
estimated half-light radii and errors of the MAESTLOs together with funresare given in Table2.
We have also carried out additional simulations. In these simulations,(1) we convolved model galaxies with the best-fit F814W-band light profile with the PSF of the IA-band data; (2) then, we added them into the IA-band image; and (3) we measured their sizes with GALFIT. We performed 200 such
18
Note that a stacking analysis for the six MAESTLOs, corresponding to a ∼650 ks exposure, results in no detection. The 95% upper limit in the 0.5–2 keV band is 3.63´10-5counts s-1, which corresponds to a rest-frame
luminosity of 7.76´1042erg s-1at z∼ 3.
In order to search for them, we have carried out a survey for extremely strong LAEs over an unprecedented large volume. While most of the detected objects with strong Lyα seem to be young galaxies with small stellar mass as expected for LAEs, we have serendipitously found six massive galaxies with extremely large EW(Lyα) and a relatively evolved stellar population at z ∼ 3 that show no evidence for an active galactic nucleus (AGN). Here, we present the physical properties of this new population, which is expected to be in a transition phase between star forming and passive evolution. In this Letter, we use a standard cosmology with ΩM = 0.3, ΩΛ = 0.7, and H0 = 70 km s−1 Mpc−1.
2. DATA AND ANALYSIS
In this study, we use the multi-wavelength data set from the Cosmic Evolution Survey (COSMOS; Scoville et al. 2007).
Optical imaging data with 12 intermediate-band (hereafter IA-band) filters equipped on Subaru/Suprime-Cam allow us to pick up strong emission-line objects by a significant flux excess in one of the IA bands. The spectral resolution of our IA filters is R = λ/Δλ = 20–26, and the 12 IA filters cover the whole optical wavelength range from 4270 to 8270 Å (Taniguchi et al. 2015). Therefore, we can search for strong LAEs at
2.5 < z < 5.8. Although the details of our selection procedure for strong LAEs are given elsewhere (M. A. R. Kobayashi et al. 2015, in preparation), we briefly summarize it as follows.
At first, from the COSMOS Official Photometric Catalog (version 2012; Capak et al. 2007), we selected objects with a
significant (3σ) flux excess in an IA band from the frequency-matched continuum estimated by using two adjacent broadband magnitudes. In order to identify which emission line causes the IA-band excess of these objects, we applied the public photometric redshift code EAZY (Brammer et al. 2008) to
the multi-band photometric data from optical to MIR, which include CFHT u* and i*, Subaru Bg′Vr′i′z and 12 IA bands (Taniguchi et al. 2007), UltraVISTA YJHK (McCracken
et al. 2012), and Spitzer/IRAC 3.6 and 4.5 μm bands (Sanders
et al. 2007). The excess IA band and any broad bands whose
wavelength coverage is overlapped with the excess IA band are excluded from the photometric redshift calculation. We adopted a line identification with the highest probability in the volume-weighted redshift likelihood function and assigned the photometric redshift assuming the emission line enters into the effective wavelength of the excess IA band. We selected LAEs from these strong emission-line objects and then performed the spectral energy distribution (SED) fitting with the GALAXEV population synthesis model (Bruzual & Charlot2003) to estimate the physical properties of the LAEs.
In the SED fitting, we assumed the exponentially decaying star formation histories with an e-folding timescale of τ = 0.01–10 Gyr. The Chabrier initial mass function (Chabrier 2003) and the Calzetti extinction law (Calzetti
et al. 2000) were adopted. The excess IA band and any broad
bands overlapping with the excess band were again excluded. Although other strong emission lines such as [O II], [O III], and
Hα may enter into the JHK bands, we used all JHK-band data in the fitting because the effect of such emission lines is not expected to be serious for these bands with wide filter bandpasses. In addition to the multi-band photometry used in the photometric redshift estimate, we also used the IRAC 5.8 and 8.0 μm bands to obtain more accurate physical properties such as the stellar mass and age. Our survey covers a 1.34 deg2
simulations for the 2 MAESTLOs with the extended Lyα emission(Nos. 1 and 3) for which an ACS image is available; note that No. 2 is located out of the ACS coverage. We then find that GALFIT returned the “unresolved” flag in most cases (185/200 and 169/200 for Nos. 1 and 3, respectively). Therefore, we have confirmed that their Lyα emission is really extended in their IA images. In conclusion, the three MAESTLOs have an extended Lyα emission with a size of several kiloparsecs.
3. RESULTS AND DISCUSSIONS
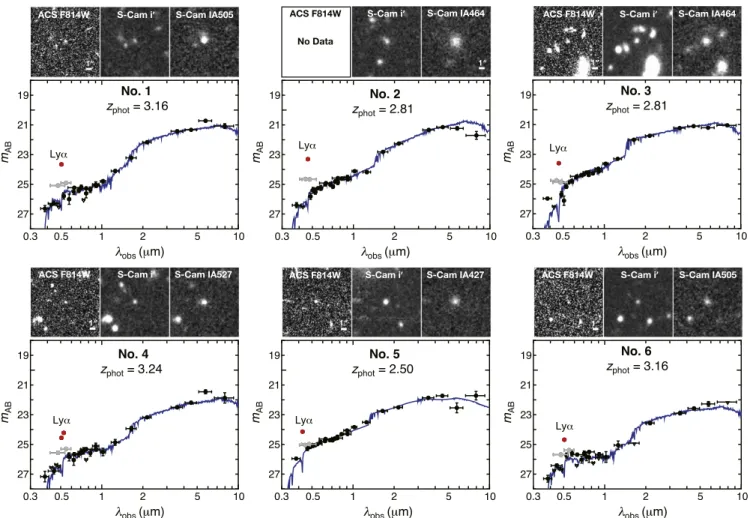
In Figure1, we show the rest-frame UV–NIR SED of the six MAESTLOs together with their thumbnails in the excess IA, i¢, and ACS IF814W bands. It is found that they are significantly
bright in the rest-frame NIR wavelengths, leading to their large estimated stellar masses oflog(M M)= 10.5–11.1. Another unexpected property is that they show very red rest-frame UV– optical colors despite their extremely large EW Ly0( a ; i.e., the)
MAESTLOs show a relatively strong 4000Å continuum break in the frame optical as well as the Lyman break in the rest-frame far-UV. These continuum features allow us to identify the flux excess in a concerned IA band as the Lyα emission line, resulting in an accurate photometric redshift for them. In fact, two of the six MAESTLOs have spectroscopic identifications and their spectroscopic redshifts agree with the photometric redshifts
estimated from the IA-band excess(Nos. 3 and 5; see Table1).
The strong 4000Å break observed in the MAESTLOs suggests relatively old stellar population in them, and their best-fit stellar ages based on SED fitting are 1–2 Gyr.19 Thus, these galaxies form a completely different population from typical high-redshift LAEs with small stellar masses and young stellar ages(e.g., Ono et al.2010; Hagen et al.2014).
Despite their relatively old stellar population, the MAES-TLOs have extremely large EW Ly0( a of ∼100–300 Å. In)
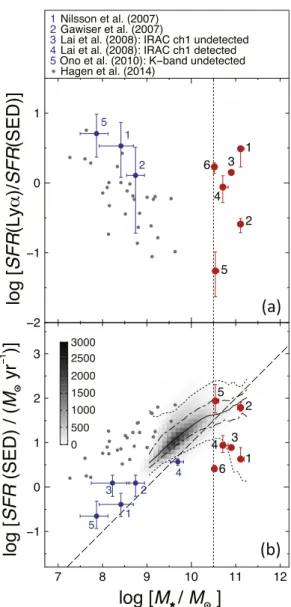
order to compare the SFRs estimated from Lyα luminosity, SFR Ly( a , with that from SED fitting, SFR SED) ( ), we show SFR Ly( a) SFR SED( )ratios of the MAESTLOs as a function of stellar mass in Figure 2(a). Here, we use the Kennicutt
(1998) relation between SFR and L H( a combined with both) the L(Lya) L(Ha ratio of 8.7 under the case B recombina-) tion and a correction factor converting from the Salpeter IMF into the Chabrier IMF(i.e., multiplied by a factor of 0.60).
For typical LAEs, it is found that the SFR ratio decreases with increasing stellar mass (Hagen et al.2014). On the other
hand, for most MAESTLOs, SFR Ly( a is comparable to) SFR SED( ), and thus their SFR ratios are similar to those of typical LAEs with much smaller masses. Therefore, it is suggested that the escape fraction of the Lyα emission is relatively high in these galaxies and/or that there are other additional energy sources besides the photoionization by massive OB stars.
In order to investigate their evolutionary stage, we show the distribution of MAESTLOs in the SFR SED( )–M plane
together with typical LAEs at z~3 (Gawiser et al. 2007; Nilsson et al. 2007; Lai et al. 2008; Ono et al. 2010; Hagen et al. 2014) and galaxies at zphot=2.5–3.2 in the COSMOS field (Figure2(b)). Compared to normal star-forming galaxies
on the main sequence at similar stellar masses and redshifts, the MAESTLOs have a smaller specific SFR20,
M
sSFR=SFR ~0.03–1 Gyr-1, suggesting that their star formation activities are just ceasing and that they are in a
Table 1
Physical Properties of the Six MAESTLOs
No. zphot logM τ Age E B( -V) EW Ly0( a) log SFR[ (Myr-1)]
M
( ) (Gyr) (Gyr) (mag) (Å) Lyα SED
1 3.16 11.11-+0.000.08 0.32-+0.080.00 1.61-+0.180.29 0.03-+0.000.06 240-+1920 1.12-+0.020.02 0.63-+0.000.26 2 2.81 11.110.070.04 -+ 1.59 0.591.58 -+ 1.80 0.52 0.40 -+ 0.29 0.02 0.03 -+ 306± 20 1.20-+0.020.02 1.79-+0.080.12 3 2.81a 10.90-+0.000.00 0.05-+0.000.00 0.29-+0.000.00 0.19-+0.000.00 172± 6 1.04-+0.020.02 0.88-+0.000.00 4 3.24 10.71-+0.030.12 0.40-+0.000.40 1.28-+0.140.62 0.12-+0.040.05 178± 16 0.88-+0.030.03 0.94-+0.160.22 5 2.50b 10.54 0.04 0.08 -+ 0.06-+0.029.94 0.14-+0.030.26 0.40-+0.030.04 107-+1411 0.68-+0.030.03 1.94-+0.270.37 6 3.16 10.52-+0.030.03 0.50-+0.000.00 1.90-+0.100.00 0.02-+0.010.02 124± 16 0.64-+0.050.05 0.41-+0.030.08
Notes. The No. is given in order of decreasing estimated stellar mass. Errors for the quantities correspond to a 1σ confidence interval (i.e.,Dc21) estimated from the SEDfitting. In the SED fitting, the templates older than the cosmic age at zphotare not used. The entry of 0.00 for these errors indicate that there is no parameter grid inDc21around the best-fit model parameter.
a
zspec=2.798.
b
zspec=2.513.
Table 2
Size Measurements of the Six MAESTLOs
ACS F814W S-Cam i¢ S-Cam IA
No. rHL(kpc) funres rHL(kpc) funres rHL(kpc) funres 1 0.52± 0.08 0.060 <3.87b 0.660 4.50± 0.61 0 2 La La 4.49± 2.01 0.175 6.68± 0.70 0 3 1.00± 0.09 0 4.21± 1.75 0.115 7.18± 0.80 0 4 0.34± 0.12 0.100 <3.83b 0.750 <6.20b 0.685 5 <0.57b 0.880 <4.12b 0.710 3.77± 1.83 0.050 6 <0.54b 0.645 <3.87b 0.670 <5.74b 0.410
Notes. rHLis the half-light radius and the error for rHLis based on the Monte Carlo simulation described in the text. funresis the fraction of the cases that GALFIT returned the unresolvedflag in the simulation.
aOut of the ACS/F814W-band data. bUnresolved.
19
Note that two MAESTLOs(i.e., Nos. 3 and 5) have relatively young ages. No. 3 has a very short e-folding timescale and a clear Balmer break in the SED, suggesting that its SFR is rapidly decreasing. On the other hand, No. 5 shows a relatively weak Balmer/4000 Å break compared to the other MAESTLOs, and its e-folding timescale is highly uncertain.
20
One exception is MAESTLO No. 5, which has a weak Balmer break as mentioned above. Its sSFR is consistent with the main sequence at the redshift.
transition phase from actively star-forming into quiescent galaxies. This contrasts with normal LAEs that tend to have an sSFR similar to or higher than main-sequence galaxies (e.g., Hagen et al.2014).
In order to complementarily investigate the star formation histories of the MAESTLOs, we show the rest-frame U-V
versus V-J diagram in Figure 3. Comparing the quiescent galaxies studied by Muzzin et al.(2013), we find that our four
MAESTLOs with a low sSFR(Nos. 1, 3, 4, and 6) are located around the selection boundary for the quiescent galaxies and that their colors are consistent with the model tracks where star formation has been recently quenched. Therefore, this color analysis reinforces our scenario, suggesting that they have been recently quenched and are moving into the passive evolution phase. Although the colors of the other two MAESTLOs are consistent with the star-forming models, their colors can also be interpreted as a galaxy that ceased its star formation recently. The larger dust contents in these two galaxies may be expected if they are in an early phase of the superwind activity, i.e., most of the dust grains may have not yet been blown out by the superwind. We thus infer that MAESTLOs are in thefinal stage of massive galaxy formation where their SFRs decrease as gas is ejected from the galaxy as the superwind.
As shown in Table 2, the sizes in the rest-frame UV continuum of MAESTLOs are small (i.e., kpc). It is1 noteworthy that their sizes are very similar to those of compact massive quiescent galaxies found at z~2 (van der Wel et al.2014), implying that the MAESTLOs can be interpreted
as their progenitors. It has been recently suggested that massive compact star-forming galaxies at z~ –3 evolve into compact2 quiescent galaxies after their star formation ceases(e.g., Barro et al. 2013). Although they are mostly dusty galaxies whose
sizes are as small as the MAESTLOs, they have a younger age of 1.1 0.6
0.2
-+ Gyr and a higher sSFR of 0.3–3 Gyr-1 than
MAESTLOs (Barro et al. 2014). We therefore suggest that
they will evolve to passive galaxies through the MAESTLO phase.
Our survey volume (z = 2.42–2.59 and 2.72–3.42) corresponds to 1.4´10 Mpc7 3 and the number density of
MAESTLOs is 4.3´10-7Mpc-3 (2.9´10-7Mpc-3 if we
exclude MAESTLOs Nos. 2 and 5 with a relatively high sSFR). Thus, MAESTLOs may have been missed by previous narrowband surveys because their survey volumes were insufficient even in a survey with powerful instruments such as Subaru/Suprime-Cam (e.g., Ouchi et al.2008).
Here, we compare the number density of MAESTLOs with star-forming and quiescent galaxies with M 1010.5M
> using
Figure 1. SEDs and HST and Subaru images of the six MAESTLOs. In the bottom main panel, the observed data points are shown by filled circles with error bars. The red symbol shows the IA band with a significant flux excess by the Lyα emission, while the gray symbols represent the broad bands whose wavelength coverage overlaps with the excess IA band. The blue curve shows the best-fit model SED from the GALAXEV library. The data affected by the strong Lyα emission (red and gray points) are not used in the SED fitting. The inverted triangles represents the 3s upper limit for the undetected bands. In the top panels, the thumbnails of the HST/ ACS in the F814Wfilter, the Subaru Suprime-Cam i¢-band image, and the excess IA-band image are shown. Each panel is 12 ´12 in size. The ACS images are convolved with a Gaussian kernel withs = pixel ( 0. 031 = ) to reduce the noise.
the stellar mass function of galaxies at the same redshift range (Ilbert et al. 2013). We then find that the MAESTLOs
constitute only 0.2%–0.6% of star-forming galaxies and ∼2% of quiescent galaxies. If we assume that all galaxies with
M 1010.5M
> pass the phase of MAESTLO when they
evolve from star-forming to quiescent galaxies, we obtain the duration of this phase,~0.02´tuniv(z~3 4– )~30–50 Myr (∼20–34 Myr if we exclude Nos. 2 and 5), making them a rare population. Such a short timescale truncation has been recently discussed based on other observational properties of galaxies at
z~3(Durkalec et al.2015; Mancini et al.2015).
Finally, we note the extended nature of Lyα emission. As demonstrated in Section 2, three of the six MAESTLOs (Nos. 1–3) have extended Lyα emission in the excess IA band, while all the MAESTLOs are compact in the both ACS IF814W
-band and Subaru i¢-band data (see Table 2). The half-light
radius of these three MAESTLOs in the IA-band data is∼4–7 kpc, while that in the ACS data is kpc for all the1 MAESTLOs(Table2). This extended nature of Lyα emission
is intimately related to the observed extremely large EW Ly0( a .)
Plausible origins of the extended Lyα emission is attributed to (1) the scattering of Lyα photons supplied from the central region of each MAESTLO, (2) photoionized gas by the massive star in the central region of each MAESTLO, or(3) the shock-heated gas driven by a superwind. In addition, there are other possible ideas to explain the observed extended Lyα emission. Thefirst idea is a projection effect by a nearby LAE with a MAESTLO. However, we consider that such a projection effect cannot be the origin of most MAESTLOs because of the small number densities of both massive galaxies with relatively low sSFR and LAEs with extremely large EWs at z~3 (e.g., ~1.3´10-5Mpc-3 for galaxies with
M 1010.5M
and sSFR = 0.03–0.3 Gyr-1, and
5.4 10 6Mpc 3
~ ´ - - for LAEs with EW Ly 100 0( a) Å).
Namely, the projection probability of these objects with similar redshifts (e.g., D <z 0.5) is expected to be extremely low (∼0.003 such chance alignments within 1″ in our survey volume). Another idea is that a star-forming dwarf galaxy is going to merge onto these MAESTLOs. In this case, we have to explain why a merging dwarf galaxy experiences such active star formation. Although we cannot determine which mechan-ism is dominant solely using the present data, future detailed observations of MAESTLOs such as integralfield spectroscopy will be useful for this issue.
Figure 2. (a) SFR Ly( a) SFR SED( )vs. Mand(b) SFR SED( ) vs. Mfor our
MAESTLOs(red circles) and LAEs at z~ from the literature3 (blue and gray circles for the results from stacked LAEs and from individual LAEs, respectively). For Hagen et al. (2014), we plot only the LAEs at z = 2.5–3.2
in their sample. Note that the SFRs and Min the literature derived with the
Salpeter IMF are converted into those with the Chabrier IMF we use. Note also that Hagen et al.(2014) used the SFRs estimated from the dust-corrected UV
luminosity instead of those based on the SEDfitting. In panel (b), we also plot the so-called main-sequence of star-forming galaxies at zphot=2.5–3.2 in the COSMOSfield in grayscale with a bin size of 0.1 dex in M and SFR. The
scale(the number of galaxies per bin) is shown in the upper left inset. Solid, dot–dashed, and dotted lines show the median, 16 and 84 percentiles, and 2.5 and 97.5 percentiles in bins of 0.1 dex in stellar mass. The dashed line shows the relation of sSFR=1 Gyr-1. The vertical dotted line corresponds to
M M
log( )=10.5, which is one of the criteria of MAESTLO.
Figure 3. Rest-frame U-Vvs. V- two-color diagram for the MAESTLOs.J
The six MAESTLOs are shown byfilled circles with their ID numbers. The domain of quiescent galaxies studied by Muzzin et al.(2013) is shown with the
gray shaded area. Two star formation models(the constant star formation and the single 1 Gyr starburst) are also shown by blue and orange dotted curves for AV= 0 and by blue and orange dashed curves for AV= 0.5 mag.
How the star formation was quenched in high-redshift massive galaxies is now the most important issue for under-standing galaxy formation and evolution. Therefore, large-volume surveys for such massive galaxies with extremely large EW Lya0( ) will become more important in future.
We would like to thank both the Subaru and HST staff for their invaluable help, as well as all members of the COSMOS team. We would also like to thank the anonymous referee for valuable suggestions and comments. We also thank Alex Hagen for kindly providing us with the information of their LAEs. This work was financially supported in part by JSPS (Y. T.: 15340059, 17253001, 19340046, and 23244031; T.N.: 23654068 and 25707010). Data analysis was in part carried out on the common use data analysis computer system at the Astronomy Data Center, ADC, of the National Astronomical Observatory of Japan.
REFERENCES
Barro, G., Faber, S. M., Pérez-González, P. G., et al. 2013, ApJ, 765, 104
Barro, G., Faber, S. M., Pérez-González, P. G., et al. 2014, ApJ,791, 52
Bouwens, R. J., Illingworth, G. D., Labbe, I., et al. 2011, Natur, 469, 504
Brammer, G. B., van Dokkum, P. G., & Coppi, P. 2008, ApJ,686, 1503
Bruzual, G., & Charlot, S. 2003, MNRAS, 344, 1000
Calzetti, D., Armus, L., Bohlin, R. C., et al. 2000, ApJ,533, 682
Capak, P., Aussel, H., Ajiki, M., et al. 2007, ApJS, 172, 99
Chabrier, G. 2003, PASP, 115, 763
Civano, F., Elvis, M., Brusa, M., et al. 2012, ApJS, 201, 30
Cowie, L. L., Songaila, A., Hu, E. M., & Cohen, J. G. 1996, AJ, 112, 839
Donley, J. L., Koekemoer, A. M., Brusa, M., et al. 2012, ApJ,748, 142
Durkalec, A., Le Fèvre, O., de la Torre, S., et al. 2015, A&A, 576, L7
Elvis, M., Civano, F., Vignali, C., et al. 2009, ApJS, 184, 158
Finkelstein, S. L., Papovich, C., Dickinson, M., et al. 2013, Natur,502, 524
Gawiser, E., Francke, H., Lai, K., et al. 2007, ApJ, 671, 278
Hagen, A., Ciardullo, R., Gronwall, C., et al. 2014, ApJ,786, 59
Hasinger, G., Cappelluti, N., Brunner, H., et al. 2007, ApJS, 172, 29
Ilbert, O., McCracken, H. J., Le Fèvre, O., et al. 2013, A&A,556, A55
Kauffmann, G., Heckman, T. M., White, S. D. M., et al. 2003, MNRAS,
341, 33
Kennicutt, R. C., Jr 1998, ARA&A, 36, 189
Koekemoer, A. M., Aussel, H., Calzetti, D., et al. 2007, ApJS, 172, 196
Konno, A., Ouchi, M., Ono, Y., et al. 2014, ApJ,797, 16
Lai, K., Huang, J.-S., Fazio, G., et al. 2008, ApJ, 674, 70
Mancini, C., Renzini, A., Daddi, E., et al. 2015, MNRAS,450, 763
McCracken, H. J., Milvang-Jensen, B., Dunlop, J., et al. 2012, A&A, 544, A156
Muzzin, A., Marchesini, D., Stefanon, M., et al. 2013, ApJ,777, 18
Nagao, T., Murayama, T., Maiolino, R., et al. 2007, A&A, 468, 877
Nilsson, K. K., Møller, P., Möller, O., et al. 2007, A&A,471, 71
Ono, Y., Ouchi, M., Mobasher, B., et al. 2012, ApJ, 744, 83
Ono, Y., Ouchi, M., Shimasaku, K., et al. 2010, MNRAS, 402, 1580
Ouchi, M., Shimasaku, K., Akiyama, M., et al. 2008, ApJS, 176, 301
Peng, C. Y., Ho, L. C., Impey, C. D., & Rix, H.-W. 2002, AJ, 124, 266
Peng, Y.-j., Lilly, S. J., Kovač, K., et al. 2010, ApJ,721, 193
Renzini, A. 2009, MNRAS, 398, L58
Sanders, D. B., Salvato, M., Aussel, H., et al. 2007, ApJS,172, 86
Schaerer, D. 2003, A&A, 397, 527
Schenker, M. A., Ellis, R. S., Konidaris, N. P., & Stark, D. P. 2014, ApJ,
795, 20
Schinnerer, E., Smolčić, V., Carilli, C. L., et al. 2007, ApJS, 172, 46
Scoville, N., Aussel, H., Brusa, M., et al. 2007, ApJS, 172, 1
Shibuya, T., Kashikawa, N., Ota, K., et al. 2012, ApJ, 752, 114
Straatman, C. M. S., Labbe, I., Spitler, L. R., et al. 2015, ApJL, in press (arXiv:1506.01380)
Taniguchi, Y., Kajisawa, M., Kobayashi, M. A. R., et al. 2015, PASJ, submitted
Taniguchi, Y., Scoville, N., Murayama, T., et al. 2007, ApJS,172, 9