Ductile Fracture after Complex Loading Histories:
Experimental Investigation and Constitutive Modeling
by
Stephane Marcadet
Diplome de l'Ecole Polytechnique (2012) M.S., Massachusetts Institute of Technology (2012) Submitted to the Department of Mechanical Engineering in Partial Fulfillment of the Requirements for the Degree of
Doctor of Science in Mechanical Engineering at the
MASSACHUSETTS INSTITUTE OF TECHNOLOGY June 2015
0 2015 Massachusetts Institute of Technology. All rights reserved.
Author: Certified by: -Certified by: -Accepted by:_
ARCHVES
MASSAC-u TT ONSTITJTE OF rC.HN0LLGYJUL 3
0
2015
,
LIBRARIES
//,Signature redacted
D)Signature redacted
Signature redacted
Signature redact
epartment of Mechanical Engineering
May 22, 2015
Tomasz Wierzbicki Professor of Applied Mechanics Thesis Supervisor
Dirk Mohr CNRS Associate Professor Thesis Supervisor
David E. Hardt Chairman, Committee on Graduate Students Department of Mechanical Engineering
-3-Ductile Fracture after Complex Loading Histories: Experimental Investigation and Constitutive Modeling
by Stephane Marcadet
Submitted to the Department of Mechanical Engineering
On May 22, 2015, in partial fulfillment of the requirements for the degree of Doctor of Science in Mechanical Engineering
In engineering practice, sheet metal often fails after complex strain paths that deviate substantially from the widely studied proportional loading paths. Different from previous works on the ductile fracture of sheet metal, this thesis research addresses the experimental and modeling issues related to the crack initiation in advanced high strength steels after loading direction reversal. The main outcome of the present work is a fracture initiation model for proportional and non-proportional loading.
The starting point of this thesis is a first chapter on the development of a micromechanically-motivated ductile fracture initiation model for metals for proportional loading. Its formulation is based on the assumption that the onset of fracture is imminent with the formation of a primary or secondary band of localization. Motivated by the results from a thorough unit cell analysis, it is assumed that fracture initiates after proportional loading if the linear combination of the Hosford equivalent stress and the normal stress acting on the plane of maximum shear reaches a critical value. A comprehensive fracture initiation model is then obtained after transforming the localization criterion from the stress space to the space of equivalent plastic strain, stress triaxiality and Lode angle parameter using the material's isotropic hardening law. Experimental results are presented for three different advanced high strength steels. For each material, the onset of fracture is characterized for five distinct stress states, including butterfly shear, notched tension, tension with a central hole, and punch experiments. The comparison of model predictions with the experimental results demonstrates that the proposed Hosford-Coulomb model can predict with satisfactory accuracy the instant of ductile fracture initiation in advanced high
-4-In a subsequent chapter, experimental methods are developed to perform compression-tension experiments. In addition, a finite strain constitutive model is proposed combining a Swift-Voce isotropic hardening law with two Frederick-Armstrong kinematic hardening rules and a Yoshida-Uemori type of hardening stagnation approach. The plasticity model parameters are identified from uniaxial tension-compression stress-strain curve measurements and finite element simulations of compression-tension experiments on notched specimens. The model predictions are validated through comparison with experimentally-measured load-displacement curves up to the onset of fracture, local surface strain measurements and longitudinal thickness profiles. The extracted loading paths to fracture show a significant increase in ductility as a function of the compressive pre-strain. The Hosford-Coulomb model is therefore integrated into a non-linear damage indicator modeling framework to provide a phenomenological description of the experimental results for monotonic and reverse loading.
Another extension of the modeling framework is presented in a third chapter inspired by the results from loss of ellipticity analysis. It is demonstrated that the Hosford-Coulomb model can also be expressed in terms of a stress-state dependent critical hardening rate. Moreover, it is shown that the critical hardening rate approach provides accurate predictions of the instant of fracture initiation for both proportional and non-proportional loading conditions. Enhancements of the finite strain constitutive model are also proposed to enable a fast identification of all model parameters. The plasticity model parameters are identified from stress-strain curve measurements from shear loading reversal on specimens with a uniform thickness reduced gage section. The model is used to estimate the local strain and stress fields in fracture experiments after shear reversal. The extracted loading paths to fracture show a significant increase in ductility as a function of the strain at shear
reversal, a feature that is readily predicted by the prosed critical hardening rate model.
Thesis supervisor: Tomasz Wierzbicki Title: Professor of Applied Mechanics Thesis supervisor: Dirk Mohr
-5-Acknowledgements
I would like to thank Professor Tomasz Wierzbicki and Professor Dirk Mohr who provided crucial guidance and support throughout my studies at MIT in the Impact and Crashworthiness Laboratory. I greatly appreciate the opportunities they afforded me in order to carry out my thesis work independently.
Further, I am grateful to Professors David Parks and Kenneth Kamrin for agreeing to serve on my thesis committee, and to discuss my research.
It has been a pleasure for me to work with both the former and current members of the ICL, all of whom have fostered a friendly and productive work environment: Dr. Allison Beese, Dr. Meng Luo, Dr. Matthieu Dunand, Dr. Christian Roth, Dr. Kai Wang, Dr. Fabien Ebnoether, Dr. Jessica Papasidero, Dr. Kirki Kofiani, Dr. Gongyao Gu, Dr. Camille Besse, Mr. Keunhwan Pack, Mr. Xiaowei Zhang, Mr. Colin Bonatti and Mr. Rami Abi Akl. Special thanks as well to Barbara Smith for her invaluable assistance.
Additionally, I sincerely thank the members of Industrial Fracture Consortium for the financial support and their regular feedback on my work.
-6-
-7-Contents
Chapter 1: Introduction ... 21
1.1 Ductile Fracture... 21
1.2 Plasticity for Complex Loading ... 23
1.3 Strain path dependency of FLD and fracture toughness ... 27
1.4 Examples of non-linear loading paths... 28
1.4.1 Crash ... 28
1.4.2 Com bined Form ing and Crash ... 29
1.5 Complex Loading on Bulk M aterial... 30
1.6 Particularities of Sheet M etal... 31
1.7 Thesis Outline ... 34
Chapter 2: Hosford-Coulomb Model for Predicting Ductile Fracture... 37
2.1 Introduction ... 38
2.2 Prelim inaries... 44
2.2.1 Description of the stress state ... 44
2.2.2 Plasticity M odel ... 45
2.3 Fracture Initiation M odel for Proportional Loading ... 46
2.3.1 M otivation... 46
2.3.2 Localization Criterion in Stress Space... 47
2.3.3 Fracture initiation model in m ixed strain-stress space... 50
2.3.4 Illustration of the HC model ... 52
-8-2.3.6 Com m ent on M odel Consistency... 57
2.4 Fracture Experim ents ... 59
2.4.1 M aterials ... 59
2.4.2 Uniaxial tension experim ents... 59
2.4.3 Shear experim ents... 64
2.4.4 Punch experim ent... 64
2.5 Identification of the loading paths to fracture ... 64
2.5.1 Plasticity m odel param eter identification ... 64
2.5.2 Loading paths to fracture ... 66
2.6 M odel calibration and verification ... 68
2.6.1 M odel application ... 69
2.7 Sum m ary ... 70
Chapter 3: Compression-Tension to Fracture of Dual Phase Steel Sheets ... 73
3.1 Introduction ... 74
3.2 Experim ents... 77
3.2.1 M aterial and specim ens... 77
3.2.2 Experim ental procedure ... 80
3.2.3 Experim ental results... 82
3.3 Combined Chaboche-Yoshida (CCY) plasticity model ... 83
3.3.1 Y ield surface ... 84
-9-3.3.3
Definition of the equivalent plastic strain...
85
3.3.4
Isotropic hardening ...
85
3.3.5
Non-linear kinematic hardening ...
86
3.3.6
Work hardening stagnation ...
87
3.3.7
Summary of model parameters ...
90
3.3.8
Thermodynamic constraints...
90
3.4
Plasticity model identification and validation...
92
3.4.1
Identification step I: determination of seed parameters ...
93
3.4.2
Identification step II: full inverse parameter identification ... 94
3.4.3
Model verification for reverse loading ...
96
3.4.4
Model verification for monotonic multi-axial loading ... 101
3.5
Effect of loading reversal on ductile fracture initiation ...
102
3.5.1
Characterization of the stress state...
103
3.5.2
Effect of pre-compression on results for notched tension ... 103
3.5.3
Hosford-Coulomb fracture initiation model ...
107
3.5.4
Model identification and verification...
109
3.5.5
Discussion of the effect of pre-strain on ductile fracture... 112
3 .6
Sum m ary ...
114
Chapter 4: Critical Hardening Rate Model for Predicting Path Dependent Ductile
F ractu re ...
1 15
4 .1
Intro d uction ...
116
- 10
-4.2 Plasticity m odel... 118
4.2.1 Y ield function and flow rule ... 119
4.2.2 Hardening evolutions ... 120
4.2.3 Evolution of the back stress tensor ... 122
4.2.4 W ork Hardening Stagnation ... 124
4.2.5 Therm odynam ic constraints... 124
4.2.6 Illustration for uniaxial loading ... 126
4.3 Critical hardening rate fracture initiation m odel... 127
4.3.1 M echanism -based m odeling ... 127
4.3.2 Phenom enological m odeling for proportional loading ... 128
4.3.3 Phenomenological modeling for non-proportional loading... 130
4.3.4 Extended form ulation... 133
4.3.5 Com m ent on the m odel sensitivity ... 134
4.4 Experim ents... 134
4.4.1 Overview on experim ental procedures ... 135
4.4.2 Details on experim ental procedures... 136
4.4.3 Overview on experim ents perform ed... 141
4.5 A pplication and validation ... 142
4.5.1 Plasticity m odel param eter identification ... 142
4.5.2 Reverse Loading ... 143
- 11
-4.5.4 V alidation and discussion ... 150
4.6 Sum m ary ... 152
Chapter 5: Conclusion... 155
5.1 Sum m ary of findings... 155
5.1.1 Hosford-Coulom b ... 155
5.1.2 Ductile fracture of sheets after in-plane compression-tension... 156
5.1.3 Critical Hardening Rate ... 157
5.2 Ongoing and future w ork ... 157
5.2.1 Orthogonal n ... 157
5.2.2 Validations studies ... 158
5.2.3 Strain rate and tem perature effects ... 160
--13
-List of Figures
Figure 1-1 Comparison of the von Mises stress versus equivalent plastic strain curve for
monotonic loading with that after loading reversal at a strain of 0.1 to illustrate different
hardening model assumptions: (a) isotropic hardening, (b) permanent softening, (c) work
hardening stagnation, (d) transient behavior...
25
Figure 1-2 Loading Paths at points (1) and (2) during the three point bending of the
hat-sh ap ed p rofile ...
29
Figure 1-3 Comparison of the fracture observed during experimental three point bending
of a martensitic hat-shaped profile with the numerical prediction using isotropic hardening
and linear damage accumulation indicator. ...
29
Figure 1-4 Comparison between load-displacement curves under compression-tension for
(a) round bars of aluminum (b) flat specimens of DP780 sheets...
32
Figure 1-5 Comparison between stress-strain curves under compression-tension for (a)
round bars of aluminum (b) flat specimens of DP780 sheets ...
33
Figure 2-1 Eulerian illustration of the ductile fracture process with coalescence through (a)
internal necking, and (b) void sheet fracture. The mesoscopic primary band of localization
is highlighted in gray color, the microscopic secondary band of localization is highlighted
in red . ...
3 9
Figure 2-2 (a) Illustration of the stress triaxiality i and the Lode angle parameter
0
in
principal stress space
{
1, -,,%-
}.Selected Lode angle parameter values are only shown
for the 60' segment of a-plane where the principal stresses satisfy the order
0-
1
o-j,c-r
.For the other five 60' segments, the same labeling applies because of the
symmetries of the unordered principal stress space; (b) non-linear relationship between 0
and il for plane stress. The blue, black and red curves shows the relationship for biaxial
- 14
-and one negative principal stress), -and biaxial tension (two positive principal stresses), respectively. Open dots highlight the special cases of cases of a. uniaxial compression, b. pure shear, c. uniaxial tension, d. plane strain tension, and e. equi-biaxial tension"... 44
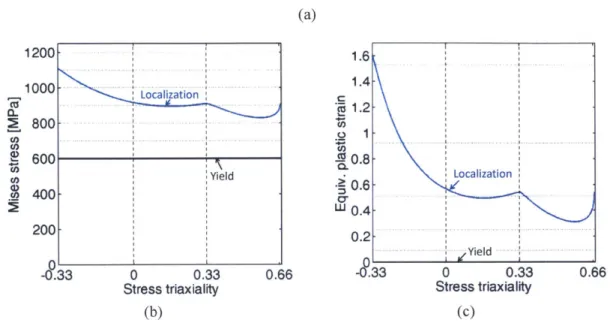
Figure 2-3 Localization analysis results: (a) Relationship between the shear and normal stress acting on the plane of localization; (b) Macroscopic equivalent plastic strain at the onset of localization as a function of Lode angle parameter and stress triaxiality; each dot represents the result from a unit cell analysis for a particular stress state, the solid curves correspond to the predictions of the Mohr-Coulomb model. Note that both plots have been prepared using the same MC model parameters (friction c, = 0.13, cohesion c2 = 666MPa
)...
4 9
Figure 2-4 Coordinate transformation for plane stress conditions: (a) initial von Mises yield envelope (solid black line) with subsequent von Mises stress iso-contours and EMC localization locus (blue line) for proportional loading; (b) representation of the same envelopes in the modified Haigh-Westergaard space, and (c) in the mixed strain-stress sp a ce ... 5 2
Figure 2-5 Representation of special cases of the Hosford-Coulomb (HC) model in the modified Haigh-Westergaard space. The blue lines show the strain to fracture for plane stress con d itio n s... 54
Figure 2-6 Effect of the parameters of the Extended Mohr-Coulomb (EMC) model on the fracture envelope for plane stress loading. ... 55
Figure 2-7 Measured true stress versus logarithmic plastic strain curve for uniaxial tension along different material directions up to the point of necking for (a) DP590, (b) DP780. Note that each graph shows the curves for three different specimen orientations (00, 450 and 90'), but they lie exactly on top of each other and thus only one curve is visible... 61
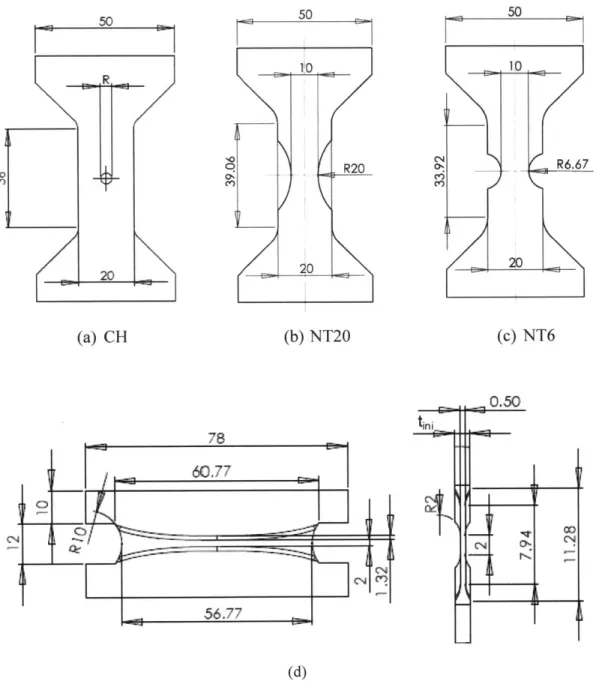
Figure 2-8 Specimen drawings for flat tension specimens with (a) a central hole, (b)-(c) different notches, and (d) the butterfly specimen for shear testing... 62
-15-Figure 2-9 Measured and simulated force displacement curves for selected fracture experiments on the DP590 steel. The star symbols represent the experimental curves, while the simulation results are shown as solid lines. A contour plot of the equivalent plastic
strain at the onset of fracture is shown below each figure... 63
Figure 2-10 Comparison of the Hosford-Coulomb (HC) model predictions (blue dots) with experimental results (end point of the black lines) after calibration based on the SH, CH and NT6 experiments. The predictions of the Mohr-Coulomb (MC) model are shown as red dots. The units of the cohesion b are M Pa... 68
Figure 3-1 Comparison of the true stress strain experimental response with a theoretical isotropic hardening response after loading reversal from uniaxial tension to uniaxial compression at strain of 0.08 to illustrate different hardening behaviors: isotropic hardening, permanent softening, work hardening stagnation, transient behavior. ... 75
Figure 3-2 Uniaxial stress-strain response of DP780 steel for different directions under un iax ial ten sion ... 78
Figure 3-3 Specimen geometry for uniaxial compression-tension experiments... 79
Figure 3-4 Displacement measurement using Digital Image Correlation (DIC)... 79
Figure 3-5 Notched specimen (NCT) for compression-tension fracture testing... 80
Figure 3-6 Front view of the experimental set-up for compression-tension testing... 81
Figure 3-7 Schematic side view of the specimen with anti-buckling device and high pressure clam p s... 8 1 Figure 3-8 Experimental results: engineering stress-strain curves as obtained from uniaxial tension-com pression experim ents... 83
Figure 3-9 Experimental results: force-displacement curves as obtained from notched com pression-tension experim ents... 83
-
16-Figure 3-10 Illustration of the work hardening stagnation model in the plastic strain space. The sequence shows (a) the initial values, (b) the evolution during monotonic loading, (c) the point of loading reversal, (d) the transient stagnation after loading reversal, and (e)-(f) the evolution after stagnation... 89
Figure 3-11 Comparison of CCY model (solid lines) and experiments (solid dots) for (a) uniaxial tension-compression (UTC), and (b)-(f) notched compression-tension (NCT); the Chaboche model predictions are depicted as dashed lines. ... 98
Figure 3-12 Thickness profiles at the instant of inset of fracture as measured experimentally (solid dots) and extracted from numerical simulation (CCY=solid lines, Chaboche=dashed line) after pre-compression up to a surface strain of (a) 0. (b) 0.08, and (c) 0.12; note that the results are shown for specimens extracted from a different batch of DP780 sheets. 100
Figure 3-13 Results from monotonic experiments: (a) notched tension (NT6), (b) tension with a central hole (CH), and (c) butterfly specimen (SH); solid dots = experiments, solid lines = CCY model, dashed lines = Chaboche model; the contour plots show the distribution of the equivalent plastic strain at the instant of fracture initiation. ... 102
Figure 3-14 (a) Equiv. plastic strain distribution in the longitudinal specimen cross-section, and (b) thickness distribution at the instant of fracture initiation... 105
Figure 3-15 Detailed analysis of the NCT-13 results: (a) force-displacement curve and local surface strain; Evolutions of (b) the CCY hardening terms: isotropic hardening resistance (solid line), axial component of the back stress tensors (dashed line) and (dotted line), (c) the von Mises stress, (d) the thickness profiles, and (e) the stress triaxiality; the dashed
line in (e) depicts the Chaboche model prediction; the labels (,
4,
®
and
®
indicate
the point of load reversal, onset of stagnation (also maximum load in tension), end of stagnation, and onset of fracture... 107
Figure 3-16 Loading paths to fracture as extracted from finite element simulations of all fracture experiments up to the instant of fracture initiation (end point of solid lines); the
-17
-Figure 3-17 Strain to fracture for proportional loading as a function of the Lode angle
param eter and the stress triaxiality...
110
Figure 3-18 evolution of the damage indicator at the location of fracture initiation in
com pression-tension experim ents...
111
Figure 3-19 Strain to fracture after compression-tension loading of NCT specimens as a
function of the equivalent plastic strain at the point of loading direction reversal; the star
symbols present the hybrid experimental-numerical results, the solid dots care model
p red ictio n s...
1 12
Figure 3-20 Net fracture strain after compression-tension loading of NCT specimens as a
function of the equivalent plastic strain at the point of loading direction reversal; the star
symbols present the hybrid experimental-numerical results, the solid dots care model
p red ictio n s...
1 13
Figure 4-1 Representation of the Hosford-Coulomb criterion for a power law material with
plane stress condition in the following spaces (a) first and second in-plane stress
components (b) Haigh-Westergaard (c) mixed stress-strain (d) mixed hardening rate-stress.
The initial Von Mises yield envelope (solid black line), the subsequent Von Mises
iso-contours (black dotted line) and Hosford-Coulomb fracture locus (solid blue line) are
sh o w n ...
13 0
Figure 4-2 Effect of plasticity on the prediction of fracture under reverse loading for the
Hosford-Coulomb model as a function of the choice of critical quantity at fracture... 133
Figure 4-3 Schematic of the dual actuator system ...
137
Figure 4-4 Geometry of the Mohr-Oswald specimen...
138
Figure
4-5
Comparaison of the stress-strain response of DP780 under loading reversal after
10% equivalent plastic strain for shear reversal (solid line) and tension followed by
com pression (dotted line) ...
139
Figure 4-6 Geometry of the Dunand-Mohr butterfly specimen...
140
- 18
-Figure 4-7 Effect of model parameters for reverse loading: (a) parameter 7" (b) parameter C p (c) param eter h (d) param eter yp. ... 144
Figure 4-8 Comparison of the Von Mises stress to equivalent plastic strain after loading reversal for experimental data (black dotted line) and the prediction of the model after calibration (red solid line) for (a) Shear reversal on DP590 (b) Tension compression on D P 7 8 0 . ... 14 6
Figure 4-9 Comparison of the experimental (dotted line) and predicted (solid line) load displacement response for (a) monotonic shear (b) shear reversal after 25% equivalent plastic strain (c) shear reversal after 50% equivalent plastic strain... 147
Figure 4-10 Comparison of the experimental measurements (dotted line) and the model prediction (solid line) for load-displacement (black) and local surface strain (blue) for (a) CTR_0 (b) CTR_05 (c) CTR_10 (d) CTR_15 (e) CTR_20. ... 148
Figure 4-11 Calibration of the critical Hardening rate H-C model using the monotonic data for (a) D P590 (b) D P780... 150
Figure 4-12 Prediction of the onset of fracture (dots) using the critical hardening rate model and loading paths to fracture (solid lines) for (a) compression followed by tension experiments on DP780 (b) Shear reversal experiments on DP590... 151
Figure 5-1 Comparison of the experimental load-displacement (dashed lines) with the numerical prediction (red line) using the plasticity model calibrated in chapter 4 for DP590 on orthogonal tests (a) notched tension at 90 degrees with respect to a 5% tensile pre-strain (b) shear to 50% equivalent plastic strain followed by plane strain tension to fracture. 158
Figure 5-2 Comparison of (b) the crack during experimental three point bending of a martensitic hat-shaped profile with (a) the crack predicted by FEA using a linear damage indicator and (c) the crack predicted by FEA using the non-linear damage indicator. .. 159
19
-List of Tables
Table 2-1 Lankford R atios ... 60
Table 2-2 Dual steel hardening law parameters... 66
Table 3-1 Plasticity model parameters for the Combined Chaboche-Yoshida (CCY) model and the C haboche m odel... 96
Table 3-2 Net fracture strain (equivalent plastic strain at fracture minus compressive pre-strain) as a function of the compressive pre-strain. ... 113
Table 4-1 Sum m ary of all experim ents... 142
T able 4-2 L ankford R atios... 143
Table 4-3 Sw ift-V oce Law param eters... 143
Table 4-4 Reverse Loading Hardening Parameters ... 145
20Chapter 1: Introduction 21
-Chapter 1: Introduction
1.1
Ductile Fracture
The Gurson type of models (Gurson, 1977) have received considerable attention over the past three decades because of their sound micromechanical basis and ability to predict fracture across many applications. These models are inspired by McClintock, and propose the nucleation, growth and coalescence of voids as the main mechanism leading to fracture. Gurson models, or shear-modified Gurson models, are highly relevant for a material response considered across a wide range of triaxialities. Instead, the stress state in sheet materials is usually close to plane stress and hence the void growth driving stress triaxiality does not exceed a value of 0.67. Even inside a localized neck, where three-dimensional stress states develop, the stress triaxiality seldom exceeds values of 0.7. Consequently, there is limited void growth in a statistically homogeneous sense in sheet specimens. This conclusion is supported by experimental observations for pure copper (Ghahremaninezhad and Ravi-Chandar, 2011), nodal cast iron (Ghahremaninezhad and Ravi-Chandar, 2012a) and aluminum 6061-T6 (Ghahremaninezhad and Ravi-Chandar, 2012b). Void growth is important after the onset of shear localization (e.g. Tekoglu, 2012). This may be concluded from micrographs of fracture surfaces, which show the dimple signature of voids growth and coalescence. Gurson models were initially developed for plasticity with success. However, there is growing evidence that the plastic response of sheet materials in terms of stress strain relation for proportional loading can be predicted with reasonable accuracy up to the point of shear localization simply by the isotropic growth of a yield surface, provided a suitable identification method of the hardening law (e.g. Dunand and Mohr, 2010, Dunand et al., 2011).
Gurson models are often adapted to fracture prediction by proposing that coalescence of voids dramatically accelerates at a critical porosity leading to imminent fracture initiation. However, recent experimental evidence regarding ductile fracture at low stress triaxialities
(Barsoum and Faleskog, 2007, Mohr and Henn, 2007, Dunand and Mohr, 2011 a) is
- 22 - Chapter 1: Introduction
An alternative approach to predicting fracture with Gurson models is to assume that ductile fracture occurs when the governing field equations lose ellipticity. This assumption goes back to Rice's shear localization analysis (Rice, 1976), and has been explored extensively thereafter (e.g. Needleman and Tvergaard, 1992). Recent examples in the context of Gurson models are the works by Nahshon and Hutchinson (2008), as well as those by Danas and Ponte Castaneda (2012). Nahshon and Hutchinson (2008) added a shear term to the void volume evolution law of the GTN model (Tvergaard and Needleman, 1984), and demonstrated the importance of this modification in their predictions of shear localization. Danas and Ponte Castaneda (2012) used non-linear homogenization to come up with a Gurson-type of model that accounts for void shape changes (that are characteristic for shear loading). Their analysis of the loss of ellipticity at low stress triaxialities also led to predictions that are very different from those of the traditional
Gurson model.
However, unless the propagation of cracks is to be modeled, the modeling of the post shear localization behavior is only of little interest in engineering applications, such as sheet metal forming and crashworthiness, because the width of shear bands is typically of the size of a few grains. Instead, it is reasonable to assume that the onset of ductile fracture
coincides with the onset of shear localization. As the results from Nahshon and Hutchinson (2008), and Danas and Ponte Castaneda (2012), show, the predictions of the loss of ellipticity are material imperfection sensitive which includes unavoidable inaccuracies in the plasticity model formulation.
Damage indicator models were introduced as an attempt to predict the onset of shear localization (and hence fracture in an engineering sense) at low computational cost. This indicator is a dimensionless scalar variable that evolves as a function of the stress state and plastic deformation. It is initially zero while fracture is assumed to occur as it reaches a defined critical value. Bao and Wierzbicki (2004) provide a comprehensive overview on different stress-state dependent damage indicator models, including weighting functions,
based on the work of McClintock (1968), Rice and Tracey (1969), LeRoy et al. (1981), Cockcroft and Latham (1968), Oh et al. (1979), Brozzo et al. (1972), and Clift et al. (1990).
The choice of the stress-state weighting function is critical in damage indicator models.
Chapter 1: Introduction 23
-model, which is based on a stress-state dependent weighting function that has been derived from the Mohr-Coulomb failure model in stress space. The MMC model has been successfully applied in predicting fracture of aluminum 6061-T6 (Beese et al., 2010) and advanced high strength steels (e.g. Li et al, 2010, Luo and Wierzbicki, 2010, Dunand and Mohr, 2011 a). In chapter 2 of this thesis, we propose a limiting envelope in the stress space to indicate the onset of localization for proportional loading. A weighting function is derived so that the damage indicator approach is mathematically equivalent for proportional loading. The model gives good results for proportional and close to proportional loading tests. However, it is shown in chapter 3 that further enhancements are necessary for highly non-linear loading paths. A concerning limitation of such models is that there is no evidence that the damage indicator quantifies a specific physical mechanism. Rather than investing efforts in refining empirically such damage indicators, it is worth considering that other quantities beyond the stress or strain may be the main relevant physical measure of the initiation of localization. Models such as the Hosford-Coulomb model may be transformed in order to remain accurate for proportional loading while becoming relevant for non-linear loading conditions.
1.2 Plasticity for Complex Loading
Predicting the onset of ductile fracture has been an active field of research for more than 50 years. In particular, the fracture initiation after monotonic proportional loading paths has been investigated intensively (e.g. Brunig et al. (2008), Bai and Wierzbicki
(2008, 2010), Sun et al. (2009), Li et al. (2011), Gruben et al. (2011), Chung et al. (2011),
Lecarme et al. (2011), Khan and Liu (2012), Luo et al. (2012), Huespe et al. (2012), Malcher et al. (2012), Lou et al. (2014)). In industrial practice, in particular during sheet metal forming, ductile fracture often initiates after complex non-proportional loading histories. Among these, reverse loading is an important non-proportional loading condition, which prevails for instance when a sheet is bent and unbent as it is drawn over a die radius.
Simulating the mechanical response of ductile materials up to the point of fracture initiation requires the accurate modeling and identification of the hardening behavior of
- 24 - Chapter 1: Introduction
the material at large strains. Many plasticity models for reverse loading have been developed for life-cycle analysis. As a result, most experimental procedures are designed for characterizing the small strain response only. One of few exceptions are the reverse shear experiments of Barlat et al. (2003) on 3mm thick 1050-0 aluminum sheets. Using wide shear specimens with a narrow gage section of reduced thickness, they achieved shear strains of up to 0.22 prior to loading direction reversal. Yoshida et al. (2002) presented an experimental study on the kinematic hardening response of sheet materials involving a finite strain compression phase. They bonded several flat specimens together and inserted the stack of specimens in an anti-buckling device during testing. Other examples of the use of anti-buckling devices for testing sheet materials under in-plane compression can be
found in Dietrich and Turski (1978), Kuwabara (1995), Yoshida et al (2002), Boger et al (2005), Cao et al (2009) and Beese and Mohr (2011).
The large strain compression-tension experiments by Yoshida (2002) show that DP steels feature a Bauschinger effect, transient behavior, permanent softening and work hardening stagnation. Recall that the Bauschinger effect corresponds to an early yield after load reversal (Figs. 1-lb and 1-Id); transient behavior corresponds to a high hardening rate in the elasto-plastic transition regime resulting from load reversal (Fig. 1-Id); permanent
softening prevails when the stress level after loading reversal remains below that for
monotonic loading for the same equivalent plastic strain (Fig. 1-lb); work hardening stagnation causes a significantly reduced hardening rate after the transient hardening
Chapter 1: Introduction 25 - $-0 0 "ZU, 1000-800 600-400 200 I i I 0 0.1 0.2 0.3 0.4
Equivalent Plastic Strain
(a)
0.1 0.2 0.3
Equivalent Plastic Strain
(c) 11000 0-800 & 600 400 0 > 200 0 0.1 0.2 0.3 0.4
Equivalent Plastic Strain
(b)
0.4 ''0 0.1 0.2 0.3
Equivalent Plastic Strain 0.4
(d)
Figure 1-1 Comparison ofthe von Mises stress versus equivalent plastic strain curve for monotonic loading with that after loading reversal at a strain of 0.1 to illustrate different hardening model assumptions: (a) isotropic hardening, (b) permanent softening, (c) work hardening stagnation, (d) transient behavior.
Detailed reviews of kinematic hardening models are found in Chaboche (2008), and
Eggertsen and Mattiasson (2009, 2010, 2011). Prager (1956) type of kinematic hardening, also referred to as linear kinematic hardening, describes both the Bauschinger effect and
Isotropic Hardening C-0 Permanent Softening Bauschinger effect 1000- 800-600 400-200 1200 ' 1000 0.. 800 600 0> 400 200 OL Bauschinger effect Transient Behavior I ______________
,n
( Workhardening Stagnation- 26 - Chapter 1: Introduction
permanent softening. The main shortcoming of this model is the intrinsic coupling of both effects, i.e. a material exhibiting a Bauschinger effect without any permanent softening cannot be described with Prager's model. Furthermore, it describes neither transient behavior nor work hardening stagnation. Also, this type of hardening is unbounded and results in a persistent and often unrealistic rate of hardening at large strains. The Armstrong-Frederick (1966) kinematic hardening rule, also referred to as non-linear
kinematic hardening model, describes the Bauschinger effect and transient behavior. The
governing differential equation includes a recall term which activates the so-called dynamic-recovery. The recall term is co-linear to the back stress tensor and is proportional to the increment in equivalent plastic strain. As a result, the evolution of the back stress is no longer linear and unbounded, and converges towards a saturation value under monotonic loading. Two parameters are used: one to control the Bauschinger effect and one for the transient behavior. However, the Armstrong-Frederick model describes neither permanent softening nor work hardening stagnation.
For improved approximations, several non-linear kinematics hardening models can be added with different recall constants characterizing the back stress evolution (Chaboche et al., 1979; Chaboche and Rousselier, 1983). These models give good predictions in the case of cyclic loading in the range of small strains, as they are able to describe the Bauschinger effect with great accuracy. The special case of coupling linear kinematic hardening with non-linear kinematic hardening provides good predictions in the case of moderate and large strains, as it describes the permanent softening behavior during reverse deformation, especially with advanced high strength steels free from work hardening stagnation (Yoshida et al., 2002). However, the permanent softening effect is only represented through the linear kinematic term. As a result, an increase of the amount of permanent softening in the model always results in an increase in the strain hardening at large strains.
Mroz (1967) proposed a multi-surface model framework to describe strain hardening. This idea was developed further by Dafalias and Popov (1976) by making use of a bounding surface in addition to the yield surface, with the distance between these two evolving surfaces defining the rate of strain hardening. Chaboche (2008) argues that a model featuring a combination of linear and non-linear kinematic hardening terms, in addition to isotropic hardening, can replicate the performance of a Dafalias-Popov type of
Chapter 1: Introduction 27
-model. However, one advantage of the Dafalias-Popov type of formulations is that the material response to monotonic loading can be identified independently from its response to reverse loading. The Dafalias-Popov model has been developed further by Geng and Wagoner (2000) to account for permanent softening. Yoshida and Uemori (2002) enriched the model even further and incorporated work-hardening stagnation.
To the best of the authors' knowledge, experimental results on the effect of loading direction reversal on the strain to fracture are scarce and only found for bulk materials in the open literature. Bao and Treitler (2004) performed reverse loading experiments on notched axisymmetric bar aluminum 2024-T351 specimens with compression followed by tension all the way to fracture. They observed a substantial increase in ductility due to pre-compression. Papasidero et al. (2014) made use of a biaxial testing machine to subject tubular fracture specimens to non-proportional loading. Their results also demonstrated that pre-compressing aluminum 2024-T351 increases the strain to fracture for subsequent
loading at higher stress triaxialities.
1.3 Strain path dependency of FLD and fracture toughness
The effect of complex loading histories has been studied for several failures modes of materials. Surprisingly, the literature is scarce regarding ductile fracture.
In many situations in forming applications, localization of deformations in the thickness of the sheet occurs prior to ductile fracture. Necking being considered itself a mode of failure, it is often predicted using the Forming Limit Diagram, since it cannot be predicted with shell elements. It is well known in the literature that the FLD varies under non-linear loading histories (Muschenborn and Sonne, 1975; Graf and Hosford, 1994; Stoughton, 2000; Stoughton and Zhu, 2004). The dependence of the FLD on the strain path has been a very active field of research for decades. (Marciniak and Kuczynski, 1967; Cao et al., 2000; Chow et al., 2001). Interestingly, Stoughton (2000) suggested that the FLD is not path dependent when converted to a limit in the stress space.
The effect of pre-strain has also been studied for fracture toughness. Enami (2005) studied the reduction of ductility to cleavage cracks in the case of pre-compression. Eikrem (2008) studied the crack resistance curve using single edge notched tension (SENT) specimens.
- 28 - Chapter 1: Introduction
He suggests that in the case of crack after cyclic loading, comparing symmetric and asymmetric cycles, the amount of compression plays a significant role in the fracture toughness. All studies suggest that the hardening exponent n plays a role, although the trends are not in agreement. Eikrem claims that, "It is known that plastic deformation will not only modify the yield and strain hardening behavior, but will also influence in a detrimental manner the local failure mechanisms, the initiation toughness and fatigue properties".
1.4 Examples of non-linear loading paths
1.4.1 Crash
Bai (2006) showed analytically and numerically that there exists strain reversal in the case of prismatic square aluminum tubes subjected to crash loading. The study suggests that loading histories play a significant role in fracture initiation depending on the wall thickness and experimental location of fracture.
Recently, Pack and Marcadet studied the three point bending of a hot formed martensitic hat section. Using conventional damage accumulation indicator with effect of stress state, the location of crack initiation is wrongly predicted. Two points have competing fracture. Point (2) is mostly under plane strain tension, while point (1) undergoes plane strain compression followed by plane strain tension (Fig. 1-2). The complex loading of point (1) is due to the folding followed by unfolding during the indentation process of the structure by the punch. A numerical simulation using isotropic hardening plasticity and a linear damage accumulation rule function of the stress state predicts fracture at point (1), while experimental fracture occurs at point (2) (Fig 1-3). This suggests that the ductility of point (1) is underestimated by the model. Therefore, it appears that there is a need to understand better the effect of complex loading histories of material ductility.
Chapter 1: Introduction 29
-0.66
Figure 1-2 Loading Paths at points (1) and profile
(2) during the three point bending of the hat-shaped
Figure 1-3 Comparison of the fracture observed during experimental three point bending of a martensitic hat-shaped profile with the numerical prediction using isotropic hardening and linear damage accumulation indicator.
1.4.2 Combined Forming and Crash
In another attempt to understand the effect of loading histories on ductile fracture, three point bending tests of a cold formed hat-shaped profile made in DP980 were performed. Numerical simulations of the process using several modeling approaches were considered. One approach consisted in considering the material as virgin after the forming process. It
1.2 1 0.8
1&
0.6
S0.4 0.2 ni -0.66-0
-0.330
Triaxiality 0.33I
- 30 - Chapter 1: Introduction
has been found that the damage indicator fails to predict the fracture that was observed experimentally. This error can be attributed to the fact that the remaining hardening capacity of the material after forming is overestimated by this approach, and that damage accumulated during forming was not taken into account. When simulating the multi-step process from forming to crash with isotropic hardening plasticity and linear damage accumulation rule, the fracture is predicted too early. Once again, this suggests that the ductility of the material increases when loaded along complex histories.
1.5 Complex Loading on Bulk Material
Johnson and Cook (1985) found early evidence that the prediction of ductile fracture with damage indicators would be challenged under complex loading. They performed torsion followed by tension of OHFC copper, and found that the ductility was underestimated for such loading conditions.
Tai (1990) proposed an interesting experimental way to perform two stage loading on round bars. The purpose is to investigate the effect of a change of triaxiality during loading on the ductility of the material. In the first stage, round bars with a notch of a certain radius Ri are loaded under tension. As a consequence, the stress state in the center of the specimen has a certain triaxiality l1. The test is then interrupted somewhere along the loading. A new radius R2 is machined on the specimen before placed back in the testing machine to resume
loading up to fracture. Because of the change in notch radius, the material is then loaded with a different triaxiality 112. The Lode angle parameter remains constant in such a test due to the axisymmetry of the specimens.
The work by Bao and Treitler is a rare example of an investigation of the effect of compression followed by tension on the ductility of a 2024-T351 aluminum alloy. Round bars with different notch radii are first loaded under compression. The loading is then reversed to tension up to fracture. In this case, both the Lode angle parameter and the triaxiality change sign during reversal. It was concluded from this study that the loading reversal decreased the ductility of the aluminum.
Chapter 1: Introduction 31
-Bai revisited such experimental methods in his PhD thesis. He also introduced complex loading history tests on butterfly specimens with thickness reduction in the gage section. Shear followed by tension is a similar loading sequence to torsion followed by tension. Compression followed by tension was also performed. Finally, he was able to perform some reverse shear tests. All tests suggest that there is a ductility increase with loading complexity. He proposed an empirical damage indicator to fit the data.
Papasidero and Mohr (2014) introduced an innovative experimental method to test bulk materials under a combination of torsion and tension using round tubes with thickness reduction. In particular, they performed torsion followed by tension tests. It was shown that a non-linear damage indicator could predict the effect of loading complexity on the ductility of aluminum.
1.6 Particularities of Sheet Metal
In order to investigate the behavior of material under reverse loading, new testing programs have to be developed. Different types of tests are used to identify the plastic response of the material and to measure the loading paths to fracture under specific stress state. A main challenge of sheet metal is the occurrence of localized necking, the concentration of deformations through the thickness of the sheet. In figure 1-4, the load-displacement response is compared for bulk aluminum and DP780 sheet metal in reverse loading. While almost no necking is observed on bulk, DP780 sheets feature a very important phase of deformations after necking. Uniaxial specimens are not suitable for measuring the behavior of the material after maximum load. The load-displacement relation after maximum load is not experimentally repeatable. The statistical spread may be attributed to imperfections in the experimental set-up (alignment) and material imperfections (inclusions) that trigger the instability leading to localization. Therefore, identifying the hardening curve at large strains using an inverse method with FEA cannot be performed on a dogbone specimen because there is not a right choice of the response after necking. In case of tension after compression, due to the effect of loading reversal on the plastic behavior, necking occurs
- 32 - Chapter 1: Introduction
very early (Fig. 1-5). To the knowledge of the author, the plastic behavior of sheet metal after reverse loading has never before been identified all the way to fracture.
U. 100 W0 fj0 40 20 -40 Displacement (mm) (a) 10 5 r0 0 -j 0 -5 -10 -2 -1 0 Displacement [mm] 1 (b)
Figure 1-4 Comparison between load-displacement curves under compression-tension for (a) round bars of aluminum (b) flat specimens of DP780 sheets.
-ABAQUJ 0 15 1 -C --NCT-3 - NCT-3 - NCT-13
Chapter 1: Introduction 33
-/
I ________ -1 .gW --- Reverse loading 2 --- Reverse loading 3 -0.2 -0.1 0.0 0.1 0.2Strain
(a) -0.1 -0.05 0 0.05 Engineering Strain 0.1 0.15 (b)Figure 1-5 Comparison between stress-strain curves under compression-tensionfor (a) round bars of aluminum (b) flat specimens of DP780 sheets
(-2I 1000-500 - 0- -500- -1000-1000 600 400 200 0 -200 400 -600 -800 -1000 LU 0 C a) 'U 1- 34 - Chapter 1: Introduction
1.7
Thesis Outline
The Thesis is decomposed in seven chapters. Each chapter, apart from Chapter 1 and
Chapter
5,
addresses one specific topic and corresponds to a peer-reviewed journal
publication.
The first chapter is a general introduction to the topic and motivations of the thesis.
Previous work related to the field is briefly reviewed. The general organization of the thesis
is outlined.
The starting point of the original research part of this thesis is a second chapter on the
development of a micromechanically-motivated ductile fracture initiation model for metals
for proportional loading. Its formulation is based on the assumption that the onset of
fracture is imminent with the formation of a primary or secondary band of localization.
Motivated by the results from a thorough unit cell analysis, it is assumed that fracture
initiates after proportional loading if the linear combination of the Hosford equivalent
stress and the normal stress acting on the plane of maximum shear reaches a critical value.
A comprehensive fracture initiation model is then obtained after transforming the
localization criterion from stress space to the space of equivalent plastic strain, stress
triaxiality and Lode angle parameter using the material's isotropic hardening law.
Experimental results are presented for three different advanced high strength steels. For
each material, the onset of fracture is characterized for five distinct stress states, including
butterfly shear, notched tension, tension with a central hole and punch experiments. The
comparison of model predictions with the experimental results demonstrates that the
proposed Hosford-Coulomb model can predict the instant of ductile fracture initiation in
advanced high strength steels with satisfactory accuracy.
In a third chapter, experimental methods are developed to perform compression-tension
experiments. In addition, a finite strain constitutive model is proposed, combining a
Swift-Voce isotropic hardening law with two Frederick-Armstrong kinematic hardening rules
and a Yoshida-Uemori type of hardening stagnation approach. The plasticity model
parameters are identified from uniaxial tension-compression stress-strain curve
measurements and finite element simulations of compression-tension experiments on
Chapter 1: Introduction 35
-notched specimens. The model predictions are validated through comparison with experimentally-measured load-displacement curves up to the onset of fracture, local surface strain measurements and longitudinal thickness profiles. The extracted loading paths to fracture show a significant increase in ductility as a function of the compressive pre-strain. The Hosford-Coulomb model is therefore integrated into a non-linear damage indicator modeling framework to provide a phenomenological description of the experimental results for monotonic and reverse loading.
The chapter 4 presents another extension of the modeling framework inspired by the results from loss of ellipticity analysis. It is demonstrated that the Hosford-Coulomb model can also be expressed in terms of a stress-state dependent critical hardening rate. Moreover, it is shown that the critical hardening rate approach provides accurate predictions of the instant of fracture initiation for both proportional and non-proportional loading conditions. Enhancements of the finite strain constitutive model are also proposed to enable a fast identification of all model parameters. The plasticity model parameters are identified from stress-strain curve measurements from shear loading reversal on specimens with a uniform thickness reduced gage section. The model is used to estimate the local strain and stress fields in fracture experiments after shear reversal. The extracted loading paths to fracture show a significant increase in ductility as a function of the strain at shear reversal, a feature that is readily predicted by the proposed critical hardening rate model.
In chapter 5, the main findings of the thesis are summarized. Some ongoing work is described and potential directions for further research are discussed.
Chapter 2: HosfordCoulomb Model for Predicting Ductile Fracture 37
-Chapter 2: Hosford-Coulomb Model for
Predicting Ductile Fracture
A phenomenological ductile fracture initiation model for metals is developed for
predicting ductile
fracture
in industrial practice. Its formulation is based on the assumptionthat the onset offracture is imminent with the formation of a primary or secondary band of localization. The results from a unit cell analysis on a Levy-von Mises material with spherical defects revealed that a Mohr-Coulomb type of model is suitable for predicting the onset of shear and normal localization. To improve the agreement of the model predictions with experimental results, an extended Mohr-Coulomb criterion is proposed
which makes use of the Hosford equivalent stress in combination with the normal stress acting on the plane of maximum shear. A fracture initiation model is obtained by
transforming the localization criterion
from
stress space to the space of equivalent plasticstrain, stress triaxiality and Lode angle parameter using the material's isotropic hardening law. Experimental results are presented for three different advanced high strength steels.
For each material, the onset of
fracture
is characterized for five distinct stress statesincluding butterfly shear, notched tension, tension with a central hole and punch experiments. The comparison of model predictions with the experimental results demonstrates that the proposed Hosford-Coulomb model can predict the instant of ductile
- 38 - Chapter 2: Hosford-Coulomb Model for Predicting Ductile Fracture
2.1
Introduction
Ductile fracture is a well-known physical process that leads to the formation of cracks in metals due to the nucleation, growth and coalescence of voids. In cases where macroscopic localization precedes void coalescence, the ductile fracture process may be described as follows: as the material deforms plastically, pre-existing (primary) voids evolve and new ones nucleate (stage in Fig. 2-1). Due to the increase in porosity and the decrease in macroscopic strain hardening, the conditions for a discontinuity in the macroscopic strain field along a planar interface may be met. The result is the formation of a primary band of localization at the mesoscale (stage
@
in Fig. 2-1). As stated by Pardoen and Hutchinson (2000) with reference to Tvergaard (1981), the width of a primary localization band is expected to be of the order of the inter-void spacing. Subsequently, the material inside the band experiences accelerated void growth and nucleation (stage @ in Fig. 2-1). As a result, the porosity and/or the number of voids within the band increase sharply and the mechanical fields around individual primary voids begin to interact. The nucleation of secondary voids (which are often several orders of magnitude smaller than primary voids) is also possible at this stage. The final coalescence phase sets in when the deformation begins to localize within secondary bands of localization at the microscale (stage in Fig. 2-1). In other words, inside the primary localization band, there is a transition from diffuse to localized plastic flow, which ultimately leads to primary void coalescence and the formation of cracks through internal necking or void sheet fracture of the ligaments between primary voids (stages®
and0
in Fig. 2-1). As discussed by Tekoglu et al.(2015), polycrystalline materials may also fail due to (i) localized plastic flow only (e.g.
necking up to zero cross-sectional area), (ii) localization of plastic flow after damage-free deformation, followed by void growth and nucleation inside the primary band of localization, and (iii) direct coalescence (secondary localization) without any prior occurrence of primary localization.
Chapter 2: HosfordCoulomb Model for Predicting Ductile Fracture 39 -0 0* 0 - 0 0 . 0 0 a 0 0 0 0 0 000 * 0 0 0 00 00 0 0 0 0 0 0 00 0 0 a U 0 0 0 0 S0 0 0 00 0 0 0
0L
0 0o
o 0 0 0 0 0 0 0 0 o0 0 00 o 0 0 0 0 0 0 0 0 0 0 0 0 0 00
0
00
0
0
0
0
00
0
0
0
00
00
0
000 00 00 0 0
o 0 0 0(a
0
0
0
o
0
0
0
00
0 00 0 0 00A 4 0(b)
0 o 0 0 0 0 0 0 0 00 0000
0
00
0
0
0
0
0
0
0
0
0
0
00 0 0 0 00 0 0 0a 0 o0 0 0 0 0 0* 0 00
0
0
0 0 60 0 0 00 00 0 0 0o
0 0 0 0 0 0 00 0 0 0 0 0 0 0 0 0 0 00 2 00 0 0 0 00 0 0tFigure 2-1 Eulerian illustration of the ductile fracture process with coalescence through (a) internal necking, and (b) void sheet fracture. The mesoscopic primary band of localization is highlighted in gray color, the microscopic secondary band of localization is highlighted in red
Research on ductile fracture has addressed several aspects of the ductile fracture process. A wealth of literature deals with porous plasticity, i.e. the effective large deformation behavior of mildly porous metals (e.g. Gurson, 1977, Tvergaard, 1981, Mear and
Hutchinson, 1985, Gologanu et al., 1993, Leblond et al., 1995, Benzerga and Besson, 2001, Molinari and Mercier, 2001, Monchiet et al., 2008, Nahshon and Hutchinson, 2008 and Danas and Ponte Castafteda, 2012). The formation of primary bands of localization is
expected to come out naturally when solving boundary value problems with accurate porous plasticity models. In other words, there is no need to introduce any localization criterion. However, the computation of the stress and strain fields after the initiation of localization bands is challenging due to the associated loss of ellipticity of the governing
field equations. The use of non-local formulations (e.g. gradient plasticity) appears to be
- 40 - Chapter 2: Hosford-Coulomb Model for Predicting Ductile Fracture
necessary to regularize the mathematical problem in the post localization regime (e.g.
Anand et al. (2012)).
As an alternative to using highly accurate porous plasticity models, the formation of primary bands of localization can also be predicted using conventional non-porous plasticity models in conjunction with localization criteria. This approach is motivated by the fact that non-porous plasticity models provide an excellent approximation of the multi-axial stress-strain response of metals up to the point of localization (e.g. Dunand and Mohr, 2011 a and Dunand and Mohr, 2011 b). Furthermore, from an engineering perspective, the formation of a primary band of localization is considered as the onset of fracture. Accordingly the engineering literature does not differentiate between fracture initiation models and criteria predicting the formation of primary bands of localization.
Localization analysis with porous plasticity models provides valuable insight into the effect of stress state on the formation of primary bands of localization (e.g. Rudnicki and Rice,
1975 and Rice, 1977). Recent examples are the localization analysis with a band-like defect
in a shear-sensitive Gurson solid (Nahshon and Hutchinson, 2008), and the investigation of the loss of ellipticity and peak load by Danas and Ponte Castafteda (2012) using a homogenization-based porous plasticity model. The main limitation today is the accuracy of the advanced porous plasticity models. The above models are able to capture first order effects, but to the best of the authors' knowledge, the above localization estimates have not yet been utilized to predict the onset of localization in real structures.
Multi-axial experiments provide the only viable alternative to computational localization analysis (e.g. Hancock and Mackenzie, 1976, Mohr and Henn, 2007 and Haltom et al., 2013). Here, the main challenge is the analysis of heterogeneous mechanical fields due to the localization at the structural level (localized necking) which often precedes the
formation of nrimary bands of localization. In particular, the highest strains within a specimen are often reached below the specimen surface. Except for rare cases where