Publisher’s version / Version de l'éditeur:
Journal of Power Sources, 195, pp. 1142-1148, 2010
READ THESE TERMS AND CONDITIONS CAREFULLY BEFORE USING THIS WEBSITE. https://nrc-publications.canada.ca/eng/copyright
Vous avez des questions? Nous pouvons vous aider. Pour communiquer directement avec un auteur, consultez la première page de la revue dans laquelle son article a été publié afin de trouver ses coordonnées. Si vous n’arrivez pas à les repérer, communiquez avec nous à PublicationsArchive-ArchivesPublications@nrc-cnrc.gc.ca.
Questions? Contact the NRC Publications Archive team at
PublicationsArchive-ArchivesPublications@nrc-cnrc.gc.ca. If you wish to email the authors directly, please see the first page of the publication for their contact information.
NRC Publications Archive
Archives des publications du CNRC
This publication could be one of several versions: author’s original, accepted manuscript or the publisher’s version. / La version de cette publication peut être l’une des suivantes : la version prépublication de l’auteur, la version acceptée du manuscrit ou la version de l’éditeur.
For the publisher’s version, please access the DOI link below./ Pour consulter la version de l’éditeur, utilisez le lien DOI ci-dessous.
https://doi.org/10.1016/j.jpowsour.2009.08.070
Access and use of this website and the material on it are subject to the Terms and Conditions set forth at
Effects of open-circuit operation on membrane and catalyst layer
degradation in proton exchange membrane fuel cells
Zhang, Shengsheng; Yuan, Xiao-Zi; Hin, Jason Ng Cheng; Wang, Haijiang;
Wu, Jinfeng; Friedrich, K. Andreas; Schulze, Mathias
https://publications-cnrc.canada.ca/fra/droits
L’accès à ce site Web et l’utilisation de son contenu sont assujettis aux conditions présentées dans le site LISEZ CES CONDITIONS ATTENTIVEMENT AVANT D’UTILISER CE SITE WEB.
NRC Publications Record / Notice d'Archives des publications de CNRC:
https://nrc-publications.canada.ca/eng/view/object/?id=c58a5475-8e79-4594-b709-cfdcfc54d94f
https://publications-cnrc.canada.ca/fra/voir/objet/?id=c58a5475-8e79-4594-b709-cfdcfc54d94f
Contents lists available atScienceDirect
Journal of Power Sources
j o u r n a l h o m e p a g e :w w w . e l s e v i e r . c o m / l o c a t e / j p o w s o u r
Effects of open-circuit operation on membrane and catalyst layer degradation
in proton exchange membrane fuel cells
Shengsheng Zhang
a, Xiao-Zi Yuan
a, Jason Ng Cheng Hin
a, Haijiang Wang
a,∗, Jinfeng Wu
a,
K. Andreas Friedrich
b, Mathias Schulze
baInstitute for Fuel Cell Innovation, National Research Council Canada, 4250 Wesbrook Mall, Vancouver, B.C., Canada V6T 1W5 bInstitute of Technical Thermodynamics, German Aerospace Center, Pfaffenwaldring 38-40, 70569 Stuttgart, Germany
a r t i c l e
i n f o
Article history:
Received 21 July 2009
Received in revised form 21 August 2009 Accepted 25 August 2009
Available online 1 September 2009
Keywords:
PEM fuel cell Membrane Catalyst layer Degradation Open-circuit operation Open circuit voltage
a b s t r a c t
Durability issues have been attracting a great deal of attention in hydrogen/air proton exchange mem-brane (PEM) fuel cell research. In the present work, memmem-brane electrode assembly (MEA) degradation under open circuit (OC) conditions was carried out for more than 250 h. By means of several on-line elec-trochemical measurements, the performance of the fuel cell was analysed at different times during the degradation process. The results indicate that structural changes in the PEM and catalyst layers (CLs) are the main reasons for the decline in performance during OC operation. The results also show that degra-dation due to platinum oxidegra-dation or catalyst contamination can be partially recovered by a subsequent potential cycling process, whereas the same cycling process cannot recover the membrane degradation. Crown Copyright © 2009 Published by Elsevier B.V. All rights reserved.
1. Introduction
Although research and development of the proton exchange membrane (PEM) fuel cell has progressed significantly since the end of the last century, a wide gap still exists between the ideal and the current state-of-the-art lifetimes, which hinders the commercial-ization of this promising technology. In practice, the degradation of fuel cell components in a low-load operating mode is one of the most crucial deterrents that affect a fuel cell’s durability, especially for automotive fuel cell systems. The relevant circumstances, which include open circuit (OC) conditions without electric load and idle conditions with low current density[1], occur frequently over the entire lifetime of a PEM fuel cell.
OC operation has been used as an effective stressor for acceler-ated testing in PEM fuel cell durability studies and several groups have reported the accelerated effects of OC operation on PEM fuel cell degradation[2–5]. It is generally believed that enhanced gas crossover due to PEM deterioration is the major mechanism for OC accelerated degradation. The fluoride emission rate (FER) from effluent water has been considered evidence of PEM degradation, which correlates to losses in both open circuit voltage (OCV) and cell
∗ Corresponding author. Tel.: +1 604 221 3038; fax: +1 604 221 3001.
E-mail address:Haijiang.Wang@nrc-cnrc.gc.ca(H. Wang).
performance[4,6]. Under certain OC operating conditions, mem-brane thinning has also been observed and considered evidence of PEM degradation[2].
Aside from the PEM, the catalyst layer (CL) can also be affected by OC operation. Similar to degradation under other severe conditions, CL degradation under OC operation might include platinum particle agglomeration, carbon weight loss, and Nafion ionomer network deterioration. Another important issue to be investigated under OC operating conditions is the relationship between the degrada-tion of the CL and PEM due to the inseparable interacdegrada-tions between the two. This is especially important at interface areas under high potential and with enhanced gas crossover[7]. However, research has rarely focused on this area.
Given the level of research into degradation under OC con-ditions, further understanding is certainly required, especially regarding the correlation between different causes of degrada-tion. To improve PEM fuel cell durability in the near future, research should focus more on questions like what is the specific mechanism of degradation under different conditions, and what are the recoverability properties under various circumstances? This calls for a detailed investigation, using a variety of diag-nostic tools, into key components of the degradation process and identification of reversible/irreversible degradation under OC conditions.
In the present study, we conducted OC experiments on a 5 cm2
single cell to investigate the influence of an OC condition on PEM
0378-7753/$ – see front matter. Crown Copyright © 2009 Published by Elsevier B.V. All rights reserved. doi:10.1016/j.jpowsour.2009.08.070
and CL degradations. Gas crossover through the membrane, electro-chemical surface area (ECSA), OCV, as well as the cell’s performance and impedance properties, were investigated using several elec-trochemical techniques. We also tested the recovery effects of potential cycling on the decayed membrane electrode assembly (MEA) to identify recoverable and irrecoverable degradations in individual components. In addition, morphological changes in the MEA after degradation were also investigated using an infrared (IR) camera and a scanning electron microscope (SEM).
2. Experimental
The degradation experiment under OC conditions was per-formed using a single cell with an active area of 5 cm2 and a
Teledyne Medusa RD Fuel Cell Test Station. A commercial catalyst coated membrane (CCM) was used with a Pt catalyst loading of 0.4 mg Pt cm−2for both electrodes. The MEA was assembled with
SGL gas diffusion layers (GDLs) on each side of the CCM, and the cell was compressed uniformly under 100 Psi using nitrogen.
Before measurement, the fuel cell was conditioned based on a potential cycling procedure at OCV, 0.6 V and 0.3 V, respectively, for at least 6 h, until no further improvement of cell performance. The cell performance and electrochemical characteristics, mea-sured right after conditioning, were considered the baseline. After a series of baseline measurements, OC operation was performed at a constant flow rate of 100 sccm min−1and 50 sccm min−1for air
and hydrogen, respectively. After the first 25 h and every subse-quent 50 h of OCV degradation, electrochemical characterizations were performed. To assess the cell performance recoverability, two recovery processes of potential cycling were conducted on the cell for 90 cycles, after 206 h of OCV degradation (first recovery) and after 256 h of OCV degradation (second recovery). A single poten-tial cycle consisted of three voltage steps at 0.6 V, 0.3 V, and OCV, with each step lasting 30 s. 2.25 h (90 cycles) of recovery process was chosen in order not to induce further performance decay in addition to OC degradation.
The electrochemical diagnostic tools used in this experi-ment included polarization curve (IV), electrochemical impedance spectroscopy (EIS), cyclic voltammetry (CV), and linear sweep voltammetry (LSV). IV curves were tested at 70◦C under ambient
pressure. Hydrogen and air were humidified at 65◦C to obtain a
rel-ative humidity (RH) of 81% with stoichiometries of 1.5 and 2.5 for hydrogen and air, respectively. Note that all temperature settings for the following tests were the same as just described, to avoid any variation in conditions as much as possible.
A Solartron SI-1260 Impedance/Gain-Phase analyser and a Solartron SI-1287 Electrochemical Interface were used for EIS test-ing at current densities of 100 mA cm−2and 500 mA cm−2over the
frequency range of 10 kHz to 0.1 Hz. To eliminate the influence of flooding on impedance spectra, the electrodes were purged to wash out the accumulated water in the channels and electrodes before each impedance measurement.
In situ CV was performed on the fuel cell using the Solartron SI-1287 Electrochemical Interface to measure the ECSA. To avoid possible degradation from carbon support oxidation induced by high potentials, the cell was cycled between 0.05 V and 0.8 V on the cathode vs. reversible hydrogen electrode (RHE) at a scan rate of 50 mV s−1. The ECSA was calculated based on the catalyst loading
and total charge area of the hydrogen desorption/adsorption peak, integrated from about 0.1 V to 0.4 V (vs. RHE), after subtracting the double layer charge on the cyclic voltammogram.
The gas permeability or crossover through the membrane was assessed using LSV, at 70◦C, to measure the limiting oxidation
cur-rent densities of the crossover hydrogen. For LSV measurement, all the operating conditions for the fuel cell were the same as the CV
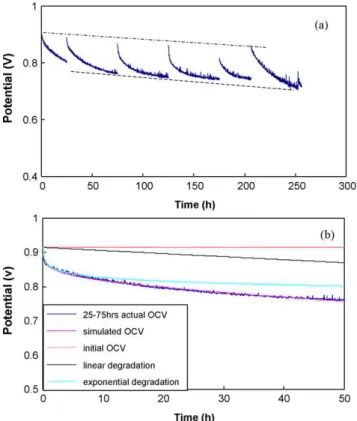
Fig. 1. OCV change with time (a) from 0 h to 256 h and (b) from 25 h to 75 h compared with simulation results based on Eq.(1).
test, except for a linear potential scan from 0 V to 0.5 V (vs. RHE) on the cathode at a scan rate of 5 mV s−1.
Post-analysis was carried out using an IR camera (InfraTech GmbH) after the experiment to detect whether any pinholes were generated. The degraded MEA was removed from the degradation cell and installed in a dummy cell with an open cathode. Hydrogen passed through the anode side at a flow rate of 10 sccm min−1at
room temperature. The IR camera was placed on the cathode side to observe the temperature distribution. This temperature distri-bution demonstrated the level of reactant crossover through the PEM, based on the heat output from the chemical reaction between hydrogen and oxygen in the presence of Pt catalyst. For comparison, the same test was also conducted on a fresh MEA.
Cross-sectional scanning electron microscopy images were taken using a HITACHI S-3500N SEM before and after degradation to identify morphological changes.
3. Results and discussion
3.1. Performance degradation under OC operation 3.1.1. OCV decay
Fig. 1(a) shows the OCV decay trend during the 0–256 h of degra-dation testing. At the beginning of each OCV degradegra-dation session, the potential was relatively high, and then dropped gradually with time. This OCV degradation followed a similar exponential trend at the beginning of each session and then changed to a milder degra-dation mode. After each degradegra-dation session, the OCV was partially recovered in comparison with the ending point of the previous ses-sion. This result coincides with previous OC degradation research [3,4,7], which agreed that OCV degradation during a time period is partially recoverable after an interruption. The decreasing trend of the OCV, shown by the dashed line inFig. 1(a), is obvious dur-ing the entire degradation period. For the last 50 h of OC operation (206–256 h), the OCV decline has a steeper slope, indicating that
severe degradation occurred in the fuel cell during this time period. Based on the shape of the curves inFig. 1(a), OCV degradation can empirically be considered a combination of exponential degra-dation and linear degradegra-dation. The following is the relationship between OCV and time (t):
OCV = C − At − B log(t) (1) where A is a parameter related to linear degradation, B is a param-eter corresponding to exponential degradation, and C is a constant designated by the initial OCV of each session. According to the experimental data, the parameters in Eq. (1)are estimated and listed inTable 1. A typical experimental OCV evolution curve and its simulation curve are compared inFig. 1(b). It can be seen that the simulated data fits the experimental curve very well. The dis-tances from the horizontal line to the linear degradation and to the exponential degradation can be regarded as the linear and exponential contributions to the entire OCV degradation, respec-tively; however, the contributions might be controlled by different degradation modes. It was also observed that, during a continuous OC operation, the contribution from the linear degradation to the OCV degradation was much smaller than that from the exponential degradation, which appeared partially recoverable when a new OC session began.
3.1.2. Cell performance degradation
Fig. 2(a) compares the IV curves before and after each block of OC operation from 0 h to 206 h of degradation. The results show a steadily decreasing trend in cell performance until after 175 h. The curve observed at 206 h of degradation shows a distinct and unusual jump in cell performance. This is the result of an unex-pected shutdown of the test station, during which the long-term nitrogen purge virtually removed the accumulated water, which caused flooding of the channels and the electrodes, and possibly the harmful species from the electrodes, resulting in improved reactant transport within the CLs and therefore, increased perfor-mance. Fortunately, this also demonstrates the performance loss due to flooding can be recovered by nitrogen purge after degrada-tion. The performance, as well as the OCV, increases after 206 h of OCV degradation due to the accidental nitrogen purge, however, it is still much lower than the baseline, with increased activation, ohmic, and concentration losses.
To further show the recovery ability of the fuel cell after lengthy OC operation,Fig. 2(b) compares IV curves before and after the potential cycling recovery tests. It can be seen that after the first recovery potential cycling, both cell performance and OCV recover remarkably compared with that after accidental nitrogen purge. This demonstrates that potential cycling is more effective than nitrogen gas purge for recovering cell performance after OC opera-tion. However, cell performance continues to degrade after another 50 h of OC degradation operated after the first recovery process, as shown inFig. 2(b) (by comparing the performance at 256 h to that at 175 h). Then, cell performance was recovered again after a
sec-Fig. 2. Polarization curves before and after each degradation and recovery sessions (a) within 206 h and (b) after 206 h of OC operation.
ond round of potential cycling, but the result was lower than that of the first recovery.
According to the previous modeling studies the semi-empirical relationship between cell potential E and current density i is assumed to obey the following equation[8]:
E = E0−blog(i) − Ri − m exp(ni) (2) where
E0=Er+blog(i0) (3)
Eris the reversible potential for the cell; i0and b are the exchange
current densities and Tafel slope for oxygen reduction reaction (ORR), respectively; R represents the resistance that causes a linear variation of the cell potential with the current density; m and n are the parameters related to mass transport limitation.
Based on Eq.(2),Fig. 3(a) can be plotted, which demonstrates a perfect fit of the simulated IV curve and the baseline IV curve. The distances from the horizontal line (E0) to the three downward
lines in turn represent the concentration polarization loss, activa-tion polarizaactiva-tion loss, and ohmic loss, respectively. Also based on Eq.(2), these potential losses, at a current density of 600 mA cm−2
and after different degradation periods, can be obtained and plotted inFig. 3(b). It is found that at the beginning of OC operation, the acti-vation polarization and the ohmic losses are quite close, while the
Table 1
Comparison of OCV degradation parameters and cell properties before and after each degradation session and recovery session.
Sessions OCV degradation parameters Hydrogen crossover flux (mol cm−2s−1) ECSA (m2g−1(Pt))
A (V/s) B (V/dec) C (V) Baseline – 1.87 × 10⁻⁸ 37.6 25 h 0.00185 0.02646 0.884692 1.89 × 10⁻⁸ 28.6 75 h 0.0009 0.03549 0.862428 1.99 × 10⁻⁸ 24.4 125 h 0.00026 0.04291 0.833117 2.28 × 10⁻⁸ 21.6 175 h 0.00044 0.04408 0.818515 2.16 × 10⁻⁸ 20.8 206 h 0.0005 0.03037 0.800936 2.49 × 10⁻⁸ 19.9 First recovery – 2.96 × 10⁻⁸ 23 256 h 0.00131 0.0456 0.850396 2.08 × 10⁻⁷ 15.4 Second recovery – 2.41 × 10⁻⁷ 18.1
Fig. 3. Simulated results of (a) the baseline IV curve with different losses marked and (b) different potential losses before and after each degradation and recovery sessions at 600 mA cm−2.
potential loss from concentration polarization is relatively small. As OC operation proceeds, the activation loss increases continu-ously with time until 175 h of OC degradation and decreases at 206 h after nitrogen purge. Then, after a further decrease due to the first potential cycling of recovery, the activation polarization loss increased remarkably when another 50 h of OCV degradation was carried out and decreased again when the second potential cycling of recovery was conducted. This trend proves that long-term OC operation can aggrandize the activation polarization loss for PEM fuel cell reactions, while both nitrogen purge and potential cycling can partially reduce this loss. In addition, among the overall poten-tial loss, the activation polarization loss plays a predominant role during the entire degradation period at the intermediate current densities. The evolution trends for ohmic and concentration losses are relatively stable under the same condition.
3.2. In situ electrochemical diagnosis 3.2.1. LSV
The PEM functions as an electrolyte for transferring protons from the anode to the cathode, as well as a barrier to prevent gas permeation and electron transfer between the anode and the cath-ode. However, gas crossover through the thin Nafion membrane is inevitable during PEM fuel cell operation, especially when no reac-tant is consumed under OC conditions. Several researchers have investigated the permeation of hydrogen and oxygen in order to clarify the gas crossover rate through Nafion membranes in PEM fuel cells[9,10]. The research reveals that the membrane proper-ties (such as composition and thickness) and the environment (such as pressure, temperature, and humidification) are the determining factors in the crossover rate. Hydrogen crossover rates are in the order of a few milliamps to tens of milliamps per square centimetre, while oxygen permeates at about half that rate[10].
It has been proposed that PEM decay is partially caused by peroxy radicals, which originate from hydrogen peroxide (H2O2)
produced on the catalyst surface due to the reaction between
Fig. 4. H2crossover current density change.
hydrogen and oxygen during long-term operation [11]. H2O2 is
known to form readily in a fuel cell environment, whether the cell is under load or not[12]. Since the perfluorinated ionomer is relatively stable against pure H2O2 solution [13], hydroxyl
and/or peroxy radicals, generated from the hydrogen peroxide, are believed to be the direct cause of PEM degradation. The proposed reactions describing this membrane decomposition are as follows [14]:
Rf–CF2COOH +•OH → Rf–CF2• +CO2+H2O (4) Rf–CF2• +•OH → Rf–CF2OH → Rf–COF + HF (5) Rf–COF + H2O → Rf–CF2COOH + HF (6)
More recently, Mittal et al.[15,16]have shown the possibil-ity of an alternate membrane degradation mechanism, in which harmful species other than H2O2are generated on the catalyst
sur-face as a result of H2 and O2 reactions. Although none of these
mechanisms satisfactorily explain PEM degradation, reactant gas crossover, which produces membrane-degrading species in the presence of the catalyst, is essential to understand PEM degradation under OC conditions.
Fig. 4compares the crossover current density measured by LSV after different periods of OC degradation and recovery operation. The calculated hydrogen crossover fluxes, according to the limit-ing current density after each session, are listed inTable 1. It can be observed that the limiting current densities are approximately stable (less than 0.006 A cm−2, which is ca. 3 × 10⁻⁸mol cm−2s−1)
until after the first recovery process. However, after 256 h of OC operation, the current density curve exhibits a significant jump in the limiting current density, as well as a significant linearly increasing current value with increasing potential. These increases indicate a high gas crossover rate and a high internal electronic short circuit between the two electrodes. Although the Nafion elec-trolyte is designed to be an ionic conductor but not an electronic conductor, finite electrical shorts between anode and cathode may occur as a result of electrolyte thinning or pinhole formation [10,17]. Therefore, it can be concluded that severe membrane struc-tural damage occurred during 206–256 h of OC operation, which is responsible for the OCV decrease, and the second recovery process could not mitigate this membrane degradation, as shown by the sustained higher crossover current density inFig. 4.
3.2.2. CV
Aside from gas crossover, OCV is also influenced by mixed poten-tial, resulting from the ORR and the simultaneous platinum surface oxidation reactions[18,19]. As these reactions rely on the catalyst, catalytic activity becomes very important for OC investigations. Commonly, the electrochemical surface area attained from CV mea-surement is used as an indicator of the catalyst’s performance. Although the ECSA value can be underestimated when calculated
Fig. 5. ECSA change before and after each degradation session and recovery session.
from the desorption/adsorption area of the cyclic voltammogram, as it is affected by many operating factors[20–22], it is still effective and convenient for diagnosing catalyst degradation.
The change in the ECSA of the cathode after each degradation session is shown inFig. 5. Specific ECSA values after each session are also listed inTable 1. InFig. 5, a downward ECSA trend can be observed, which accords with the trend from the polarization curves and the estimated activation polarization loss demonstrated inFigs. 2 and 3(b), respectively. During the first 25 h of OC oper-ation, the ECSA experienced the sharpest decrease, due to the high potential under OCV; the rate of decrease then slowed down for the subsequent sessions. This phenomenon was also observed in previous research on catalyst deterioration under accelerated degradation conditions, and could be explained by processes such as dissolution/re-deposition of platinum, corrosion of carbon, and adsorption of impurities[20,23]. It can also be seen that the poten-tial cycling processes after 206 h and 256 h of OC operation are effective in partially recovering the ECSA. This recovery could result from the formation/reduction of platinum surface oxide or the adsorption/desorption of other contaminants caused by potential cycling. Regarding the platinum surface oxide, related reactions may include[22]:
Pt + O2→Pt–O2 (7)
Pt–O2+H++e−→ Pt–HO2 (8) Pt–HO2+Pt → Pt–OH + Pt–O (9) Pt–OH + H+
+e−→Pt + H2O (10) Pt–O + 2H+
+2e−→Pt + H2O (11) These reactions may also be a reasonable cause of the OCV partial recovery after interruptions due to the potential cycling between high and low values. The recoverable part of the OCV degradation is partially explained by the exponential degradation introduced in Eq.(1). The contaminants might be identical to either the harm-ful species generated on the catalyst surface as a result of H2and
O2 reaction[15,16], or the membrane decomposition products.
Recently, Sugawara et al.[1]also reported a water condensation method as an alternative recovery operation for flushing out pos-sible contaminants, and were able to partially recover fuel cell performance decay through flushing of the adsorbing anions gen-erated during OC operation. From this research, it can be deduced that the hazardous species generated on the catalyst sites con-tributed to initiating the PEM degradation, and, conversely, the PEM degradation products also acted as contaminants for the cat-alyst, which proves that the PEM and CL degradation processes contribute to each other during OC operation. Obviously, to attain a deeper understanding of recoverable degradation under OC con-ditions, and the relationship between PEM and CL degradation, further work is still needed.
Fig. 6. Nyquist plots at 100 mA cm−2(a) for 0–206 h of OC operation and (b) after
206 h.
3.2.3. EIS
Fig. 6(a) and (b) illustrates Nyquist plots measured at 100 mA cm−2. During the 0–206 h of the OC operation test, shown
inFig. 6(a), the charge transfer resistance (i.e., the diameter of the arc on the Nyquist plot) increased with degradation time until the unexpected nitrogen purge caused by the accidental test station shutdown. We believe that this charge transfer increase mainly resulted from catalyst degradation. This is also confirmed by the decreased ECSA using CV. Furthermore, in the additional test, shown inFig. 6(b), the charge transfer resistance was observed to only partially recover from potential cycling, which is consistent with the CV results.
Using a typical equivalent circuit (Fig. 7(a)), the equivalent cell elements can be determined from the EIS data. InFig. 7(a), R1
repre-sents the high frequency resistance (HFR), R2represents the charge
transfer resistance, and Cprepresents the charge transfer related
double layer capacitance. A slightly increasing trend of the HFR can
Fig. 8. IR camera images of (a) the fresh MEA and (b) the degraded MEA.
be found after each session of OC operation at current densities of 100 mA cm−2and 500 mA cm−2, as shown inFig. 7(b). This
resis-tance increase arises mostly from structural and interfacial changes in the PEM (e.g., delamination of the layers) during OC operation. For example, the loss of Nafion ionomer during the degradation might decrease the conductivity of the PEM and therefore increase its resistance.
3.3. Post-analysis
According to the images from the IR camera, shown inFig. 8, the average temperature of the decayed MEA (Fig. 8(b)) was about 2.1◦C higher than that of the fresh one (Fig. 8(a)) with no evident
hot spots in the decayed MEA area (the circle in the middle of the image). It can be concluded that no obvious pinholes were gen-erated during the test, since air/hydrogen crossover through the PEM determined the temperature distribution under the dummy cell experimental conditions. However, the temperature increase was not quite even across the entire MEA area, which suggests the presence of a weak area in the PEM after the test. Therefore, it is pos-sible to conclude that fatal degradation due to membrane thinning or potential pinholes occurred during the accelerated degradation test.
SEM images of the cross-sectioned MEA before and after the degradation test are shown inFig. 9. As labelled, the anodes are at
Fig. 9. SEM images of the MEA (a) before and (b) after OC operation.
the top of these images and the light-colored thin layer between the two electrolyte layers is a reinforced layer. Compared with the “fresh” MEA, which has been clamped and conditioned (Fig. 9(a)), the degraded MEA (Fig. 9(b)) displays obvious thinning of the MEA with PEM thickness decrease from 23 m to 16 m at both sides of the reinforced layer. This further confirmed the results obtained using the IR camera. The PEM thinning is a direct reason for the increased hydrogen crossover, which resulted in an unrecoverable decrease of OCV and cell performance. As shown in the circled area ofFig. 9(b), membrane thinning did not occur evenly through-out the MEA. However, the thinning of the catalyst layer is not as significant as expected.
4. Conclusion
Using electrochemical and physical diagnostic tools, specif-ically IV, CV, LSV, EIS, IR camera, and SEM, OCV degradation of a PEM fuel cell was investigated. The results show a pro-nounced decreasing trend for both OCV and cell performance for each session of the OC operation. The OCV decay and cell per-formance degradation can be attributed to membrane thinning (supported by SEM, LSV and IR images) and catalyst agglomer-ation (supported by CV). Cell performance, characterized by IV curves, shows that the kinetics of ORR decreases with time under OC operation and is partially recoverable by nitrogen purge due to improved reactant transport. The unrecoverable degradation was mainly caused by PEM degradation and catalyst agglomeration, whereas the recoverable degradation arose from the accumu-lated water in the channels and the electrodes. Therefore, PEM thinning and CL decay were two primary reasons for perma-nent performance degradation under this accelerated degradation test.
Acknowledgements
The authors acknowledge the NRC-Helmholtz Joint Research Program, the NRC-MOST Joint Research Program, and BCIC’s ICSD Program for their financial support.
References
[1] S. Sugawara, T. Maruyama, Y. Nagahara, S.S. Kocha, K. Shinohra, K. Tsujita, S. Mitsushima, K. Ota, J. Power Sources 187 (2009) 324–331.
[2] H. Xu, R. Borup, E. Brosha, F. Garzon, B. Pivovar, ECS Trans. 6 (2007) 51–62. [3] S. Kundu, M. Fowler, L. Simon, R. Abouatallah, J. Power sources 182 (2008)
254–258.
[4] T.A. Aarhaug, A.M. Svensson, ECS Trans. 3 (2006) 775–780.
[5] A. Ohma, S. Suga, S. Yamamoto, K. Shinohara, J. Electrochem. Soc. 154 (2007) B757–B760.
[6] H.L. Tang, P.K. Shen, S.P. Jiang, F. Wang, M. Pan, J. Power Sources 170 (2007) 85–92.
[7] K. Teranishi, K. Kawata, S. Tsushima, S. Hirai, Electrochem. Solid-State Lett. 9A (2006) 475–477.
[8] J. Kim, S.-M. Lee, S. Srinivasan, J. Electrochem. Soc. 142 (1995) 2670–2674.
[9] T. Sakai, H. Takenaka, N. Wakabayashi, Y. Kawami, E. Torikai, J. Electrochem. Soc. 132 (1985) 1328–1332.
[10] S.S. Kocha, J.D. Yang, J. Yi, AIChE J. 52 (2006) 1916–1924.
[11] D.A. Schiraldi, J. Macromol. Sci. Part C: Polym. Rev. 46 (2006) 315–327. [12] W. Liu, D. Zuckerbrod, J. Electrochem. Soc. 152 (2005) A1165–A1170. [13] A. Tasaka, Y. Iriyama, T. Abe, Z. Ogumi, J. Power Sources 158 (2006) 1222–1228. [14] D.E. Curtin, R.D. Lousenberg, T.J. Henry, P.C. Tangeman, M.E. Tisack, J. Power
Sources 131 (2004) 41–48.
[15] V.O. Mittal, H.R. Kunz, J.M. Fenton, Electrochem. Solid-State Lett. 9 (2006) A299–A302.
[16] V.O. Mittal, H.R. Kunz, J.M. Fenton, J. Electrochem. Soc. 153 (2006) A1755–A1759.
[17] K.R. Cooper, Fuel Cell 8 (2008) 34–35.
[18] J. Zhang, Y. Tang, C. Song, J. Zhang, H. Wang, J. Power Sources 163 (2006) 532–537.
[19] A. Parthasarathy, B. Davé, S. Srinivasan, A.J. Appleby, C.R. Martin, J. Electrochem. Soc. 139 (1992) 1634–1641.
[20] B. Merzougui, S. Swathirajan, J. Electrochem. Soc. 153 (2006) A2220–A2226. [21] R.N. Carter, S.S. Kocha, F.T. Wagner, M. Fay, H.A. Gasteiger, ECS Trans. 11 (2007)
403–410.
[22] H. Xu, R. Kunz, J.M. Fenton, Solid-State Lett. 10 (2007) B1–B5.
[23] R.L. Borup, J.R. Davey, F.H. Garzon, D.L. Wood, M.A. Inbody, J. Power Sources 163 (2006) 76–81.