Dynamics of Biopolymers and Their Hydration Water Studied by
Neutron and X-ray Scattering
by
MASSA0
Xiang-qiang Chu B.S., Nuclear Physics (2002)
Peking University
L
M.S., Nuclear Technology and Applications (2005) Peking University
Submitted to the Department of Nuclear Science and Engineering in Partial Fulfillment of the Requirements for the Degree of
Doctor of Philosophy in Nuclear Science and Engineering at the
Massachusetts Institute of Technology
CHUSETTS INSTITUTE F TECHNOLOGY
EC 0 9 2010
IBRARIES
ARCHIVES
May 2010( 2010 Massachusetts Institute of Technology All rights reserved
Signature of Author...
Certified by ... ...
R ead by ...
Department of Nuclear Science and Engineering May 18, 2010
...
Sow-Hsin Chen Professor Thesis Supervisor ... Sidney Yip ProfessorA
/esis Reader
A ccepted by ...
./ .
...
Jacquelyn
C. Yanch Chairman, Department Committee on Graduate StudentsDynamics of Biopolymers and Their Hydration Water Studied by
Neutron and X-ray Scattering
by
Xiang-qiang Chu
Submitted to the Department of Nuclear Science and Engineering on May 10, 2010, in Partial Fulfillment of the
Requirements for the Degree of
Doctor of Philosophy in Nuclear Science and Engineering
ABSTRACT
Protein functions are intimately related to their dynamics. Moreover, protein hydration water is believed to have significant influence on the dynamics of proteins. One of the evidence is that both protein and its hydration water have the same dynamic transition temperature at around 220 K. This thesis intends to understand the dynamic coupling of biopolymers (mainly proteins) and their hydration water by means of neutron and X-ray scattering.
We first approach this problem by studying the dynamics of hydration water and the dynamics of hydrated proteins respectively.
We study the hydration water dynamics by using elastic neutron scattering
(ENS)
and quasielastic neutron scattering (QENS). We observe a fragile-to-strong crossover phenomenon at the temperature TL in supercooled water confined in substrates with different hydrophilicity and geometry. We find that water confined in hydrophobic double wall carbon nanotubes (DWNT) has a slightly lower TL than that confined in hydrophilic MCM-41-S (a porous silica material). We then observe an interesting phenomenon that TL of water confined in a hydrophobic mesoporous material CMK-1 occurs in-between the abovetwo. Our results indicate that besides the obvious surface effect brought about by the hydrophobic confinements, the value of the crossover temperature is also dependent on the dimensionality of the confinement. This result provides a possible way of understanding the effect of pressure on protein-hydration-water system. The crossover temperature TL can be
used as an indicator of the hydrophilicity of the protein surface.
Meanwhile, we use three different methods to study the protein dynamics in the full time range. We study the protein softness in the long-time a-relaxation region by measuring the mean squared displacement (MSD) using ENS. We then use QENS to study the logarithmic decay of protein dynamics in the mid-time p-relaxation range. In addition, Inelastic X-ray scattering (IXS) is used to study the phonon dispersion relation (short-time dynamics) inside the protein molecules and thus help us to understand the intra-protein collective dynamics.
Finally, the coupled dynamics of the hydration water and the protein is studied. A series of ENS and QENS experiments are performed at different temperatures and pressures in order to investigate this problem. We find that the dynamics of protein follows that of its hydration water and proteins remain soft at lower temperatures under pressure. We also relate this phenomenon to the existence of the second critical point in the hydration water. The comparison of experimental data with computer simulations (MC and MD) elucidates the physical origin of the coupling between the dynamics of protein and its hydration water.
Thesis Supervisor: Sow-Hsin Chen Title: Professor
Acknowledgements
My first and sincere thanks go to my supervisor, Professor Sow-Hsin Chen. Without
his insightful and patient guidance, it is not possible for me to finish any part of the thesis. I am lucky to have such a great PhD supervisor during my five years at MIT. Many thanks go to Professor Sidney Yip and Professor H. Eugene Stanley for their thoughtful advice and wise suggestions during my PhD life. Special thanks to Dr. Eugene Mamontov, for his many help in both experiments and career. I would also like to thank Professor Bilge Yildiz for participating in my thesis committee.
Many thanks to all my collaborators, Professor Piero Baglioni and Dr. Emiliano Fratini at University of Florence, Professor Chung-Yuan Mou and Kao-Hsiang Liu at National Taiwan University, Dr. Alexander Kolesnikov at ORNL, and Professor Giancarlo Franzese at University of Barcelona. I really appreciate them for their contributions to my researches.
I wish to thank Dr. Madhu Sudan Tyagi, Dr. Timothy Jenkins, and Dr. Juscelino B. Leio
at NIST, Dr. Ahmet Alatas, Dr. Ayman Said, Dr. Bogdan M. Leu and Dr. Ercan Alp at Argonne National Laboratory, for their tireless support during my experiments.
Thanks for all my group members, Prof. Li Liu, Dr. Antonio Faraone, Dr. Yun Liu, Dr. Wei-Ren Chen, Dr. Marco Lagi, Dr. Dazhi Liu, Yang Zhang, Chansoo Kim, Wei-Shan Chiang, Mingda Li, Dr. Matteo Broccio, Dr. Jianlan Wu, Prof. Hua Li, and Dr. Cheng-Si Tsao. They are both my collaborators in research and friends in life. They made my life at MIT
enjoyable and unforgettable.
Last but formost, my special thanks go to my family, my husband Tiejun Meng, my parents Hezhen Zhou and Weiguo Chu. I will never finish this thesis without their constant support and love.
This thesis is dedicated to my son, Lincoln Meng, the sweetest gift from god during my PhD life.
Contents
ABSTRACT ... 3
Acknowledgem ents...5
Chapter 1 Introduction...10
1.1 Biological Roles of Hydration W ater ... 10
1.2 Neutron and X-ray Scattering for Studying Dynamics ... ... ... ... 11
1.3 Survey of the Thesis ... 13
Chapter 2 Low Tem perature Dynam ics of Confined W ater ... 15
2.1 Introduction...15
2.2 1-D Hydrophobic Confinement: double-wall carbon nanotubes (DWNT)...18
2.3 2-D Biological Confinem ent: DNA, RNA and Proteins ... 24
2.4 3-D Hydrophobic Confinement: Mesoporous Carbon Material CMK-1 ... 27
2.5 Conclusion...33
Chapter 3 Study of Protein Dynam ics... 36
3.1 Introduction...36
3.2 Long Time ct-D ecay: M easure of M SD and Protein Softness...38
3.2.1 The Concept of Protein Softness ... 38
3.2.2 The Elastic Scan and the M SD of Hydrogen Atom s in Proteins...39
3.3 Mid-Time @-Decay: Logarithmic Decay Studied by QENS... ... 43
3.3.1 Introduction...43
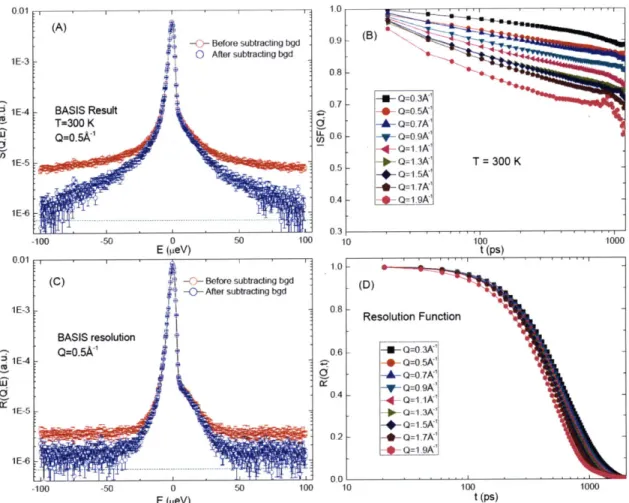
3.3.2 Experiments and D ata Analysis ... 44
3.3.3 Results and Discussions...49
3.4 Short Time Dynamics: Phonon Dispersion Relation Studied by High Resolution Inelastic X-ray Scattering (IXS) ... 52
3.4.1 Introduction...52
3.4.2 Protein Samples and IXS Experim ents ... 53
3.4.3 M odel and D ata Analysis ... 55
3.4.4 Results and Discussion ... 59
3.5 Conclusion...62
Chapter 4 Coupling of Protein and its H ydration W ater ... 64
4.2 The MSD of Hydrogen Atoms in Protein and its Hydration Water ... 65
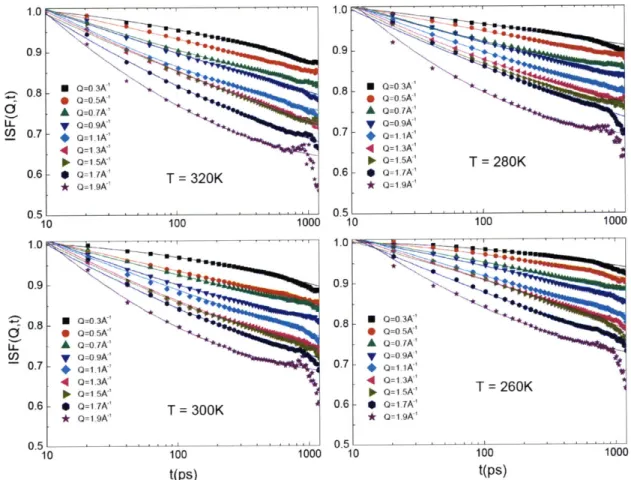
4.3 Dynamics of Protein Hydration Water Analyzed by RCM... ... 67
4.3.1 RCM Analysis of Incoherent Quasi-elastic Scattering Data...67
4.3.2 Relaxation time measurements of hydration water in biopolymers by QENS...74
4.3.3 The relation between dynamic crossover FSC and the crossover in MSD...77
4.4 The Pressure Dependence of Dynamic Crossover in Protein Hydration Water and the Pressure effects on Protein D ynam ics ... ... 78
4.5 Comparison with Computer Simulation Results...84
4.5.1 Com parison with a 2D M odel of W ater...84
4.5.2 Comparison with MD Simulation Results ... 87
4 .6 C o n clu sio n...--- .9 1 Chapter 5 Sum m ary ... . ---... 94
Appendix A Incoherent Neutron Scattering for Studying Dynamics of Water...96
A. 1 Incoherent Elastic Scattering (E = 0 ) ... 97
A .2 Inelastic Scattering (E = hco # 0)... 98
A .3 Incoherent quasielastic scattering (E 0 )... 99
Appendix B Relaxing-Cage Model (RCM) for the Single-Particle Dynamics of Water...100
Appendix C A list of publications...104
C.1 Experimental evidence of fragile-to-strong dynamic crossover in DNA hydration water ... 104
C.2 Observation of a dynamic crossover in water confined in double-wall carbon nanotubes ... 105
C.3 Observation of a dynamic crossover in RNA hydration water which triggers a dynamic transition in the biop olym er...106
C.4 The low-temperature dynamic crossover phenomenon in protein hydration water: Simulations vs exp erim en ts ... 10 7 C.5 Dynamic crossover phenomenon in confined supercooled water and its relation to the existence of a liquid-liquid critical point in w ater ... 108
C.6 Studies of Phononlike Low-Energy Excitations of Protein Molecules by Inelastic X-Ray S catterin g ... 10 9 C.7 Pressure effects in supercooled water: comparison between a 2D model of water and experim ents for surface w ater on a protein ... 110
C.8 Proteins Remain Soft at Lower Temperatures under Pressure ... I11 C.9 Dynamical Coupling between a Globular Protein and its Hydration Water Studied by Neutron Scattering and M D Sim ulation ... 112
C.10 Neutron Scattering Studies of Dynamic Crossover Phenomena in a Coupled System of Biopolym er and Its H ydration W ater...113
C.11 The Dynamic Response FunctionxT(Q,t) of Confined Supercooled Water and its Relation to the D ynam ic Crossover Phenom enon... 114
C.12 Experimental Evidence of Logarithmic Relaxation in Single-particle Dynamics of Hydrated P ro tein M olecules ... 115
C.13 Low Temperature Dynamics of Water Confined in a Hydrophobic Mesoporous Material C M K -1 ... 1 16
Chapter 1
Introduction
1.1 Biological Roles of Hydration Water
To quote a famous American natural science writer Loren Eiseley, "If there is magic on this
planet, it is contained in water" [1]. Considering the numerous physicochemical anomalies of
water and the fundamental role they play in controlling the structure and dynamics of
biopolymers, even if the property of water is not magical it is surely a fascinating subject. While
water has been considered as "life's solvent" (in a passive sense) for a long time, only in the past
20 years has it become an active constituent of cell biochemistry and not just a uniform
background [2].
One of the most striking examples of the importance of water in biosystems is that proteins
cannot perform their functions if they are not covered by a minimum amount of hydration water.
Hydration can be considered as a process, that adding water incrementally to dry protein, until a
level of hydration is reached, beyond which further addition of water produces no change of the
essential properties of the protein but only dilutes the protein [3]. The hydration shell can be
defined as the water associated with the protein at the hydration end point. This shell represents
monolayer coverage of the protein surface. Water outside the monolayer is perturbed to a
significantly small extent, which is typically not detectable by measuring the properties such as
heat capacity, volume or heat content.
Rupley et al. [4] measured the reaction of lysozyme with the hexasaccharide of
where h is the mass ratio of water to dry protein. They showed that the enzymatic activity closely
parallels to the development of surface motion, which is thus responsible for the functionality of
the protein.
Around 220 K, the protein has a transition that could be described as a dynamic transition or
a so-called glass transition [5, 6]. An analogous transition can also be detected in the protein
hydration water at the same temperature. Some IR data collected by Doster et al.[7] suggested
that the transition in the hydration water could be described as the melting of amorphous ice and
this solvent network is composed of water clusters with relatively strong internal bonding. They
used this information to address the problem of dynamic coupling of solvent motions with
internal protein motions, suggesting that the cooperativity of the solvent network provides the
coupling mechanism. However, our recent Quasi-Elastic Neutron Scattering experiments [8]
show that this dynamic crossover in hydration water is the result of a transition from a
predominantly low density form of water at lower temperature (low density liquids, or LDL), a
less fluid state, to a predominantly high density form at higher temperature (high density liquids,
or HDL), a more fluid state, derived from the existence of a second (liquid-liquid) critical point at
an elevated pressure [9].
1.2 Neutron and X-ray Scattering for Studying Dynamics
Neutron scattering offers many advantages for the study of the hydrogen atom dynamics in a
protein and its hydration water. The main reason is that the scattering cross section of hydrogen is
about 80 barns, which is much larger (at least 20 times) than that of other atoms in the
protein-hydration-water system, composed of oxygen, carbon, nitrogen and sulfur atoms.
Furthermore, the neutron scattering cross section of a hydrogen atom is mostly incoherent so that
the neutron scattering spectra reflect, essentially, the self-dynamics of the hydrogen atoms in the
protein or water. The fact that the neutron wave-length (- A) and energy (- geV to meV)
correspond to the inter-atomic distances and the energy of thermal excitations makes it possible to
Therefore, various dynamic processes from vibration to the structural relaxation of protein
molecules and its hydration water can be characterized. Vibration modes appear as distinct inelastic peaks, whereas relaxation processes are represented by a broadened elastic part, the so
called "quasielastic scattering". A detailed description of Incoherent Elastic Neutron Scattering
(ENS), Quasielastic Neutron Scattering (QENS) and Inelastic Neutron Scattering (INS) methods
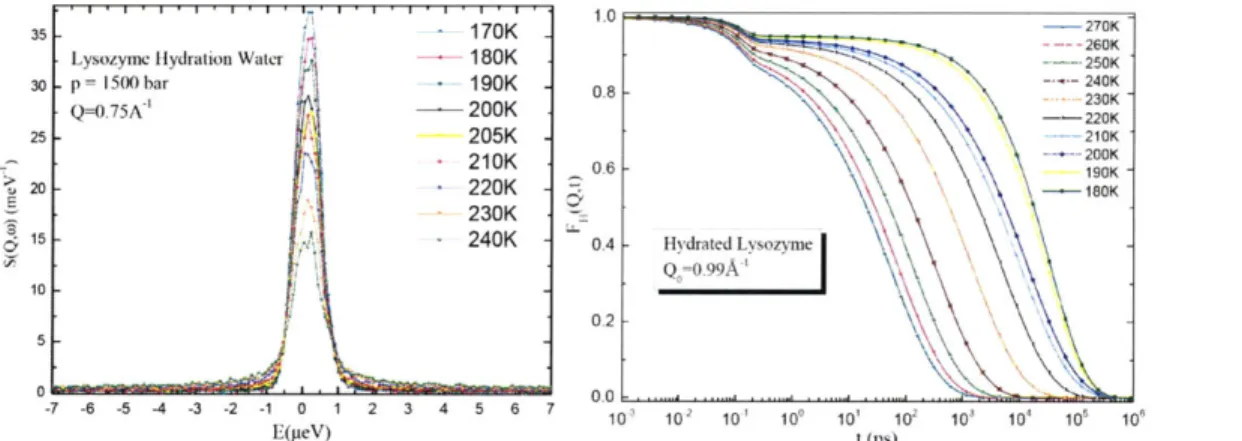
are presented in Appendix A. Figure 1.1 shows a typical series of spectra of QENS and their
Fourier transform in the time domain, which is called the intermediate scattering function (ISF).
We can clearly observe a two-step relaxation process in the ISF. Thus QENS provides a possible
way to study the slow relaxational dynamics both in protein and its hydration water.
35 . 170K .270K
-- 260K
Lysozyme Hydration Water --- 180K 250K
30 p = 1500 bar 190K Q=0.75A' - 200K 220K 25 205K 210K 210K 0.6 200K > 190K 20 220K I 230K 15 240K 0.4 Hydrated Lsozyme 10 0.2 0 -60.0 -7 -6-5-4 -3 -2 -10 1 2 3 4 5 6 7 1010, 101 101 101 101 101 101 10, 101 10, E(peV) t (PS)
Figure 1.1 A typical series of quasielastic neutron scattering spectra (left) and their Fourier transform in the time domainl intermediate scattering function (1SF) (right). The spectra are taken from a backscattering spectrometer HFBS.
The high resolution inelastic X-ray scattering (IXS) is a relatively new scattering technique.
From some point of view, IXS has'some properties in common with QENS. The scattering peaks look similar. In both methods, we study the dynamic process by analyzing the broadened part of the peak. The difference is that, IXS is used to study the collective motions of atoms, such as the phonon dispersion relation, due to the excellent coherence of X-rays. In addition, X-ray is totally not sensitive to hydrogen atoms. Thus in this thesis, we combine both methods to study the dynamic properties of protein and its hydration water.
1.3 Survey of the Thesis
This thesis summarizes my research work during the past five years at MIT. The goal of my
research is to understand the coupling of biopolymers (mainly proteins) and their hydration water
in the aspect of dynamics. I first approach this problem by studying the dynamics of confined
water (Chapter 2) and the dynamics of hydrated proteins (Chapter 3) respectively. In Chapter 4,
the coupled dynamics of water and biopolymers is studied. In order to investigate this problem,
we perform a series of neutron scattering experiments as a function of temperature at different
pressures. The comparison of experimental data with computer simulations (MC and MD) is also
Chapter 2
Low Temperature Dynamics of Confined
Water
2.1 Introduction
Bulk water shows many anomalous behaviors, especially in the supercooled temperature range
(below 0 'C): an anomalous increase of thermodynamic response functions and an apparent
divergent behavior of transport coefficients, towards a singular temperature T,= 228 K[10]. With
an increasing super-cooling the structural relaxation time of water shows a steeper temperature
dependence compared to the Arrhenius law. This behavior is known as a characteristic of a fragile
liquid. It is known that many glass forming liquids exhibit the fragile behavior at moderately
supercooled temperatures and then at sufficiently low temperature make a crossover transition to
a strong (Arrhenius) liquid [11]. Water is supposed to have a glass transition temperature at Tg= 165 K [12]. Unfortunately for bulk water, the observation of the fragile to strong dynamic
crossover transition, as well as the experimental study of the water behavior around the possible
second critical point are impossible due to the intervention of the homogeneous nucleation
phenomenon. It starts at TH = 235 K, resulting in crystallization to form a hexagonal ice before it
reaches the supercooled range of interest. It was predicted[13] that water should also show the
transition to a strong liquid in this inaccessible temperature range, around TL = 228 K.
To produce supercooled water, people reduced the nucleating impurities and reduced the size
smallest and purest water droplet still crystallizes at a low enough temperature due to the entropy
fluctuation. This is called the "homogeneous nucleation". Homogenous nucleation temperature
depends on the size of the water droplet. The low limit people ever reached was about 230 K with
the smallest droplet diameter of 1 micron [15]. To suppress this limit, we use confining materials
to confine water in nano-geometry to avoid crystallization. In the next part of this chapter,
supercooled water confined in different geometries is studied by QENS.
The QENS measurement gives the self-dynamic structure factor SH(Q, co) of the hydrogen atom
in a typical water molecule convolved with the energy resolution function of the instrument (See
Appendix A for details). The SH(Q, co) is a Fourier transform of the Intermediate Scattering
Function (ISF) FH(Qt) of the hydrogen atom of the confined water molecule. The Q-independent
average translational relaxation time <rT> is obtained from the QENS data by fitting them with
the Relaxing Cage Model (RCM)[16].
H42
04 0.
H41 Figure 2.1 A schematic diagram of RCM. A water molecule is trapped inside the cage formed by its
S-
- -
----
o0---
~ neighbor molecules. Hol Hi2 H3i 01 03 Hv2The RCM was developed by our group to describe the translational and rotational dynamics of
a typical water molecule at supercooled temperature. On lowering the temperature below the
freezing point, around a given water molecule, there is a tendency to form a hydrogen-bonded,
tetrahedrally coordinated first and second neighbor shells (cage, see Figure 2.1). At short times,
less than 0.05 ps, the center of mass of a water molecule performs vibrations inside the cage. At
long times, longer than 1.0 ps, the cage eventually relaxes and the trapped particle can migrate
through the rearrangement of a large number of particles surrounding it. Therefore, there is a
strong coupling between the single particle motion and the density fluctuations of the fluid. The
short-time translational dynamics of the tagged (or the trapped) water molecule can be treated
approximately as the motion of the center of mass in an isotropic harmonic potential well,
provided by the mean field generated by its neighbors (See Appendix B for details).
By analyzing the QENS spectra using RCM, we are able to calculate the self-intermediate
scattering function FH(Qt) (ISF) of the typical hydrogen atom in water molecules. From the
ISF we then construct the so-called dynamic response function XT(Qt). The dynamic response
function %T(Q,t), or sometimes called the dynamic susceptibility, is defined in analogy with
the thermodynamic response functions such as the specific heat and thermal expansion
coefficient, which are the temperature derivatives of the thermodynamic state functions, such
as the entropy S or specific volume v. In order to describe the dynamic response of a system
to an external perturbation AT, we can take the derivates of the time-dependent state functions,
such as the single-particle density correlation function FH(Q,t) which is called ISF in this
thesis. XT(Q,t) is one of the family of dynamic response functions and it is defined as the derivative of FH(Q,t) with respect to temperature Tat constant pressure, namely,
XT(Q,t) = -( 07 )P (2.1)
%T(Q,t) is the linear response of the system to a small perturbing external field, in this case the
temperature change AT. The %T(Q,t) generally shows a single peak when plotted as a function
of time at constant
Q.
The peak position occurs at around the Q-dependent translational relaxation time T(Q,T)[17] containing in the exponent of ISF. The height of the peak isproportional to the dynamic correlation length [18]. Experimentally, XT(Q,t) is a quantity
which is much easier to measure, compared with the genuine multipoint correlator, the
four-point dynamic susceptibility X4(Q,t), which is commonly used to quantify the dynamic
heterogeneity [18]. However, the two susceptibilities are related to each other by the
fluctuation-dissipation theorem, since x4(Q,t) measures the spontaneous fluctuations and
2.2 1-D
Hydrophobic Confinement: double-wall
carbon
nanotubes (DWNT)
Carbon nanotubes (CN) of nanometer diameter and micrometer length, besides many other
interesting properties, can serve as a quasi-one-dimensional confinement for other materials. Due
to hydrophobic interaction of water with carbon atoms, CN can play a very important role in
studying the properties of confined water. Owing to very weak van der Waals type interaction of
water molecules with carbon [22] compared to a hydrogen bond interaction between water
molecules, water confined in small diameter CN can be considered as quasi-one-dimensional
water cluster.
MD simulations [23-33] and recent experimental studies [27, 34-38] were dedicated to
understand the structure and dynamics of water in single wall carbon nanotubes (SWNT). The
behavior of water in small diameter SWNT cannot be continuously scaled by the nanotube
diameters. Water cannot enter SWNT at all for nanotubes of diameter smaller than 8
A.
Water in (6,6) SWNT (8A
diameter) can enter the nanotube as a small file (or chain) of water molecules and fast transfer through the nanotubes, as was shown by MD simulations [23]. Neutronscattering study of water in (10,10) SWNT (-14
A
diameter) revealed an anomalously soft dynamics [27]. MD simulations [27, 28] proposed the structure of the nanotube water at lowtemperatures as a square-ice sheet wrapped into a cylinder inside the SWNT and the interior
water molecules in a chainlike configuration. A drastic decrease in hydrogen-bond connectivity of
the central water-chain (<2) gives rise to anomalously enhanced thermal motions of water protons.
For (9,9) SWNT with smaller diameter (-12
A)
there should be only the cylinder of water molecules inside nanotube [28], while for (12,12) SWNT of larger diameter (-16A)
water at low temperatures assembles two interconnected cylinders (one into another) with continuoushydrogen bonded structure [29, 30]. Thus water in nanotubes of 16
A
and larger diameter exhibits more uniform structure.nanotubes (DWNT) of 16
A
inner diameter showed a fragile to strong liquid transition for water in SWNT at TL= 218 K, while only fragile behavior for water in DWNT in the temperature rangestudied down to 190 K [34]. Here we extend QENS measurements on water in DWNT of 16
A
inner diameter to lower temperatures and show that water in this confinement exhibits the fragileto strong dynamic crossover at even lower temperature, 190 K.
The DWNT material was synthesized by chemical vapor deposition technique. The
subsequent purification with hydrochloric acid was followed by the oxidation of non-tube carbon
components in air at 300-600*C. These preparation and purification steps produced
micrometer-long nanotubes of a high purity, that is, with low metal catalyst content and low
non-tube carbon content. The nanotube ends were opened by exposing the purified material to air
at 420'C for about 30 min. The samples were characterized by transmission electron microscopy
(TEM) and small-angle neutron diffraction. The (0,1) reflection of the two-dimensional
hexagonal lattice of the bundle was evident in the diffraction data. The mean inner and outer
diameters of the DWNT were 16 : 3 and 23 ± 3 A, respectively. The water absorption was controlled by the following procedure: a mixture of de-ionized water and the DWNT was
equilibrated for 2 h in an enclosed volume at 1 10 C; excess water was then evaporated at 35'C
until reaching the targeted water mass fraction. In the present work 3.2 g of DWNT sample was
loaded with 12 wt.% of water. Hydrated nanotubes were placed in vacuum sealed thin annular
aluminum sample holder chosen to ensure greater than 90% neutron beam transmission through
the samples in order to minimize the effects due to multiple scattering. The sample was mounted
onto the cold stage of a closed-cycle refrigerator, with the temperature being controlled within
±0.1 K. QENS experiments were performed using the high flux backscattering spectrometer [39]
(HFBS) at the National Institute of Standards and Technology. The instrument was operated with
a dynamic range of ±11 pteV, providing an energy resolution of 0.8 geV, full width at half
maximum. The measurements were performed between 150 and 250 K in 10 degrees steps and at
5 K. The spectra obtained at 5 K were used as the resolution functions.
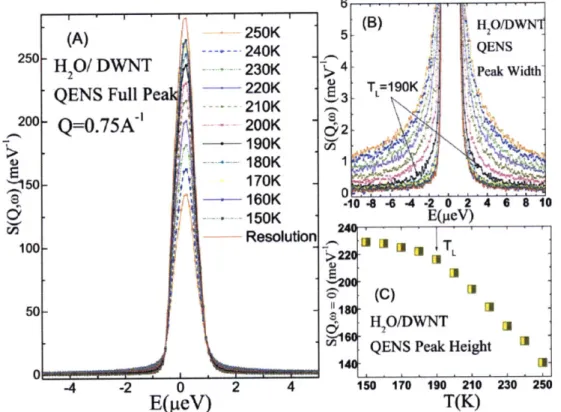
K, visible from the inspection of temperature variation of the quasielastic peak height and width.
However, a much sharper definition of this dynamic crossover temperature TL can be obtained
from the RCM analysis of the normalized quasielastic peak. 6 (B3) HH2/0/ WN
(A)
-250K 5-S240K *,QENS 250H /WN
240K -"-QENS
Full Pe - 20K T 190K: it -- 210K 200-Q=0.75A~'
200K 190K -B/180K
50 -1200K2 190K 160K .104 4 -4 -2 0 2 4 4 i10 C. 150K E(peV) 100Resolution
U*fI
1 I I 2 L 6' (C) 50 - 1 -- H20/DWNTQENS Peak Height m
-4 -2 0 2 4 150 170 190 210 230 250
E(pteV)
T(K)
Figure 2.2 Measured QENS spectra of water confined in DWNT at various temperatures T.
(A) Normalized QENS spectra at
Q
= 0.75A'.
(B) Wings of the peaks, from which we extract the average relaxation time <rr> by fitting with RCM. (C) T dependence of the peak heights, which is related to the MSD of the H atoms of the confined water through the Debye-Waller factor. Both peak widths and peak heights indicate qualitatively the existence of a crossover temperature TL for the confined water.Figure 2.3 compares the log< rT> vs. 1/T plots of water confined in two different materials,
DWNT and MCM-41 [40]. The MCM-41 is a hydrophilic silica material with nano-sized
cylindrical pores. In panel (A), at temperatures above 190 K, <T> obeys a
Vogel-Fulcher-Tammann (VFT) law, namely, (rT) = To exp[DT /(T - To)] , where D is a
dimensionless parameter providing the measure of fragility and To is the ideal glass transition
temperature. Below 190 K, the < rT> switches over to an Arrhenius behavior, which
is (rT) = ro exp(EA / RT), where EA, is the activation energy for the relaxation process and R is the
. ... ... ...
gas constant. This dynamic crossover from the super-Arrhenius (the VFT law) to the Arrhenius
behaviors sharply defines the crossover temperature to be TL = 190 K, much more accurately than
that indicated by temperature variation of the peak heights and peak widths, shown in Figure 2.2.
In panels B 1 and B2 we show the same analyses of water confined in MCM-41 with two different
pore sizes studied by Fraone et al. [40] for comparison. Note that the crossover temperature in the
case of MCM-41 is 224 ± 2 K. From the results shown in the upper and lower panels, we estimate
that the water confined in a hydrophobic substrate (DWNT) has a lower dynamic crossover
temperature by ATL ~ 35K, as compare to that in a hydrophilic substrate (MCM-41-S).
T(K) 250 240 230 220 210 200 190 180 170
(A) TL K
Figure 2.3 Comparison of the FSC
O'- of water confined in DWNT and
^ E=2.63 kcal/mol MCM-41. (A) Extracted <T>
Hydrated DWNT from fitting of the quasielastic
1 Exp. resuit spectra of water confined in
- - - - Arhenaus law
-- VFT law DWNT (inner diameter 16 A) by
RCM plotted in a log scale against
0.80 0,65 0.70 075 0.80 01 IT. Panels (B 1) and (B2) show the
T0FT, T,=146 K results of supercooled water
T (KJ 33o 2W T..225 K 200 300 5o confined w a2t in porous silica material
0 1 a -A pore size 14 A pore size MCM-41 -S with two different pore
/T.sizes, which show that the
crossover temperature TL is
Arrhenius . Arrhenis insensitive to confinement pore
sizes.
0.5 0.8 0.7 0.9 0. 10 0.8 0.7 OA
One can also detect a dynamic crossover phenomenon in terms of the sudden change of the
slope in the plot of mean-squared atomic displacement (MSD) of the confined water
molecule,
(x1
20),
as a function of temperature. The calculation of MSD will be described in details in Chapter 3. In Figure 2.4, we show the MSD measured in the observation time intervalof about 2 ns (corresponding to the energy resolution of 0.8 geV). The slope changes at around
190 K, in agreement with the Arrhenius plot of the u-relaxation time in Figure 2.3 (A).
8 6 104 .' A
Hydrated DWNT
A M QENS result V Arrhenius law ---- VFTlaw 103~RO xH -0 60 80 100 120 140 160 180 200 220 240 260 280T(K)
Figure 2.4 Comparison of the thermal dynamic crossover shown by MSD and the FSC shown by relaxation time <rT>for water confined in DWNT.
In Figures 2.5 and 2.6, we re-examine the previously obtained ISF at
Q
= 0.87A'
(Upper panel of Figure 2.5) and construct the temperature dependence of XT(Q, t) (Lower panel of Figure 2.5).In this way, we determine the crossover temperature TL to occur at 205 ± 5K (black dotted curve).
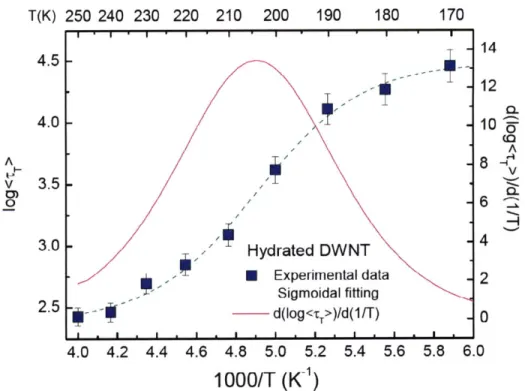
In Figure 2.6, we show the Arrhenius plot of log(T) vs. l/T extracted from RCM analysis. In the
same figure, we also show the maximum of the slope occurring at 205 ± 5K. This model
independent determination of the crossover temperature TL seems to give a higher value than the
previous analysis shown in Figures 2.3 and 2.4. But it is closer to the case we obtained in SWNT
... .. ... ... ... ... ... .. .... ... . ... ...
(218K) [34]. In section 2.4, we will further compare this result with water confined in other substrates. 1.0 0.8 0.6 0.2 0.0 -10-4 10~3 10- 10-1 100 101 102 103 104 105 106 0.020 -Z 24UK- ----230K- 220K-0.015 - ~* ~21OK-, --- -- 200K-- 200K--190K200K-- -190K-...-+-. 180K-0.010 - --+-.- 170K- 160K-- 160K--150K160K-- 150K0.005 -0.000 10~3 10-2 10-, 10" 10' 102 t (ps) 103 104 105 10*
Figure 2.5 Upper Panel: Intermediate Scattering Functions of water confined in DWNT, extracted from analysis of QENS data using the relaxing cage model. We show here the specific case at
Q
=0.87
A
for 11 temperatures, ranging from 150 K to 250 K. Lower Panel: Dynamic response functionXT(Q, t), computed from the ISF shown in the upper panel of this figure. The peak height of this
quantity increases as temperature is lowered toward TL = 205 ± 5K (black dashed line), and decreases when T is further decreased.
T(K) 250 240 230 220 210 200 190 180 170 II.|"I."I.'I*'I*'I* ' I ' I -14
4.5
-I
-12
-' 0. 4.0 10 'L A A 8 v 3.5 0) _o ,-.-.6 6 3.0 -* ,-' Hydrated DWNT - Experimental data 2 Sigmoidal fitting 2.5 - d(log<,r>)/d(1/T) - 0 4.0 4.2 4.4 4.6 4.8 5.0 5.2 5.4 5.6 5.8 6.01000/T (K1
)
Figure 2.6 Arrhenius Plot of the average translational relaxation time <rT> of water confined in DWNT, extracted from analysis of QENS spectra with the relaxing cage model. The pink line is the derivative of this curve, dlog(<rT>)/d(1/T). It shows a peak at the dynamic crossover temperature TL 205 ± 5K, agreeing with the estimate based on
,;{Q,
t), namely, between 200 and 210 K.2.3 2-D Biological Confinement: DNA, RNA and Proteins
The surfaces of biopolymers provide a 2-D confinement of water. The surface water, which is
usually called the hydration water, is approximately the first layer of water molecules that
interacts with the solvent-exposed protein atoms of different chemical character, feels the
topology and roughness of the protein surface, and exhibits slow dynamics. We perform a series
of experiments on different hydrated biopolymers at ambient pressure during the past several
years. We measured the average translational a-relaxation time (rT) of the hydration water
molecules by QENS and found that this dynamic crossover in hydration water occurs at a
universal temperature TL = 225±5 K in three bio-molecules - lysozyme protein [8], B-DNA
[41] and RNA [42], and can be described as a fragile-to-strong dynamic crossover (FSC) [13].
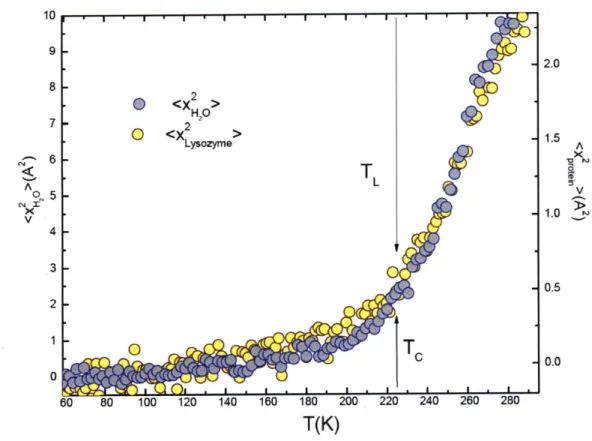
Thus we have shown that TD ~ TL at ambient pressure. Figure 2.7 shows the MSD of the three
biopolymers and their hydration water in the form of scaled plots. From these plots we can see
nicely the synchronization of TD(the glass transition temperature of the biopolymer) and TL (the dynamic crossover temperature of the hydration water). Figure 2.8 shows the determination of
the dynamic crossover temperatures in the hydration water of the three biopolymers using the
Arrhenius plots of average translational relaxation time <rT> vs. 1/T.
10
(A)
2 Figure 2.7 Each panel shows theSH20 temperature dependence of the
2
6< <X > A MSD of hydrogen atoms in both
A6 Lysozyme x
0 . the biopolymer and its hydration
XT L
v 4 - L- water, respectively. It shows
evidence that the crossover
2 - temperatures of the two systems,
TD- 0 the biopolymer and its hydration
0 D 1water, are closely synchronized.
(B)
6 (A): MSD of hydrated lysozyme;15- <X2 (B): MSD of the hydrated B-DNA;
H20 (C): MSD of the hydrated RNA.
A 2 4 A The arrow signs indicate the
0 - approximate positions of the
X T V crossover temperature in both the
VL
2 biopolymer (TD) and its hydration water (TL). Note that the scale on
T -the left hand side is for MSD of
0 the hydration water and that on the
3 right hand side is for the
2H<X > biopolymer. 6' 0 <X 2> -2 RNA A 4-1-4T > A LV 0-0 -0 60 80 100 120 140 160 180 200 220 240 260 280
T(K)
.. ... -... ... .... .. ... ... .. .. ... .... . .. ...U) V 2 10 0.6 T(K) 280 270 TO/T, To=176 K 260 250 240 230 220 210
(B) DNA
T
=222
K
E =3.48 kcal/mol 65 0.70 0.75 0.80 0.85 0.90 T0/T, To=186 K 0.80 0.85 0.90 0.95 1.00 TJ/T, T,=183.3 KFigure 2.8 The extracted <ry > from fitting of QENS spectra by RCM plotted in the log scale vs. I/T. Panels (A), (B), and (C) show clearly well defined cusp-like dynamic crossover behavior in each case. The dashed line represents fitted curves using the VFT law, while the solid line is the fitting according to the Arrhenius law. FSC temperatures are respectively, (A) 220 K, hydration water in lysozyme; (B) 222 K, hydration water in DNA; and (C) 220 K, hydration water in RNA.
All three temperatures are essentially the same within the experimental error of 5 K suggesting universality
of TL in hydration water of all
biopolymers.
10
510
4
A V . . ... . ..... ... ... ..... ... ... ...2.4 3-D Hydrophobic Confinement: Mesoporous
Carbon
Material CMK-1
QENS
experiments on water in single-wall carbon nanotubes (SWNT)[34] and double-wall carbon nanotubes (DWNT)[43] showed TL = 218 K and 190 K respectively. In order toinvestigate further into this difference in the dynamic crossover temperature, we study the
dynamics of water confined in a hydrophobic mesoporous material CMK-1 by a direct
analysis of the incoherent neutron scattering (QENS) spectra using RCM. Although a recent
literature[44] provides evidence that there might be a hydrophobic-hydrophilic transition
under some specific temperature, the hydrophilicity of the sample does not change in our
measurement range.We analyze the ISF FH(Q,t) of hydrogen atoms in the confined water and
observe that the peak height of
Xr(Q,t)
for supercooled water increases as T approaches the dynamic crossover temperature TL, indicating the growth of the dynamic correlation length.But below TL the peak height decreases due to the onset of the dynamic crossover [19]. In
addition, we compare the crossover temperature of water confined in CMK-1 with the water
confined in DWNT and MCM-41 by using a model-independent analysis method. This
method is an unbiased and a more reliable determination of the crossover temperature, by
taking the slope of the average translational relaxation time <TT> in its Arrhenius plot. We
numerically calculate the quantity d(log<rT>)/d(1/T) from the Arrhenius plot and determine
the crossover temperature TL from the position of the maximum slope[19]. Our result
provides the evidence that besides the obvious surface effect brought about by the
hydrophobic confinements, the value of the crossover temperature is also dependent on the
geometry of the confinement.
The ordered mesoporous carbon CMK-1[45] was synthesized according to the method of
Ryoo et al. In brief, it was made by sulfuric acid dehydration of loaded sucrose inside the
pores of MCM-48 mesoporous silica (cubic, Ia3d symmetry, consisting of two disconnected
The only difference is that the MCM-48-S was used as template [46]; so that a much smaller
pore size (BJH pore size 14
A,
compared to regular CMK-1, which has a pore size around 30A)
can be made. Since CMK-1-14 is composed of amorphous carbon, its surface is uniformly hydrophobic, but not too hydrophobic to be hydrated.,800 700 600 c)500 0 -~400 E 300 > 200 100 2.5
l
-2.5 -5.0 -15 (A) * AdsorptionDesorption
0.08 0-07 - 006 -E 0.05 a) 0.04'0 003 o2 10 15 20 25 30 35 40 Pore diameter (A)0.0 0.2 0.4 0.6 0.8 1.0
Relative Pressure (P/P
0)
-100 -50
Temperature (0C)
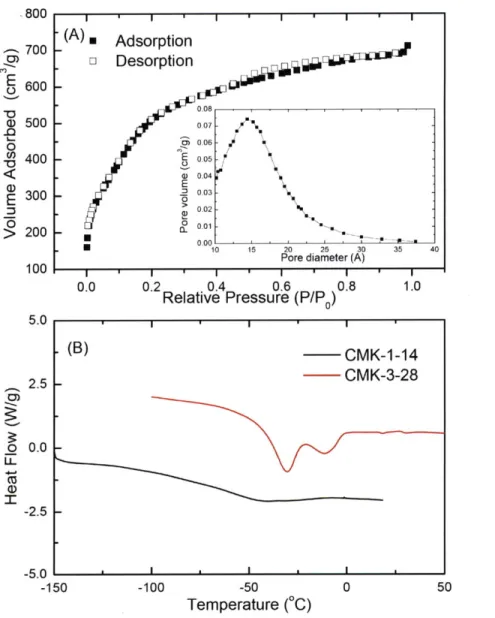
Figure 2.9 (A)The nitrogen adsorption/desorption isotherm of CMK-1-14. (inset: pore size distribution plot) (B) The Differential scanning calorimetry (DSC) results of CMK-1-14 and CMK-3-28, which are taken from 123 K to 323 K with the heating rate of 10 K/min.
Figure 2.9 (A) shows the nitrogen adsorption/desorption isotherm of CMK-1-14. With the
Barret-Joyner-Halenda (BJH) analysis, one can obtain the pore volume and the pore diameter as
(B)
CMK-1-14
CMK-3-28
* I * I ' I ... - - m-n- : ... .... .... - .. .. .. ... . ... ... i 00.84 cm3/g and 14 A, respectively. Thermogravimetry analysis (TGA) of hydrated CMK-1-14
shows a 45% weight loss, which means the hydration level is at about 98%. Figure 2.9(B) shows
the comparison of the differential scanning calorimetry (DSC) result of CMK-1-14 with another
mesoporous carbon material CMK-3-28. The template of CMK-3-28 is SBA-15, instead of
MCM-48 for CMK-1-14, so the pore structure is 2D hexagonal and the pore size is 28
A.
One can see that there are two melting peaks in CMK-3-28, which shows the freezing of water in largerpores. Since there is no obvious melting peak down to 150 K, we believe that the water inside
CMK-1-14 does not freeze.
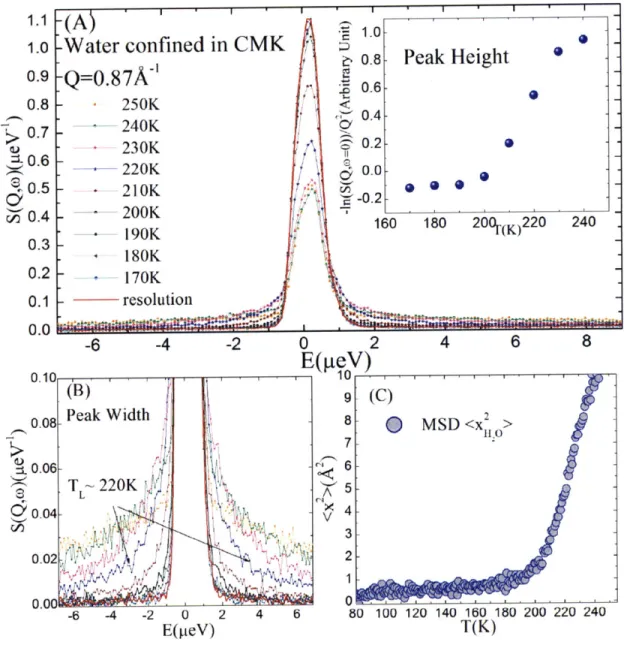
In Figure 2.10 (A) and (B), we plot a set of raw data directly taken from QENS
measurements as a function of temperature. Panel (B) shows an enlarged view of the peak
wing part in panel (A). It is visible from the inspection of temperature variation of the
quasielastic peak height and width that there is some kind of crossover at around 200~220 K.
In panel (C) we show the mean-squared atomic displacement (MSD) of the confined water
molecule,
(x1
2
)
in the observational time interval about 2 ns (corresponding to the energy resolution of 0.8 geV). One can observe a sudden change of the slope at around 200 K. Thistemperature is about 25 K lower than the one we recently observed from the MSD of
Lysozyme hydration water [47] and the one we obtained from the MSD of water confined in
MCM-41-S [48]. On the other hand, it is 10 K higher than what we observed in the MSD of
water confined in DWNT[43]. All these raw data sets without any fitting at different
temperatures show clearly that a crossover takes place at about 200~220K. However, a much
sharper definition of this dynamic crossover temperature TL can be obtained from the RCM
1.1
(A)
1.0
Water confined in CMK
*
0.8Peak Height
0.9
Q=0.87A'
Z 0-6.
0.8
250K
CI' 0.40.7
240K
-230K
S 0.20.6 -
220K
/
> 0.0
0.5-
210K -0.2n0.4
200K--
160180
2 2240
190K()
0.3-180K
0.2 170K 0.1 resolution 0.0-6
-4
-2
0
2
4
6
8
E(pteV) 0.10 ,109 (C)
0.08 Peak Width (D MSD<X2 > 7-S0.06-
6T - 220K
}{ 50 -0.04- 4 0.02 2 0.00 2 -6 -4 -2 0 2 4 6 80 100 120 140 160 180 200220240E(peV)
T(K)
Figure 2.10 (A) Normalized QENS spectra at a series of temperatures at
Q
= 0.75A~1. Insetrepresents the T dependence of the peak heights. We took the logarithm of the peak heights so that it is linearly related to the MSD of the H atoms. (B) The wings of the peaks, from which we extract the average translational relaxation time <-rT> by fitting with RCM. (C) MSD of the hydrogen atoms,
(xh2), extracted from the Debye-Waller factor measured by elastic neutron scattering.
... ... ...
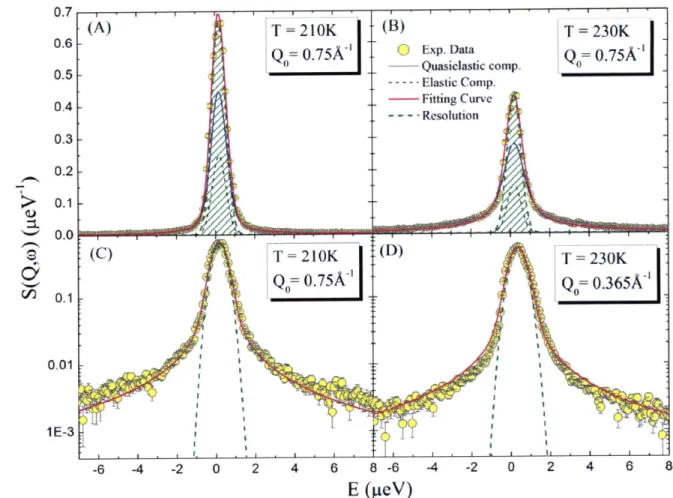
0.6 0 Exp. Data
0.5 - - Quasiclastic comp. Elastic Comp.
0
75K'
0.4 -- Fitting Curve - -- Resolution 0.3 0.2 > 0.1 0.0 -6 -4 -2 0 2 4 6 8 -6 -4 -2 0 2 4 6 8
E (peV)
Figure 2.11 RCM analysis of QENS spectra taken at two typical temperatures T 210K (A,C), 230K (B,D) at
Q
= 0.75A and 0.365A-'. The circles are the measured neutron intensity as a function of the energy transfer E. Panels (A) and (B) are plotted in linear scale and panels (C) and (D) are plotted in logarithm scale. The red line represents the fitted curve using the RCM model. The green dashed line is theQ-dependent
instrumental resolution function. The blue line is the quasi-elastic scattering component. Error bars throughout the paper represent standard deviation. These figures show that the quality of fitting is good enough for our purpose.Figure 2.11 illustrates the process of the RCM analysis. It is shown that the RCM analysis
agrees with the measured
QENS
data satisfactorily. The comparison was made of the data taken from temperaturesjust above and below the crossover temperature
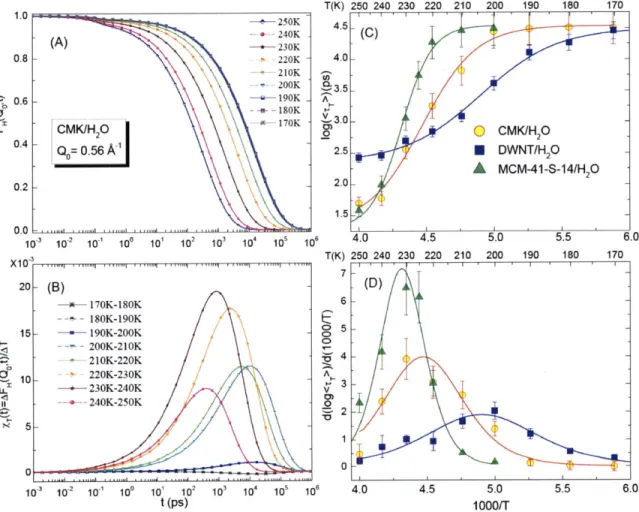
TL-In Figure 2.12 (A) we show the ISF calculated by Eqs. (B.6) and (B.7) from the fitting
parameters
/Jro
and yat several temperatures of the water confined in CMK-1 as a function of time. Figure 2.12 (B) shows a series of dynamic response functions calculated from the ISFshown in (A). The peak height of TrQt), XT*(Q), grows as T is lowered and reaches a
... ... .. .. ...
maximum at TL = 230 ± 5 K, but this growth is interrupted when the dynamic crossover sets
in. The only parameter in FH(Q,t) that has to be differentiated with respect to T is r7
(Q,
7),since
#
remains almost constant and close to 0.5 ± 0.1 as T is lowered[19, 49]. %T*(Q) istherefore directly proportional to the change of slope of the Arrhenius plot of rT(Q, T) (Figure
2.12 (C)). Therefore, this change of slope in the Arrhenius plot of rT(Q,T) is in our opinion
the most unbiased way of defining the crossover temperature.
1.0 0.8 LIUN - 200K
a
3.5 0.6 - 190K ' + - 180K *H170K 3.0 iCMKIH 2 2. 0.4 - A-.4 Q 0.56AX 2.5 0.2 2.0 1.5 0.0 103 102 10- 10 10 102 10 310 10 10" T(K) x ,..1 1 .. , ,,1 T(K) 250 240 230 220 210 200 190 180 1704
.
5
L
11
T
-*- 170K-180K 6 -- 180K-190K t 15 --- 190K-200K /5 - - 200K-210K - 210K-220K 34-6' 10- 220K-230K A L -+230K-240K 3 101 H -+- 240K-250K - 2 0 0 -103 102 101 10" 10 102 103 104 101 101 4.0 4.5 5.0 5.5 6.0 t (ps) 1000rrFigure 2.12 (A) The self-intermediate scattering functions (ISF) of hydrogen atoms in water confined in CMK, extracted from analysis of QENS data. We show here the specific case at
Q
=0.56 ~' for 9 temperatures, ranging from 250 K to 170 K. (B) Dynamic response function XT(Q,
t), computed from the ISF shown in the upper panel of this figure. The peak height of this quantity increases as temperature is lowered toward TL = 230 ± 5K (brown solid line), and decreases when
the temperature goes below TL. (C) Comparison of the experimentally extracted average
translational relaxation time <rT> of water confined in CMK with those of water in MCM-41-S and DWNT. (D) Derivative of the Arrhenius plot of the o-relaxation time, d(log<zT>)/d(1/T), for the three cases in panel (C). The peak positions in panel (D) is a suitable indicator of the crossover temperature TL in each case.
00
LL
Thus here we use the model -independent determination of the crossover temperature to
determine TL. It is by taking the slope of the translational relaxation time <Tr> in its
Arrhenius plot, i.e. d(log<rT>)/d(1/T). The peak position in the d(log<TrT>)/d(1/T) vs. l/T plot
represents the temperature where the largest slope in the Arrhenius plot occurs and is a
suitable indicator of the crossover temperature TL. The TL determined by this method is
usually 10~20K higher than the one determined by the traditional method (fitting the
Arrhenius plot with the Arrhenius law at low temperatures and with the VFT law at high
temperatures respectively) [17, 40, 43, 50]. In Figure 2.12 (C) and (D) we compare the
log<rT> vs. 1IT plots of water confined in three different materials, CMK-1, DWNT[43] and
MCM-41-S[40] and can find from the peak position in panel (D) that the maximum slope in
the Arrhenius plot of <r> for CMK-1 appears at a temperature about TL = 225 ± 5K. This
temperature agrees within the error bar with the temperature TL = 230 ± 5K shown in panels
(A) and (B), at which the maximum in the peak height of the calculated dynamic response
function
XT(Q,t)
appears. In addition, we can clearly see that the crossover temperature TL of the CMK-1 is slightly lower than that of the MCM-41-S, TL= 235 ± 5K, but higher than that of the DWNT, TL = 205 ± 5K.2.5 Conclusion
In this chapter, we bring up interesting observations that the crossover temperature depends
on the degree of hydrophilisity of the interface between the water and the confining substrate.
DWNT has an obvious hydrophobic interface between water and the substrate. As one can
observe, the crossover temperature for water confined in a hydrophilic substrate (MCM-41) is
higher than that confined in a hydrophobic substrate (DWNT) by about 35 K. Meanwhile, we
determine the crossover temperature by the model-independent analysis of the average
translational relaxation time <rT> by computing d(log< T>)/d(1/T) as a function of T. The
crossover temperature TL is 225 ± 5 K for water confined in CMK-1 hydrophobic substrate. It
While for DWNT case, ZTL is about 30 K instead. From this result, CMK-1 is seen to be not a completely hydrophobic material and its hydrophilisity is in-between MCM-41 and DWNT cases.
The value of ATL may also be dependent on the geometry of the confinement (3-D in the case of
CMK-1 as compare to 1-D in the case of DWNT). In the temperature range, from 250 K to 170 K,
the hydrophilisity of CMK- 1 does not change judging from our experimental result [44].
The peak height of the dynamic response function
XT(Q,t)
as a function of temperature is another way of determining the crossover temperature. However, this method suffers from theinaccuracy due to the large temperature interval between different measurement points and thus
has big error bars. Our results show that the dynamics of water under temperatures below 170 K
is so slow that it runs to the limit of the instrumental resolution. However, our previous
experiments [47, 50] indicate that the relaxation time of water molecules are shorter under
pressure. Thus studying the pressure effects on water dynamics under hydrophobic confinement
should be another interesting topic to be investigated in the future.
Previously we detect the crossover temperatures in hydrated DNA to be 222 K [41], vs in the
case of protein lysozyme to be 220 K [8], showing that DNA has more hydrophilic interface
presumably due to the presence of the phosphate groups. Thus it can be conjecture that the
magnitude of the crossover temperature TL can be used as an indicator of the hydrophilisity of the
substrate. A good test of this idea may be to measure the crossover temperatures of protein
hydration water with proteins of different hydrophilic and hydrophobic interfacial exposure.
On the other hand, it is shown in the literature that applying pressure can also increase
protein-water interactions and improve water accessibility to the hydrophobic core of the protein
[51]. From the above interpretation, this effect of pressure on protein-hydration-water system may
contribute to the phenomenon that the crossover temperature of protein hydration water decreases
Chapter 3
Study of Protein Dynamics
3.1 Introduction
Globular proteins are hetero-polymers consisting of densely packed amino acid chains.
Although crystallographic structures are known for many of them, these static structures alone are
not sufficient to understand their biological behavior. Their function is in fact eventually governed
by their slow conformational dynamics [52, 53]. Protein dynamics, triggered by thermal energy
(kBT per atom), allows the biomolecule to sample many conformations around the average
structure, the so-called conformational substates (CS). A complete description of proteins requires
therefore a multidimensional potential energy landscape (EL), a concept proposed for proteins by
Frauenfelder and co-workers in the 1970s [54-56]. The EL defines the relative probabilities of the
CS (the minima) and the energy barriers between them (the maxima). In particular, the EL of a
complex system that contains N atoms is described by the potential energy surface in a space of
3N dimensions, where each axis gives one coordinate of a specific atom.
As a first approximation, protein dynamics can be divided into two main groups according to
their timescale or, equivalently, to the region of the EL sampled [52]: (a) Slow timescale
dynamics (ps-ms, or the a.-relaxation) define fluctuations between states separated by energy
barriers of EA >> kBT, i.e. large-amplitude collective motions. Biological processes like enzyme
catalysis and protein-protein interactions occur on this timescale. (b) Fast timescale dynamics
(1ps-lOns, or n-relaxation) define fluctuations between structurally similar states that are
temperature like loop motions and side-chain rotations.
Slow and fast dynamics are somehow linked to each other. The correlation between
dynamics and biological activity has been demonstrated on the ps-ms timescale, but fluctuations
at atomic level are much faster than this, leading to the more complex idea of a hierarchy of
substates [54-56]. The EL is organized in a fractal-like hierarchy of a number of tiers; there are
valleys within valleys within valleys. Some aspects of protein dynamics are also 'slaved' to the
solvent fluctuations, with the protein component dictating the relative rates [5, 57].
Proteins and glasses are stochastic complex systems, and one of the distinctive features of
complex systems is a slow non-exponential relaxation of the density and single-particle
correlation functions
#q(t)
observed in a wide range of time scales. The time dependence of the relaxation scenario usually follows these three steps: it begins with (a) a short-time gaussian-likeballistic region, followed by (b) the fp-relaxation region which is governed by either two
power-law decays
#(t)
~ (t/TqO)-a and#q(t)
~ (-t/Tq )b or a logarithmic decay#q(t)
~ Aq - Bqln(t/TO), which then evolves into (c) an a-relaxation region that is governed by a stretched
exponential decay (or Kohlrausch-Williams-Watts law), q(t) ~ exp(-t/Tq") . These types of
relaxation are characteristic of complex systems[58], just as the simple exponential relaxation (or
Debye law) q(t) ~ exp(-t/Tq) is typical for gases and liquids. Proteins and glasses have also
important differences: both systems are aperiodic, but the organization of protein EL is far more
sophisticated than the glass one.
Figure 3.1 shows the complete time-dependence of a typical ISF for hydrated protein powder
[59]. In this chapter, we are going to study the whole curve, dividing protein dynamics into 3
sections by different time range:
(1) Long-time dynamics, i.e. a-relaxation, a stretched exponential decay, studied in section 3.2;
(2) Mid-time dynamics, i.e. p-relaxation, the logarithmic-like decay, studied in section 3.3; (3) Short-time dynamics, i.e. phonons in proteins, studied in section 3.4.