HAL Id: inserm-00678217
https://www.hal.inserm.fr/inserm-00678217
Submitted on 12 Mar 2012HAL is a multi-disciplinary open access archive for the deposit and dissemination of sci-entific research documents, whether they are pub-lished or not. The documents may come from teaching and research institutions in France or abroad, or from public or private research centers.
L’archive ouverte pluridisciplinaire HAL, est destinée au dépôt et à la diffusion de documents scientifiques de niveau recherche, publiés ou non, émanant des établissements d’enseignement et de recherche français ou étrangers, des laboratoires publics ou privés.
Abilities of cardiac MSCT imaging to provide useful
anatomical and functional information for Cardiac
Resynchronization Therapy optimization
Mireille Garreau, Marie-Paule Garcia, François Tavard, Antoine Simon, Julien
Fleureau, Jérôme Velut, Dominique Boulmier, Pascal Haigron, Christine
Toumoulin, Christophe Leclerc
To cite this version:
Mireille Garreau, Marie-Paule Garcia, François Tavard, Antoine Simon, Julien Fleureau, et al.. Abil-ities of cardiac MSCT imaging to provide useful anatomical and functional information for Car-diac Resynchronization Therapy optimization. Computing in Cardiology, Sep 2010, Belfast, Ireland. pp.237-240. �inserm-00678217�
Abilities of Cardiac MSCT Imaging to Provide Useful Anatomical and
Functional Information for Cardiac Resynchronization Therapy Optimization
1,2
Mireille Garreau,
1,2Marie-Paule Garcia,
1,2François Tavard,
1,2Antoine Simon,
1,2Julien Fleureau,
1,2,3Dominique Boulmier,
1,2Pascal Haigron,
1,2Christine Toumoulin,
1,2,3Christophe Leclercq
1INSERM, U642, Rennes, France
2Université de Rennes 1, LTSI, Rennes, France
3CHU Rennes, Service de cardiologie et maladies vasculaires, Rennes, France
Abstract
A main limit of biventricular Cardiac Resynchronization Therapy (CRT) is the high rate of non-responder. A challenging task to carry out remains both the identification of the most effective pacing sites and the left ventricular lead positioning (by a venous access). This paper aims to show how cardiac CT imaging can be helpful for the clinician to analyse venous system and cardiac function before the device implantation.
4D CT data have been analyzed in order to extract coronary vein anatomy and global and local left ventricle (LV) function.. The proposed process is decomposed in four steps: (1) the 3D tracking of coronary veins based on a fast-marching technique; (2) the 3D extraction and motion estimation of the LV along the cardiac cycle; (3) the fusion of extracted data with adapted modes of visualization. This approach has been tested on three patients and show how an optimal use of CT imaging may represent an advance towards CRT planning.
.
1. Introduction
Cardiac Resynchronization Therapy (CRT) has been shown to improve cardiovascular function and reduce mortality rates in a specific subpopulation of patients suffering from heart failure [1]. However, about 1/3 of the patients implanted do not respond appropriately to this therapy [2]. One way to decrease this non-response rate would be to optimize candidate selection in CRT and device implantation strategy [3]. One of challenging tasks to carry out remains both the identification of the most effective pacing sites and the left ventricular lead positioning (by a venous access). This topic is a real challenge and is the purpose of active actual research works [ref publis issues euheart].
This work is part of the IMOP project (IMaging for Optimisation of biventricular Pacing) which purpose is to define a CRT optimization method based on the fusion of mechanical, electrical and anatomical data.
Multislice Computed Tomography (MSCT), combining ultra-fast rotating gantries, multi-rows detectors and retrospective ECG-gated reconstruction, provides datasets representing the whole cardiac cycle with a high spatial resolution. It enables to provide an anatomical description of cardiac structures (ventricles and coronary vessels) but also a functional description, both obtained in one single examination. With this modality, transvenous path finding methods [4], anatomical structures extraction methods [5,6] and motion estimation approaches have been previously proposed [7].
Our objective is to better plan the placement of CRT leads using the MSCT capabilities in imaging the heart. This paper aims to show how cardiac CT imaging can be helpful for the clinician to analyse both venous system and cardiac function before the device implantation. This paper is organized as follows: a synthetic description of the different processing steps involved in the global approach is firstly given, including a vessel tracking and characterization process, the 3D LV shape segmentation and motion estimation, the extraction of motion parameters and the fusion and visualization of all available information. Some of these steps have been previously proposed. Results obtained on two patient databases are presented and discussed in a qualitative and quantitative way, and followed by some conclusions.
2.
Methods
The proposed process is decomposed in four steps: (1) the 3D tracking of coronary veins based on fast-marching techniques; (2) the 3D LV extraction along the cardiac cycle by using a fuzzy connectedness algorithm; (3) the cardiac LV motion estimation based on a multi-resolution surface matching method, giving access to functional parameters associated to anatomical segments; (4) the fusion of extracted data with adapted modes of visualization.
2.1.
Vessel Tracking and Characterization
This section introduces the implemented method for extracting and characterizing the coronary veins from MSCT volumes. The proposed tracking procedure is based on minimum-cost path computation and makes use of `Fast-Marching' technique. The algorithm aims at propagating a front inside curved tubular structures of varying width and yields a first estimation of the vessel axis. This first path is then used to give an accurate estimation of the local features of the vessel, that is, a centered position on the vessel axis and its corresponding radius.
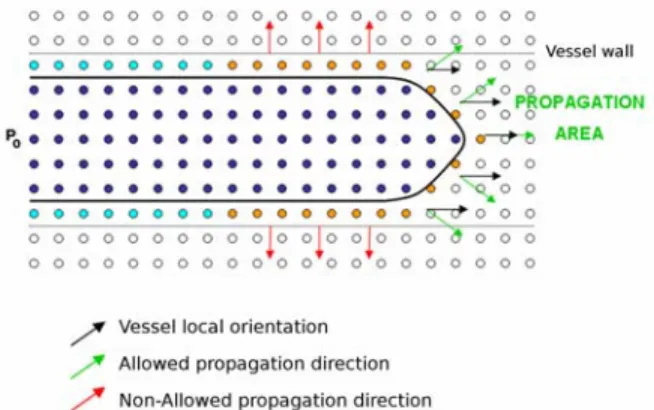
An efficient way to solve the minimal path problem in 3D images is the `Fast-Marching' procedure [8]. The `Fast-Marching' algorithm describes a front propagation scenario, which progresses outward from an initial point P0 (fig 1). This front passes only once over a voxel and compute a map to deduce the minimum cost path by backtracking when the final point PF is reached by the front. The value associated to a point P on the previous map represents the cumulative cost of its minimum cost path from P0.
Figure 1. Front propagation principle in 2D space: the front propagates into the vessel lumen from the point P0, guided by the vessel local orientation. In dark blue, points whose cumulative cost of the minimal cost path from P0 is computed. In light blue, positions where the front is definitely stopped thanks to the Freezing procedure.
To cope with contrast inhomogeneities and low-contrast environment, Garcia et al. [9] proposed a front propagation procedure with orientation constraint. In this approach, the front is not allowed to propagate beyond vessel boundaries. To achieve this goal, the front propagation is guided by a specific cost function which considers the reciprocal of a vesselness measure weighted by the orientation information. Local orientation and vesselness measure are computed from the eigenvalue analysis of the Hessian matrix and Frangi's filter [10]. The front evolves fastest in the direction of the vessel local orientation and in regions where the vesselness measure is higher (close to the vessel axis). The front is
definitely stopped at non-vascular positions and at positions where the propagation direction is too different from the vessel local orientation. However, in case of low-contrast zones, the previous positions may not be assigned a strong enough value to definitely stop the front. Thus, while the front progresses in the vessel, a Freezing procedure is needed to definitely stop the front at those positions [11].
Finally, this extracted centreline corresponding to the resulting minimum cost path is used to locally characterize the vessel thanks to geometrical moment computation [12]. Thus, a correction of the estimated centered position and its corresponding radius are computed.
The previous tracking procedure [9] was assessed on synthetic and real data sets. A parametric study was performed on a synthetic data set representing coronary veins with similar features to those of MSCT volumes. Furthermore, a qualitative evaluation on coronary veins labelled and classified according to their visibility on MSCT volumes was performed (expertized by a cardiologist). The method appears robust to contrast inhomogeneities in MSCT volumes [9].
2.2.
4D LV segmentation
The segmentation of the left cavities, along the whole cardiac cycle, is based on a fuzzy connectedness algorithm [14]: from a seed point (chosen interactively), it generates a connectedness map, associating each voxel to the seed. The connectedness is based on affinity (measuring the similarity, in terms of intensity and spatial distance, between voxels and the seed) and path (linking voxels to the seed). Considering this Dijkstra algorithm, the construction of the connectedness map has been realized with low costs in terms of memory use and rapidity [15]. This algorithm begins from a central seed point in the object of interest and expands the research in the graph in a width way.
An extension in time of this process has been realized in order to study the global cardiac function. For that purpose, the connectedness segmentation algorithm is applied on dynamic CT datasets. Considering that the left cavity is not submitted to a large global displacement, the same seed point can be used for all the 3D volumes of one patient database, provided that this point is positioned about the centre of the cavity. From this seed point, the left cavities are segmented along the whole cardiac cycle.
The surface reconstruction of the segmented volumes is then realized using Marching Cubes algorithm and resulting to surface meshes representing the left cavities (left ventricle and auricle, beginning of the aorta). The final step is to cut through the reconstructed surface in order to extract the left ventricle. This is based on the semi-automatic placement of a 3D plane at the valvular plane at the first time-instant of the sequence. The
selected plane is used to cut through the surface and to initialize the same process at the following time.
This method therefore gives access, with few interactions, to the evolution of the cardiac volume along the whole cardiac cycle. Results have been compared to measures made during clinical routine with MSCT and MRI (only at end-diastolic and end-systolic phases) and have provided satisfying results (volume difference less than 10%).
2.3. Cardiac motion estimation and
characterization
Once the previous step provides the segmentation of the left endocardium along the whole temporal sequence and the reconstruction of the surface meshes corresponding to the segmented surfaces, the motion estimation step is applied. This last method we have previously proposed [15, 16] relies on the temporal surface matching to estimate the displacements of the mesh nodes.
The motion estimation relies on the multi-resolution matching of each pair of surfaces (S1, S2) corresponding to two following instants of the cardiac cycle. It is based on the definition of a Markov Random Field F, whose sites are the nodes of S1 and labels are the nodes of S2. The most probable realization of F, according to a global energy U, leads to the estimated motion field. The matching is guided by mean and Gaussian curvatures. In order to take advantage of the spatiotemporal regularity of the motion field, the energy U includes terms privileging low amplitude and spatially regular displacements. A multi-resolution scheme is used in order to optimize the minimization process. At the lowest resolution, the energy minimization is performed using a simulated annealing algorithm while, at higher resolutions, an iterated conditional mode (ICM) algorithm is used.
The application of this method to each pair of successive surfaces S1 and S2 results to one motion field associated to each instant of the cardiac cycle and defined on the set of nodes of the corresponding endocardial mesh. From the obtained motion fields, motion descriptors can be extracted. For instance, maximal displacement (according to the first time-instant of the sequence at end-diastolic phase), time-instant corresponding to this maximal displacement and total displacement can be computed. Complementary works have been also proposed to extract different motion components of functional parameters such as radial and longitudinal motion components [16].
This technique has been evaluated on simulated data and on real data, with comparison of global extracted motion parameters measured on clinical stations with CT and MRI modalities. A work has been developed to compare motion components measured from CT and from
ultrasound Speckle Tracking Imaging and have provided coherent measures between these modalities, in particular for longitudinal displacements [17].
2.3. Data
visualization
Different modes of visualization can be chosen and adapted according to the clinician needs for CRT optimization. If we consider help for gesture planning, it is of interest to visualize the veins that are present, their diameter and orientation with a global 3D representation of the venous network but also with a precise delineation of veins in curvilinear planes to see clearly the neighboring structures. Motion extracted parameters can then be displayed using different representation modes, e.g. 3D endocardial surface for a precise description or bull-eye representation based on the 17 cardiac anatomical segments. Of course, the fusion of vessels with color-codes surfaces describing LV motion extracted parameters in superposition with extracted cardiac left structures (endocardium, auricle) can be helpful to better precise the site for CRT lead placement.
3. Results
These methods have been applied to three patient data (selected patients for CRT with severe asynchronism). The algorithms have been applied on MSCT data sets acquired with a MSCT scanner (General Electric Healthcare LightSpeed VCT 64-slice Scanner) providing 20 3D reconstructed volumes by ECG post-synchronization (resolution: 0.3x0.3x0.5 mm) representing a whole cardiac cycle. A preliminary interpolation was performed to make the datasets isotropic.
Results obtained on two patient databases are shown (identified as cases P1 and P2). About vessel extraction, coronary venous tree was better contrasted from the 50% volume to the 80% volume of the sequence. For case P1, five veins have been extracted with the vessel tracking process included the Coronary Sinus (CS), the Mean Vein (MV), the Great Cardiac Vein (GVC), the Postero-Lateral Vein (VPL), the Lateral Vein (VL). For case P2, five veins have been extracted with SC, MV, GVC, VPL and Antero-Lateral Vein (AVL) (fig. 2).
ajout fig cas 04 et rogner pour être plus grand
Figure 3. 3D representation of extracted venous networks : (a) case P1 (SC, MV, GVC, VPL, VL veins), (b) case P2 (SC, MV, GVC, VPL, AVL veins)
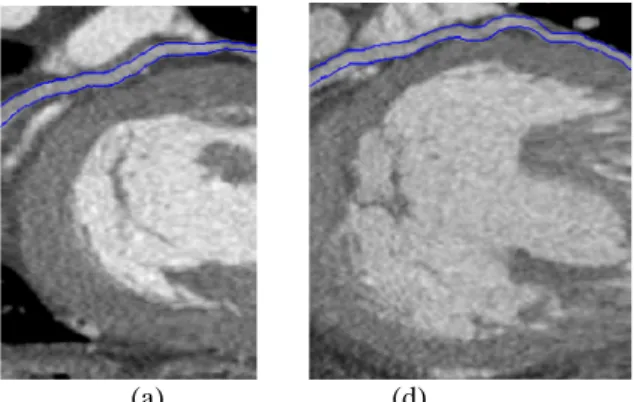
Examples of extracted coronary veins are given on curvilinear reconstructed slices for the two patients on figure 3. These images display in blue color the extraction of the Great Cardiac Vein (a) for case P1 and the Antero-Lateral Vein (b) for case P2 with respective diameter interval of 1.8-2.8 mm and XX-XX mm. These veins have been selected for the left ventricular lead placement during the CRT gesture.
(a) (d)
Figure 3. Examples of extracted coronary veins with their diameter on curvilinear reconstructions: (a) case P1, Great Cardiac Vein; (b) case P2, Antero-Lateral Vein
The segmentation process allowed the extraction of the left cavities and in particular the left ventricle endocardium. The LV mesh surfaces have then be used to estimate the motion along the cardiac cycle, providing the means to extract global and local motion parameters. For each patient P1 and P2, a representation of the fusion of both extracted venous network and measured local maximal displacement is displayed with their superposition on the 3D extracted cardiac surfaces (fig. 4, 5).
This combined data visualization allows to associate specific dynamic behaviour of anatomical regions to their vein vessels and to better identify a site of interest.
XXX compléter
Modif à faire : 2 incidences si possible et + gros
Figure 4. Case P1: Representation of venous network (in dark red color) and extracted local cardiac function: maximal displacement (mm) represented in color with a 3D surface (left oblique anterior view) (left) – (right anterior view (right)
Pas la bonne image : 2 incidences si possible
Figure 5. Case P2: Representation of venous network (in dark red color) and extracted local cardiac function: maximal displacement (mm) represented in color with a 3D surface (left oblique anterior view) (left) – (right anterior view (right)
4. Conlusion
4D CT data have been analyzed in order to extract global and local left ventricle (LV) function and coronary vein anatomy. The integration of the overall set of available information with adapted modes of visualization may represent an advance towards the optimal use of CT imaging in CRT planning. This approach has been tested on three patients. First results show that combined anatomical and functional information, concerning in particular the characterization of the venous network and the LV local motion, are of interest for CRT optimization. This work is associated to other works providing the means to combine multimodal information describing anatomical, but also functional and electrical data [18]. A complete validation of these methods has to be realized with a great number of candidate patients for CRT.
Acknowledgements
This work is supported by the French National Research Agency (n°04 T 187 - 188 - 189 - 190 CITH and n°ANR-07-EMPB-007-01) and the Brittany Regional Council.
References
[]] Leclercq C, Kass DA. Re-timing the failing heart: principles and current clinical status of cardiac resynchronization. J.Am.Coll.Cardiol 2002;39:194-201. [2] Mehra MR, Greenberg BH. Cardiac resynchronization therapy: caveat medicus!. J.Am.Coll.Cardiol. 2004;43:1145-1148.
[3] Chung E et al. Results of the Predictors of Response to CRT (PROSPECT). Circulation 2008;117:2608-16 [4] Coatrieux JL, Hernandez AI, Mabo P, Garreau M, Haigron P. Transvenous path finding in cardiac resynchronization therapy. In FIMH 2005; 236-45.
[5] Ecabert O., Peters J., Schramm H., Lorenz C., von Berg J., Walker M., Vembar M., Olszewski M., Subramanyan K., Lavi G., Weese J. Automatic model-based segmentation of the heart in CT images. IEEE Trans Med Imag 2008; 27(9):1189–1201.
[6] Larrabide, P. Omedas, Y. Martelli et al., GIMIAS: An Open Source Framework for Efficient Development of Research Tools and Clinical Prototypes, in: FIMH 2009: 417-426.
[7] Simon A, Garreau M, Boulmier D, Coatrieux JL, Le Breton H, editors. A surface-volume matching process using a Markov random field model for cardiac motion extraction in MSCT imaging. In FIMH 2005: XX
[8] Deschamps T and Cohen LD. Fast extraction of minimal paths in 3D images and applications to virtual endoscopy. Medical Image Analysis, 2001;5(4):281–299. [9] Garcia MP, Toumoulin C, Haigron P, Velut J, Garreau M, and Boulmier D. Coronary vein tracking from msct using a minimum cost path approach. In IEEE ISBI 2010.: XX
[10] Frangi AF, Niessen WJ, Vincken KL and Viergever MA. Multiscale vessel enhancement filtering. In MICCAI 1988: 130–137.
[11] Cohen LD and Deschamps T. Segmentation of 3d tubular objects with adaptive front propagation and minimal tree extraction for 3d medical imaging. Computer Methods in Biomechanics and Biomedical Engineering, 2007; 10(4):289–305.
[12] Boldak C, Rolland Y, Toumoulin C, and Coatrieux JL. An improved model-based vessel tracking algorithm with application to computed tomography angiography. Biocybern. Biomed. Eng., 2003; 23:41–63.
[13] Udupa J.K., Saha P.K. et Lotufo R.A., Relative fuzzy connectedness and object definition : theory, algorithms, and application in segmentation, IEEE Transaction on Pattern Analysis and Machine Intelligence;2002 24(11):1485-1500.
[14] Fleureau J, Garreau M, Simon A, Hachemani R, Boulmier, D. Assessment of global cardiac function in MSCT imaging using fuzzy connectedness segmentation. In Computers in Cardiology. 2008; 725-28.
[15] Simon A, Garreau M, Boulmier D, Coatrieux JL, Le Breton H. Cardiac Motion Extraction Using 3D Surface Matching in Multislice Computed Tomography. In MICCAI 2004; 1057-59.
[16] Garreau M, Simon A, Boulmier D, Coatrieux, JL, Le Breton H. Surface and motion extraction in cardiac MSCT imaging for the assessment of left ventricular function. International Journal of Biomedical Imaging 2006; Article ID 37607.
[17] Delaunay, R., Simon, A., Hernandez, A., Leclercq,
C.; Donal, E.; Larralde, A. & Garreau, M., Cardiac Function Estimation for Resynchronization Therapy: Comparison between Multislice-CT and Speeckle Tracking Imaging. In IEEE ISBI 2008, 524-7.
[18] Tavard F, Simon A, Leclercq C, Pavin D, Hernandez A, Garreau M. Data fusion of left ventricle electro-anatomical mapping and multislice computerized tomography. In IEEE ICIP 2009: IEEE Press. ISBN 978-1-4244-5653-6, 2009; 1725–1728.
Address for correspondence. Mireille Garreau
LTSI, Campus de Beaulieu, Universit´e de Rennes 1, 263 Avenue du General Leclerc - CS 74205 - 35042 Rennes Cedex, France