Publisher’s version / Version de l'éditeur:
Proceedings 11th International Workshop on Atmospheric Icing of Structures
(IWAIS), XI, 2005-06
READ THESE TERMS AND CONDITIONS CAREFULLY BEFORE USING THIS WEBSITE. https://nrc-publications.canada.ca/eng/copyright
Vous avez des questions? Nous pouvons vous aider. Pour communiquer directement avec un auteur, consultez la première page de la revue dans laquelle son article a été publié afin de trouver ses coordonnées. Si vous n’arrivez pas à les repérer, communiquez avec nous à [email protected].
Questions? Contact the NRC Publications Archive team at
[email protected]. If you wish to email the authors directly, please see the first page of the publication for their contact information.
Archives des publications du CNRC
This publication could be one of several versions: author’s original, accepted manuscript or the publisher’s version. / La version de cette publication peut être l’une des suivantes : la version prépublication de l’auteur, la version acceptée du manuscrit ou la version de l’éditeur.
Access and use of this website and the material on it are subject to the Terms and Conditions set forth at
NRC Marine Icing Database
Timco, Garry; Kubat, Ivana
https://publications-cnrc.canada.ca/fra/droits
L’accès à ce site Web et l’utilisation de son contenu sont assujettis aux conditions présentées dans le site LISEZ CES CONDITIONS ATTENTIVEMENT AVANT D’UTILISER CE SITE WEB.
NRC Publications Record / Notice d'Archives des publications de CNRC:
https://nrc-publications.canada.ca/eng/view/object/?id=b34f0d4e-7a3a-4e6b-b7ef-c057aa9c4d24 https://publications-cnrc.canada.ca/fra/voir/objet/?id=b34f0d4e-7a3a-4e6b-b7ef-c057aa9c4d24
Abstract— Vessels operating in northern waters during the winter months constantly face a hazard of icing. This applies particularly to the Canadian east coast fishing vessels. Though there has been considerable data collected on the amount of marine icing for different environmental conditions, the sources are scattered and not easily accessible. Therefore the Canadian Hydraulics Centre of National Research Council Canada developed a comprehensive Marine Icing Database. The database contains more than 1000 events of marine icing for different environmental conditions collected from year 1970 and onwards. It can be used as a tool to predict icing severity for different environmental conditions, with direct applications on the Grand Banks. This paper describes the database in detail.
I. INTRODUCTION
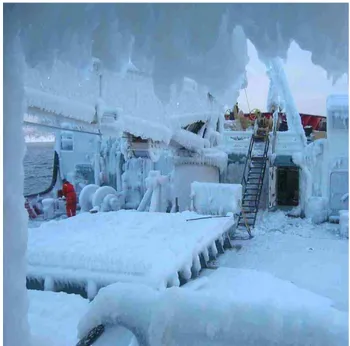
CE accretion on vessels and offshore structures is of concern for safe operations in cold climates. Heavy ice accretion can result in the increased size and weight of the structural members (see e.g. Fig. 1), increase the draught of a vessel, change the centre of vessel gravity, i.e. influence its stability, and potentially cause a vessel to capsize. Light accretion can lead to operational difficulties such as slippery decks, handrails, icebound winches and valves, Also safety on a vessel can be affected if life saving equipment is unusable. The potential for ice accretion on vessels and offshore structures is directly related to the environmental conditions. A number of models to estimate ice accretion have been developed. The ICEMOD [1], [2] and RIGICE [3] were developed specifically for offshore structures. The RIGICE model has been recently modified focusing on spray generation [4]. Neither of the models has been completely verified by field measurements of ice accretion on offshore structures and/or vessels.
In 1980, Stallabrass published a comprehensive report describing the collection of icing on fishing trawlers on the east coast of Canada [4]. This was the culmination of a large data collection program that was carried out during the 1970s. Jim Stallabrass, who worked for the National Research Council of Canada (NRC), developed a simple questionnaire (Fig. 2) that would allow individual trawlers to collect observed instances of icing and report them to the NRC. This data collection program was highly successful and a large amount of data on actual icing conditions was collected. The data obtained from the reports helped to establish relationship between the icing and environmental conditions, geographical
extent of the icing occurrence, and statistics on the icing severity in the Canadian East coast [5]. Subsequently, Brown and Agnew [6] and Brown and Robber [7] characterized and summarized the ice accretion in Canadian coastal region using the regular ship icing observations and icing reports.
Fig. 1: Ice Accretion on a Vessel
Unfortunately, the basic data are not readily available to use to validate predictive models of ice accretion such as ICEMOD and RIGICE. The data resided in the original icing reports and in Stallabrass’s files. Since this data were quite unique, it was thought to be important to retrieve it and make it readily available to the icing community. Stallabrass retired from the NRC in 1987. One of the authors (GT) worked with him in the late 1970s and remembered seeing his analyzed results in summary tables. The NRC Archives were contacted and an attempt was made to retrieve both the original icing forms as well as Stallabrass’s summary tables. Unfortunately, the original forms could not be found, but two large binders containing the summary results were located. Documentation indicated that there was a third binder with results, but this could not be located. Nevertheless, the two summary binders provided a wealth of important information from this data collection program.
Ivana Kubat and Dr.Garry Timco
Canadian Hydraulics Centre – National Research Council Canada
Ottawa, Ontario,K1A 0R6 Canada, [email protected], [email protected]
NRC Marine Icing Database
Fig. 2: Ship Icing Report Form
The Canadian Program of Energy Research and Development (PERD) was approached with a request to provide funding to update this information into a modern database. With this funding, the Canadian Hydraulics Centre (CHC) of National Research Council of Canada developed a comprehensive Marine Icing Database in which the available data were brought together. This paper describes the database in detail.
II. FORMATOFTHEDATABASE
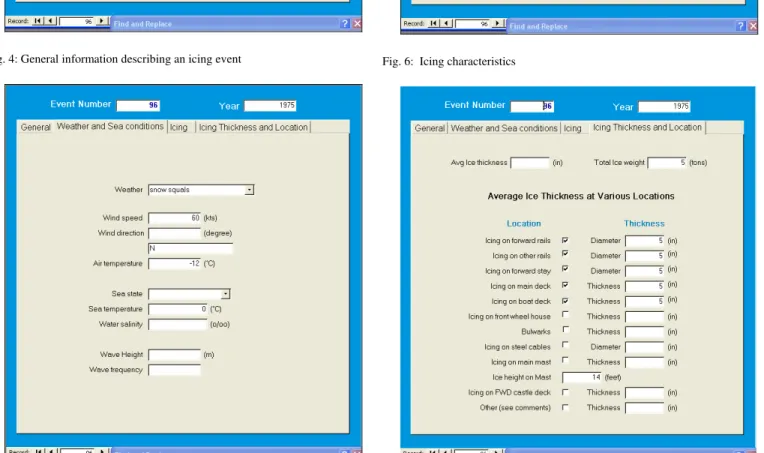
The database contains over 1200 events from 138 different vessels. Each vessel is characterized by a number of fields such as type of vessel (fishing vessel, ferry, tug, supply vessel, tanker, icebreaker, etc), vessel dimensions, tonnage, etc. The event in the database stands for a period at which an icing on a vessel was recorded. The database contains both icing and non-icing events. Fig. 3 shows locations of events stored in the database. Note that not all 1200 events are shown in the map. In some cases the information about coordinates (latitude and longitude) is not available. Also, many events were recorded in near vicinity, therefore the symbols indicating the occurrence of the events might be superimposed on the map. Each event in the database is described by 67 fields. These are divided into four categories: General, Weather and Sea Conditions, Icing, and Icing Thickness and Location.
The General category (Fig. 4) contains information about the source of data, vessels on which the icing was being
icing was being observed.
Weather and Sea Ice Conditions category (Fig. 5) provides information on weather conditions (snow, rain, fog, snow flurries, light spraying, wind speed and direction, air temperature) and sea state (fair sea, large waves, rough sea, sea temperature, water salinity, wave height and frequency).
The icing events are further described by fields in the Icing category (Fig. 6). These provide information on when icing commenced and when it stopped, what the icing severity, accretion, and icing duration were, what the vessel movement, speed and heading were during the icing, and if the vessel handling was affected by icing. The Icing is also characterized by a degree of icing (1/2 to 3 ½ IMCO in 1/2 degree increments), icing severity rate (both tonnage per hour and inches per 24 hours) and Mertin’s severity. In addition, the Icing category contains Comments field for further description of the events.
The Icing Thickness and Location category (Fig. 7) provides information on the average ice thickness and total ice weight on the vessel, as well as information on average ice thickness at various vessel locations.
Figs. 4 to 7 show forms with the four categories as they appear in the database.
Fig. 3: Location of Events stored in the database
To date the database contains the data set collected by Jim Stallabrass. These are the voluntary ship icing reports and ship icing questionnaires distributed by Canadian Coast Guard and National Research Council of Canada. The information on icing stored in the database had been collected over period 1970 – 1980. As previously mentioned, not all of the original data events could be located. Table 1 lists the number of trawlers responding and the icing reports both in terms of Stallabrass’s original report and the current database.
Fig. 4: General information describing an icing event
Fig. 5: Weather and ice conditions during the icing event
Fig. 6: Icing characteristics
TABLEI
NUMBER OF VESSELS RESPONDING TO SHIP ICING QUESTIONNAIRES IN STALLABRASS’REPORT COMPARED TO NUMBER OF VESSELS RECORDED IN
THE MARINE ICING DATABASE
Year Stallabrass’ Report Database Differ 1968/69 6 6 1969/70 14 13 1 1970/71 29 27 2 1971/72 29 29 0
1972/73 Data from vessels were lost for this year
1973/74 31 12 19 1974/75 29 29 1975/76 50 39 11 1976/77 52 33 19 1977/78 67 44 23 1978/79 35 6 29 Total 342 203 139
III. DATAANALYSIS
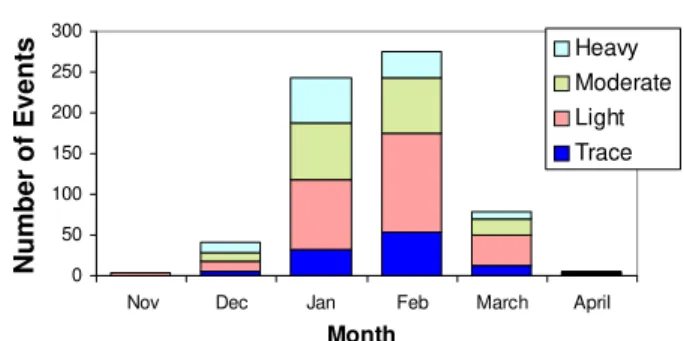
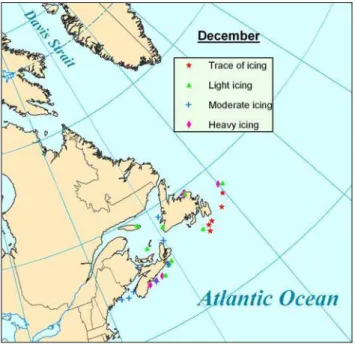
Data in the database indicate that the icing occurs predominantly in month of February, followed by January. Figs. 8 and 9 show a number of icing events per month and a number of icing days recorded in the database, respectively. Fig. 10 plots a number of icing events in the database for each year. The icing in the database is categorized based on severity as Trace, Light, Moderate, and Heavy. Figs. 11 to 14 show location of icing events with different severity recorded in December, January, February, and March, respectively, over period 1968 to 1980. The data stored in the database can by analyzed in a number of ways to determine the sensitivity of icing severity on different factors and parameters. For example severity of icing as a function of geographic location, temperature, location on vessel, wind speed and air temperature, vessel speed and air temperature, wind direction, vessel heading, etc can be determined. The data in the database can be also used to verify the output of the existing ice accretion models.
Number of Icing Events Recorded (1970-80)
0 50 100 150 200 250 300
Nov Dec Jan Feb March April
Month Number of Events Heavy Moderate Light Trace
Fig. 8: Number of icing events recorded in the database
0 30 60 90 120 150 180
Nov Dec Jan Feb March April
Month Number of Days Heavy Moderate Light Trace
Fig. 9: Number of icing days recorded in the database
0 20 40 60 80 100 120 140 160 180 200 69-70 70-71 71-72 72-73 73-74 74-75 75-76 76-77 77-78 78-79 79-80 Year Nu mb er o f Icin g Even ts Heavy Moderate Light Trace Null
Fig. 10: Number of icing event recorded in the database every year
IV. SUMMARYANDCONCLUSIONS
This paper describes the NRC Marine Icing Database developed at Canadian Hydraulics Centre of National Research Council of Canada. The database was developed in order to gather and integrate available data on marine icing for different environmental conditions.
To ensure that anyone who has an interest in it can access it, the most current version will reside on the CHC/NRC website. To obtain a copy, CHC Home Page should be accessed as: www.chc.nrc.ca . From there, select either English or French. “Cold Regions Technology” should be selected and click on “PERD”. This will bring a login page. The information on the current form for registering is included there. The CHC/PERD page contains a large number of reports and databases relating to many aspects of ice engineering. The NRC Marine Icing Database can be found under the section on Marine Icing.
It should be mentioned that the data collection program continued into the 1980s onboard Canadian Coast Guard vessels. The authors are trying to locate this data and if successful, it will be incorporated into the database.
Fig. 11: Database Icing Events Recorded in December (1968 – 1980)
Fig. 12: Database Icing Events Recorded in January (1968 – 1980)
Fig. 13: Database Icing Events Recorded in February (1968 – 1980)
predictive algorithms for icing based on actual meteorological conditions (water temperature, air temperature, wave height, and wind speed). Such tool will allow for predicting and simulating marine icing on vessels operating in the winter offshore environment, and will allow the offshore petroleum industry to deal with the marine icing hazard in a timely and cost-effective manner. The database can be also used for testing the available icing models.
V. AKNOWLEDGEMENT
The authors would like to thank to the Program of Energy Research and Development (PERD) through the Marine Transportation and Safety POL for financial support of this project. They would also like to acknowledge the diligent work of Janette Walsh who entered the data into the database. This database would not be possible without the years of dedicated work from Jim Stallabrass. Unfortunately, he passed away from Alzheimer’s disease on April 29, 2002.
VI. REFERENCES
[1] Horjen, I., and Vefsnmo, S., “Computer modelling of sea spray icing on marine structures.” Proceedings of Symposium on Automation for Safety in Offshore Operations (ASSOPO 1985), Trondheim, Norway, 1985, pp. 315-323.
[2] Vefsnmo, S., Horjen, I., and Løset, S., “Time-dependent numerical model for sea spay icing on marine structures.” Proceedings of the International Conference Port and Ocean Engineering under Arctic Conditions (POAC 1987), Fairbanks, Alaska, USA, 1987, pp.571-579. [3] Roebber, P., and Mitten, P., “Modelling and Measurements of Icing in
Canadian Waters.” Canadian Climate Centre Report, No.87-15, 1987, 150 pp.
[4] Lozowski, E.P., Forest, T., Chung, V., and Szilder, K., “Study of Marine Icing, Final Report.” Report CR-2002-03. Institute for Marine Dynamics. National Research Council. St. John’s, Newfoundland, Canada. A1B 3T5. May 2002. 88 pp.
[5] Stallabrass, J.R., 1980. “Trawler Icing. A Compilation of Work done at N.R.C.,” Mechanical Engineering Report MD-56, N.R.C. NO.19372, December 1980. 103 pp,
[6] Brown, R.D., and Agnew, T.A., “Characteristics of Marine Icing in Canadian Waters.” Proceedings of the International Workshop on Offshore Winds and Icing, Halifax, Nova Scotia, Canada, 1985, pp.78-94
[7] Brown, R.D., and Roebber, P., “The Ice Accretion Problem in Canadian Waters Related to Offshore Energy and Transportation.” Canadian Climate Centre Report, No.85-13, 1985, 295 pp.