HAL Id: hal-02418642
https://hal.archives-ouvertes.fr/hal-02418642
Submitted on 15 Sep 2020
HAL is a multi-disciplinary open access
archive for the deposit and dissemination of
sci-entific research documents, whether they are
pub-lished or not. The documents may come from
teaching and research institutions in France or
abroad, or from public or private research centers.
L’archive ouverte pluridisciplinaire HAL, est
destinée au dépôt et à la diffusion de documents
scientifiques de niveau recherche, publiés ou non,
émanant des établissements d’enseignement et de
recherche français ou étrangers, des laboratoires
publics ou privés.
Distributed under a Creative Commons Attribution - NoDerivatives| 4.0 International
License
Last deglaciation in the central Balkan Peninsula:
Geochronological evidence from the Jablanica Mt.
(North Macedonia)
Zsófia Ruszkiczay-Rüdiger, Zoltán Kern, Marjan Temovski, Balázs Madarász,
Ivica Milevski, Regis Braucher
To cite this version:
Zsófia Ruszkiczay-Rüdiger, Zoltán Kern, Marjan Temovski, Balázs Madarász, Ivica Milevski,
et al..
Last deglaciation in the central Balkan Peninsula:
Geochronological evidence from
the Jablanica Mt.
(North Macedonia).
Geomorphology, Elsevier, 2020, 351, pp.106985.
Last deglaciation in the central Balkan Peninsula: Geochronological
evidence from the Jablanica Mt. (North Macedonia)
Zsó
fia Ruszkiczay-Rüdiger
a,⁎
, Zoltán Kern
a, Marjan Temovski
a,b, Balázs Madarász
c, Ivica Milevski
d,
Régis Braucher
e,ASTER Team
e,fa
Institute for Geological and Geochemical Research, Research Centre for Astronomy and Earth Sciences, Budaörsi út 45, 1112 Budapest, Hungary b
Isotope Climatology and Environmental Research Centre, Institute for Nuclear Research, Bem tér 18/c, 4026 Debrecen, Hungary c
Geographical Institute, Research Centre for Astronomy and Earth Sciences, Budaörsi út 45, 1112 Budapest, Hungary d
Institute of Geography, Faculty of Natural Sciences and Mathematics, Ss. Cyril and Methodius University, Arhimedova 3, 1000 Skopje, Macedonia eCEREGE, Aix-Marseille Univ., CNRS-IRD UM34, Collége de France, INRA, BP 80, 13545 Aix-en-Provence Cedex 4, France
f
Didier Bourlès, Georges Aumaître, Karim Keddadouche
a b s t r a c t
a r t i c l e i n f o
Article history: Received 8 October 2019
Received in revised form 3 December 2019 Accepted 3 December 2019
Available online 5 December 2019
Several studies applied numerical age determination methods to examine glacial phases of the central Balkan Peninsula. However, the resulting datasets are contradictory, meaning that further discussion is needed. This study provides10Be cosmic ray exposure (CRE) ages of a succession of glacial landforms in the Jablanica Mt.
(North Macedonia), aiming at a better understanding of Late Pleistocene glacier development in the area. On the basis of the mapped glacial landforms, six glacial stages were identified and their mean equilibrium line alti-tudes (ELAs) were estimated. The CRE ages offive glacial stages - from the second oldest to the youngest - were determined between 16.8+0.8/
−0.5ka and 13.0+0.4/−0.9ka. Accordingly, the most extensive glaciation in the
Jablanica Mt. occurred before ~17 ka. The average ELA of the glaciers was 1792 ± 18 m a.s.l. during the largest ice extent, and 2096 ± 18 m during the last phase of the deglaciation.
Independent reconstructions of key climatic drivers of glaciological mass balance suggest that glacial re-advances during the deglaciation were associated to cool summer temperatures before ~15 ka. The last glacial stillstand ap-parently resulted from a modest drop in summer temperature coupled with increased winter snow accumula-tion. In the study area no geomorphological evidence for glacier advance after ~13+0.4/
−0.9ka could be found.
On the basis of independent climate proxies we propose that the last glacier advance occurred no later than ~13 ka, and glaciers were withdrawing during the Younger Dryas when low temperatures were combined with dry winters.
© 2019 Elsevier B.V. All rights reserved.
Keywords: Cosmogenic nuclide Glacial geomorphology Paleoclimate Mediterranean 1. Introduction
An impressive Alpine landscape characterizing the elevated terrains of the highest ranges on the Balkan Peninsula was already reported a century ago and interpreted as a result of Quaternary glaciations (Cvijič, 1889, 1917). However, only some small glacierets or permanent firn patches are currently present in the highest ranges of the area (Gachev et al., 2016).
Since the 19th century, geomorphological studies in the currently unglaciated central Balkan Peninsula described extended glacial land-forms and evidence for repeated glaciations (e.g.,Menković et al., 2004;Milivojević et al., 2008;Djurović, 2009;Temovski et al., 2018). The most extended glaciers in the Balkan Peninsula formed in the
Orjen, Durmitor and Prokletije Mountains (Hughes et al., 2010, 2011; Hughes and Woodward, 2016) (Fig. 1A, B). The described ice caps in the coastal ranges along the Adriatic Sea and the apparently limited ex-tent of inland glaciations suggest that large ice-fields along the coastal ranges blocked the inland penetration of humid air masses from south to north, resulting in significantly drier conditions in the Balkan interior and in the Pannonian Basin compared to the coastal margin of the Balkan Peninsula (Hughes et al., 2010).
Existing geochronological studies provide limited insights in the chronology of the glaciations of the area. Determination of cosmic ray exposure (CRE) ages of glacial landforms was performed in theŠar Mts, (Kosovo-Macedonia;Kuhlemann et al., 2009), in the Rila Mts (Bul-garia;Kuhlemann et al., 2013) and in the Pelister Mt. (Macedonia; Ribolini et al., 2017) using in situ-produced cosmogenic10Be, in the
Galičica Mt. (Macedonia;Gromig et al., 2018), Velež and Crvanj Mts (Bosnia and Herzegovina;Žebre et al., 2019) and in the Chelmos and
⁎ Corresponding author.
E-mail address:rrzsofi@geochem.hu(Z. Ruszkiczay-Rüdiger).
https://doi.org/10.1016/j.geomorph.2019.106985
0169-555X/© 2019 Elsevier B.V. All rights reserved.
Contents lists available atScienceDirect
Geomorphology
Olympus Mountains (Greece,Pope et al., 2017;Styllas et al., 2018) using in situ produced cosmogenic36Cl. Minimum ages for moraine formation
in limestone mountains of Montenegro and Greece are provided by U-series ages of the carbonate cement of the morainic material (Hughes et al., 2007, 2010, 2011).
Considering the available numerical ages, repeated glaciations af-fected the region since the Middle Pleistocene (Hughes, 2010;Hughes et al., 2011) up to the Lateglacial (in this study the period between the
Last Glacial Maximum (LGM) and the Holocene: ~18–11.7 ka)
(Hughes, 2010;Ribolini et al., 2017). The terminal moraines of the most extensive glaciations were considered as LGM in age (22.1 ± 4.3 ka in the Northern Hemisphere;Shakun and Carlson, 2010) in the central Balkan Peninsula (Kuhlemann et al., 2009, 2013), while they very likely were produced by pre-LGM glaciations along the Adriatic Coastal Ranges (Hughes et al., 2007, 2010, 2011). As a further complica-tion, a recent study on the Adriatic coast placed the largest glaciers to the Lateglacial (Žebre et al., 2019). Such ambiguous data encourage fur-ther investigations. In this context, it is of key interest to constrain the chronology of the glacio-geomorphological evidence of Jablanica Mt. (Temovski et al., 2018) since this range is situated at the transition zone between these sub-regions of the Balkan Peninsula apparently characterized by distinct Late Pleistocene glacial history. Indeed, these quantified differences between the obtained glacial chronologies might be useful indicators of spatial and temporal paleoclimatic vari-ability in SE Europe.
The present study aims at the age determination of the subsequent deglaciation phases of the Jablanica Mt. (North Macedonia;Fig. 1),
including the locally largest and smallest glacier extents. Equilibrium line altitudes (ELAs) are estimated using the reconstructed glaciers for each phase. Based on the original data obtained, this study brings new information to the large puzzle of the Quaternary climate history of SE Europe. In addition, these new data will enable a better understanding of the climate pattern in the transition zone between the Mediterranean and Central European areas.
2. The study area
2.1. Geological and geomorphological setting
Jablanica Mt. is a NNW-SSE oriented mountain range, located along the border between Albania and North Macedonia in the central part of the Balkan Peninsula (Fig. 1A, B). It belongs to the Dinaride-Hellenide mountain belt and is composed mostly of Mesozoic sediments overlying Paleozoic metamorphic rocks that are intruded by Jurassic ma fic-ultra-mafic magmatic rocks, with foothills partly covered by Neogene sedi-ments. Morphologically, Jablanica Mt. is divided into three parts, of which the middle part is the highest (Crn Kamen, 2257 m), with a gla-cially sculptured plateau-like crest from which glacial valleys descend mostly eastward.
Primary and secondary cirques were identified in the upper valley parts, which are usually wide and not well developed (Temovski et al., 2018). The glacial valleys are generally steep with several glacial steps and wide U-shaped cross-sections. This suggests that during the most extended glacial phases, the glacial erosion was most effective in the
Fig. 1. The study area. A. location of Macedonia; B location of the Jablanica Mt. (red rectangle). Mountain ranges mentioned in the text are shown by numbers: 1- Velež Mt., 2 – Crvanj Mt., 3 – Durmitor Mt., 4 – Orjen Mt., 5 – Prokletije Mt., 6 – Šar Mts, 7 – Rila Mts, 8 – Pelister Mt., 9 – Galičica Mt., 10 – Pindus Mt., 11 – Olympus Mt., 12 – Chelmos Mt. O – Ohrid Lake, P – Prespa Lake, M– Maliq Lake C. Main glacial-geomorphological features of the studied valleys with the distribution of glacial sediments (modified afterTemovski et al., 2018). Green numbers indicate the locations of photos onFig. 2.
valleys closer to the former ELA (Barr and Spagnolo, 2015). Lateral mo-raines are the best preserved glacial accumulation landforms. Terminal moraines of the younger phases are well preserved, but those related to the older, more extended glaciations were mostly destroyed by subse-quentfluvial erosion.
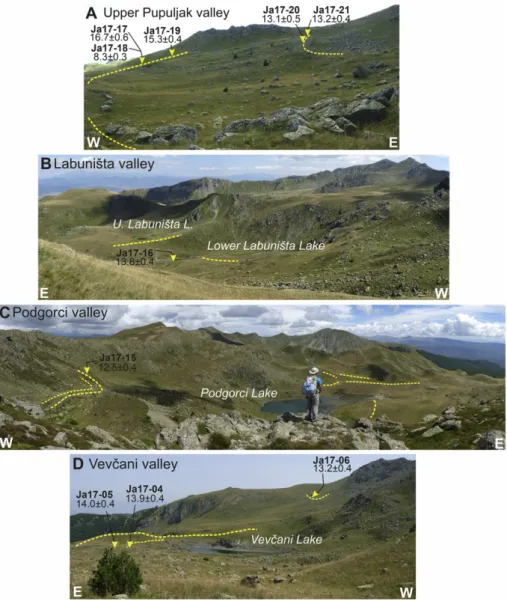
The Jurassic conglomerate crops out only at the crest of the Jablanica Mt. (Fig. 1C). Further down-valley, boulders of this lithology are erratic and prove the glacial origin of a sediment or landform (Dumurdžanov and Ivanovski, 1978;Temovski et al., 2018). Glacial landforms are best preserved in the Vevčani valley and are almost absent in the Pupuljak valley, the northern branch of the upper Labuništa valley, where the presence of Jurassic conglomerates in the cirque area is very limited (Fig. 1C). Glacial sediments were mapped and classified into six chrono-stratigraphic members (Temovski et al., 2018). The deglaciation phases of this study were named after these chronostratigraphic units.
The Vevčani Member is best preserved in the Vevčani valley at eleva-tions of ~1100 m a.s.l. where large (meter-scale) boulders of Jurassic conglomerate are present on the valley side. In the other valleys, blockfields with large angular or subrounded conglomerate boulders are present at similar elevations, suggesting the former extent of the glaciers. The Vevčani Phase is the most extensive glacial stage that could be mapped in the study area.
Lateral moraines of the Kutel Member were mapped in the Vevčani valley and the position of glacier terminations in all three valleys could be tentatively mapped using geomorphological indices like changes in valley slope, and shape. Remnants of the lateral moraines be-longing to the Leništa member were mapped in all valleys, but locations of glacier terminations were estimated as for the previous phase.
Moraines belonging to the subsequent Golina, Lokva and Lincura Phases are better preserved, with the highest moraines located at eleva-tions of 2020–2070 m a.s.l. (Fig. 2).
2.2. Tectonic setting
The Jablanica Mt. is located westward of the still actively developing Ohrid graben that initiated during the Late Miocene and hosts the 285 m deep Ohrid Lake (Lindhorst et al., 2015). It has uplifted, together with the Neogene deposits found along the footwall of the normal faults bounding it to the east, indicating faster uplift during the Pleistocene (Dumurdžanov et al., 2004). As there are no detailed studies on the up-lift rates of Jablanica Mt., it is difficult to provide a reliable estimation of the uplift rate during the Quaternary. Earlier measurements of current uplift rates on Macedonian mountains report values ofN5 mm/a (Lilienberg, 1968), but those values appear to be overestimated. Valley
Fig. 2. Typical landscapes in the upper part of the Pupuljak (A), Labuništa (B), Podgorci (C) and Vevčani (D) valleys. Yellow dashed lines show moraine ridges, yellow triangles indicate the position of the sampled boulders. Bold text is the sample code and normal text is the exposure duration (ka). For position of the photos refer toFig. 1B. Plateau-like morphologies are visualized in above the Labuništa Lakes and to the northwest of the Podgorci Lake (B and C photos, respectively).
incision rates obtained from dated cave deposits in terrains located at topographically much lower elevations and further to the east, in the Crna Reka drainage, range from 0.96 mm/a over the last 83 ka to much lower values of 0.23 mm/a for base levels older than 350 ka (Temovski et al., 2016). At Menikio Mt. in NE Greece, an uplift rate of ~0.5 mm/a for the last 77 ka was estimated based on radiometrically dated cave levels (Pennos et al., 2019). Estimates on Quaternary uplift from Olympus Mt. provide uplift rates between 1.25 and 1.6 mm/a (Smith et al. 1997, last 220–125 ka). Significantly higher uplift rates of N1.8 mm/a over the last ~300 ka were estimated for the Corinth Rift in Greece (Palyvos et al., 2007), albeit this area is located further to the south and in a tectonically more active area. Considering the available regional data, we consider an uplift rate of ~1 mm/a to be a reasonable estimation for Jablanica Mt. at least since the Last Pleistocene. 3. Methodology
3.1. Age determination using in-situ produced cosmogenic10Be
3.1.1. Sample collection
Samples were collected from quartz veins exposed on moraine boul-ders of Jurassic conglomerate using hammer and chisel and a battery-operated angle grinder. The sampled boulders were on or close to the
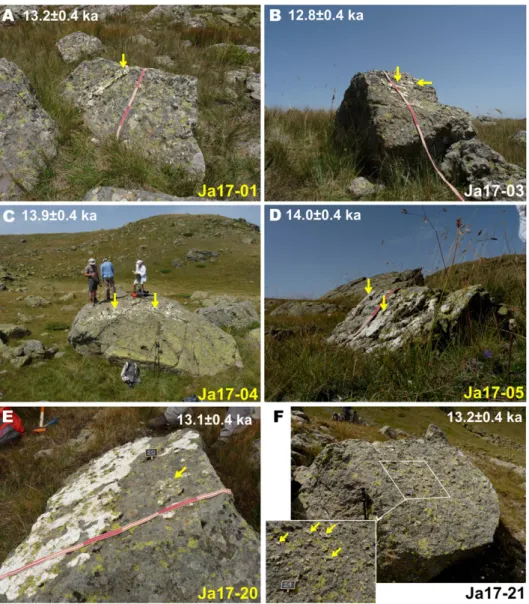
crest of the moraine ridges. Their edges were angular or only slightly blunted. Due to the uncertainties inherent in CRE dating (Balco, 2011), we attempted to collect at least three samples per landform. However, the sampling possibilities were limited by the availability of proper boulders with suitable quartz veins on their upper part. The quartz veins were mostly exposed by fracture surfaces parallel to the vein or by cut surfaces perpendicular to the vein. They were usually standing few cm above the conglomerate surface of the boulder and were fre-quently lichen covered (Fig. 3). The quartz veins were sampled onflat horizontal or inclined top surfaces of the boulders, with strike and dip data recorded (Table S1). Although someflaking of the quartz could not be excluded, the sampled quartz veins were considered to be repre-sentative of the exposure duration of the boulder. The sample position was measured by a hand-held GPS (Garmin eTrex 30). Strike and dip of the samples were measured using hand-held device (Suunto Tandem compass and clinometer). Sample positions and boulder size are pre-sented inTable 1.
Despite that Jurassic conglomerate boulders were observed down to 1100 m in all Vevčani-, Podgorci and Labuništa valleys, sampling from all moraine generations was possible only in the Vevčani valley due to the lack of suitable quartz veins on moraine boulders below ~1900 m a.s.l. in the Podgorci and Labuništa valleys. Moraines were bet-ter preserved in the northern part of the Podgorci cirque. However, the
Fig. 3. Photos of sampled quartz veins on moraine boulders. Samples were taken from the inclinedflat face of the boulders (gentle dip (A), steep (B)) Note that the exposure duration is not a function of the boulder size (large (C), small (D)) and neither of the appearance (massive (E); granular (F)) of the sampled quartz vein. The length of the red and white coloured sections on the tape is 20 cm.
lack of suitable boulders hindered the sampling. The southern part of the cirque is covered by glacial sediments, but these have been entirely reworked by rock glaciers. The highest nested cirques of the Labuništa valley hosted small moraines and protalus ramparts with boulders suit-able for10Be exposure dating. However, no samples could be taken from
between the Strižak and Pupuljak peaks due to the lack of Jurassic con-glomerate and poorly preserved glacial landforms (Fig. 1B).
3.1.2. Laboratory procedures
Sample processing was performed at the Cosmogenic Nuclide Sample Preparation Laboratory of the Institute for Geological and Geochemical Re-search (Budapest, Hungary). Samples were crushed and sieved, and grain size between 0.25 and 1.00 mm was used for age determination. Quartz wasfirst separated using heavy liquids. Chemical sample processing followed the procedures ofMerchel and Herpers (1999)andMerchel et al. (2019). The obtained 90–120 g quartz-enriched sample was chemically etched using HCl-H2SiF6. Pure quartz was dissolved in HF in the presence
of 450μg9Be carrier (0.980 mg/g9Be Scharlab Be standard solution
BE0350100). After having substituted HF by HCl, ion exchange columns (Dowex 1x8 and 50Wx8) were used to extract 10Be (Merchel and Herpers, 1999). Purified BeO was mixed with Nb powder and targets were prepared for AMS (Accelerator Mass Spectrometry) measurement of their10Be/9Be ratios at ASTER, the French national AMS facility located
at CEREGE, Aix en Provence (Arnold et al., 2010). The beryllium measure-ments were calibrated against the ASTER in-house STD-11 standard (10Be/9Be = (1.191 ± 0.013) × 10−11), equivalent to NIST_27900
(Braucher et al., 2015). Analytical uncertainties (reported as 1σ) include uncertainties on AMS counting statistics, on the10Be/9Be ratios of the
stan-dards and on the chemical blank measurements, an external AMS error of 0.5% (Arnold et al., 2010) and the uncertainty of the half-life of10Be. Exter-nal uncertainties include the uncertainty of the production rate. 3.1.3. Calculation of10Be exposure durations
10Be exposure ages were calculated using the time-independentLal
(1991)/Stone (2000)scaling following the equation ofBraucher et al.
(2011)using a sea level high latitude10Be production rate (P SLHL) of
4.01 ± 0.33 at/gr/yr (Borchers et al., 2016) using the 1.387 ± 0.012 Ma half-life of10Be (Chmeleff et al., 2010;Korschinek et al., 2010).
Site-specific production rates were corrected for topographic shielding and self-shielding. Topographic shielding was calculated using a 9 m resolution digital elevation model (DEM) in ArcGIS environ-ment (Codilean, 2006;Li, 2013). The DEM was generated from the 5 m (2009) and from the 20 m (2005) DEM model of the Agency for Real Es-tate and Cadastre of the Republic of Macedonia (Milevski et al., 2013).
Production rates are also corrected for local denudation and uplift rate and snow cover throughout the calculations of CRE durations. Ig-noring these factors introduces a bias of the ages (non-systematic in case of snow cover), and makes comparability of the exposure durations questionable. Accordingly, we consider that it is important to use best possible estimates of the snow cover, uplift and denudation in order to calculate the best estimate exposure age of the dated landforms.
Snow-shielding was calculated based on snow thickness and dura-tion of snow cover derived from a modelled values based on present day meteorological data (Milevski and Ristevski, 2018) (see details is Supplement 1.2 and Table S1). Production rates were not corrected for vegetation cover.
The sampled surfaces exhibited no sign of considerable surface de-nudation. Rock surface denudation rate of 1 mm/ka was considered as an intermediate estimate between 3 mm/ka suggested for granitic boul-ders (Ivy-Ochs et al., 2004) and 0.2 mm/ka value suggested for homoge-neous crystalline rocks (André, 2002) in mid-latitude Alpine environment. An uplift rate of 1 mm/a was considered as the best esti-mate of vertical deformation of the area (seeSection 2.2).
More details on the theory and technical details of age determina-tion and parameters used throughout this study are described in Sup-plement 1.1 and 1.2. Sample parameters and calculated 10Be
production scaling factors appear in Table S1.
For a comparison, all CRE durations were calculated using the time dependent Lal/Stone scaling (Lm;Balco et al., 2008) and the Lifton-Sato-Dunai scaling models (LSD) and its nuclide dependent version
Table 1
Sample data for cosmogenic10Be exposure age determination. All samples were uncovered, except for Ja17-25. This boulder was covered by a 0.5 cm thick organic-rich soil, whose density was estimated at 0.9 g/cm3. In addition, we considered that it was present during half of the exposure duration of the block. *The sample represents the mixture of quartz from 2 adjacent boulders. For more sample data refer to Table S1.
Sample ID Latitude Longitude Elevation Thickness Boulder size (cm)
(°) (°) (m, a.s.l.) (cm) Length Width Height Ja-17-01 41.24642 20.52931 2040 2.5 170 105 45 Ja-17-02 41.24637 20.52929 2047 2.0 510 290 170 Ja-17-03 41.24623 20.52938 2043 1.0 120 95 100 Ja-17-04 41.24515 20.53309 1985 1.7 540 500 180 Ja-17-05 41.24495 20.53343 1981 2.0 110 90 30 Ja-17-06 41.23889 20.53345 2042 1.4 280 240 200 Ja-17-07 41.24614 20.54216 1769 1.0 320 295 70 Ja-17-08 41.2454 20.53955 1808 1.0 395 255 155 Ja-17-09 41.24369 20.54015 1797 2.0 110 100 50 Ja-17-10a 41.24455 20.54183 1781 0.5 255 180 150 Ja-17-10b 41.24458 20.54189 1776 1.0 170 120 100 Ja-17-11* 41.24648 20.54497 1737 0.6 270 (240) 210 (240) 110 (150) Ja-17-12 41.2466 20.54527 1729 1.3 220 140 105 Ja-17-13 41.24544 20.55548 1543 0.9 900 480 280 Ja-17-14a 41.24562 20.55622 1547 0.3 850 250 600 Ja-17-14b 41.24575 20.55601 1548 0.2 500 500 320 Ja-17-15 41.25518 20.51802 2027 0.6 230 180 130 Ja-17-16 41.26883 20.52012 1904 2.2 190 160 110 Ja-17-17 41.27422 20.51482 2040 1.3 260 170 120 Ja-17-18 41.27422 20.51482 2040 3.0 140 130 100 Ja-17-19 41.27396 20.51475 2045 0.7 160 165 100 Ja-17-20 41.27348 20.51338 2069 1.1 170 170 80 Ja-17-21 41.27308 20.51343 2080 0.7 240 160 110 Ja-17-22 41.27121 20.51544 2037 1.5 250 110 50 Ja-17-23 41.271 20.51554 2035 0.5 290 255 155 Ja-17-24 41.27112 20.51553 2035 0.9 180 155 65 Ja-17-25 41.24298 20.57626 1115 3.2 275 225 215
(LSDn;Lifton et al., 2014), using three online calculators: the Cosmic Ray Exposure Program (CREp;Martin et al., 2017), the Cronus-Earth on-line calculator version 3 (CronusV3;Balco et al., 2008) and the Cronus-Earth Web Calculator version 2.0 (CronusWeb;Marrero et al., 2016). All calculators were set to use the most recent calibration dataset and the ERA-40 atmosphere model, and the Geomagnetic database ofLifton et al. (2014)orLifton (2016)(for more details refer to the Table S3a–c). All calculators were accessed in July 2019.
Previously published10Be exposure ages fromŠar and Rila Mts (Kuhlemann et al., 2009, 2013) and Pelister Mt. (Ribolini et al., 2017) were re-calculated applying the same scaling scheme and reference production rate, as those applied for the calculation of CRE durations of samples from the Jablanica Mt., for maximum comparability. For de-tails refer to Supplement 1.3 and Table S4.
3.1.4. Calculation of the most probable age of deglaciation phases Individual CRE durations were grouped according to the mapped morphostratigraphical units (Temovski et al., 2018) (Figs. 1B, 4). Where several samples belong to a group the coherence of their esti-mated CRE age was tested using the reduced χ2 test (Ward and
Wilson, 1978). This method enables the identification of outliers until the examined group of data contains only CRE durations that are not sig-nificantly different considering associated 1σ uncertainties (68% confi-dence interval). The CRE age groups that satisfied the reduced χ2test
were analysed using cumulative probability distribution function (PDF) plots (or camelplots) of the sum of the individual Gaussian distri-butions (“Camelplot” MATLAB code;Balco, 2009). This method was ap-plied to provide the most probable CRE age of the landform and to quantify the scatter of individual CRE durations of the boulders. The
10Be exposure ages of the moraine stabilization correspond to the
most probable values of the studied distributions and the associated un-certainties to the 68% confidence interval (±1σ) of each PDF plot. 3.2. Glacier reconstruction and calculation of the equilibrium-line altitudes (ELAs)
Former glaciers were reconstructed based on the previously mapped glacial landforms and sediments (Temovski et al., 2018). Where glacial landforms were fragmentary or missing (especially terminal moraines), the estimated position of glacier terminations relied on the valley to-pography and extent of glacial sediments. The glacier thickness was es-timated using a semi-automated GIS-based method (GlaRe,Pellitero et al., 2016), using the 9 m Digital Elevation Model (DEM) of the study area (Milevski et al., 2013). The GlaRe toolbox generates the ice thickness from the modern bed topography applying physical laws of iceflow along a user defined flowline (Benn and Hulton, 2010). The glacier thickness can be adjusted to geomorphic markers by varying the basal shear stress value (τb). The most accepted values of theτbvary within
Fig. 4. Glacial landforms of the middle part of the Jablanica Mt.10
Be exposure durations and sample sites. CRE durations in white boxes were accepted, and those with grey shadow were omitted from further interpretation of the deglaciation of the study area as outliers.
the ~50–150 kPa range with possible increase to 190 kPa (Nye, 1952; Weertman, 1971;Vieira, 2008). In this study, glacier thickness was tuned byτbvalues of 160 kPa for the most extended phase and down
to 30 kPa for the smallest glaciers (Table S5).
In order to best reproduce their surface morphology, the glaciers were reconstructed using a combination of the manual and semi-auto-mated methods (Zasadni and Kłapyta, 2014). The glacier thickness along theflowline calculated by the GlaRe toolbox was extended man-ually to the valley sides taking into account their typical, slightly con-cave and slightly convex shape above and below the ELA, respectively (Sissons, 1974).
The reconstructed glaciers were used for the calculation of the for-mer ELAs by means of the ELA Calculation toolbox (Pellitero et al., 2015) and applying the accumulation-ablation balance ratio (AABR) method. This method relies on the accumulation and ablation gradients of the reconstructed glacier. The balance ratio of 1.6, the bestfitting value for the current conditions in the European Alps (Rea, 2009), was adopted for this study, assuming as potentially representative for the glaciated Jablanica Mt. The paleo-ELAs estimated by AABR method en-able regional comparisons with other studies, where the same ELA cal-culation method was applied.
4. Results
4.1. Results of cosmic ray exposure dating and outlier identification The measured10Be concentrations ranged from (100.9 ± 3.6) × 103
at/grSiO2to (447.3 ± 12.7) × 103at/grSiO2with one exceptionally high
value at (1271.2 ± 30.8) × 103at/gr
SiO2. The calculated CRE durations
with corrections for surface denudation, uplift and snow shielding are considered as the best estimates of the exposure age of the dated land-forms. In the following these ages will be discussed, and those calcu-lated with no corrections are shown inTables 2and S2.
The calculated CRE ages varied between 8.2 ± 0.2 ka and 95.4 ± 2.4 ka (Table 2). Most of the 25 CRE durations were between 17.4 ± 0.4 ka and 12.0 ± 0.4 ka, two samples leading to significantly younger and two others to significantly older exposure ages. The underestimated CRE durations are probably due to unnoticed chipping of the quartz veins, or boulder toppling after moraine stabilization (Ja17-18 and -25). Unfortunately, the single sample representing the most extended glacial stage (Vevčani Phase) must be considered as a young outlier re-garding its morphostratigraphic position (Table 2,Figs. 1C,4).
The significantly older CRE ages of Ja17-09 and Ja17-24 compared to the relevant set of CRE results suggest the presence of inherited cosmo-genic10Be nuclides (Table 2). These samples were omitted from the age determination of deglaciation phases.
Three samples (Ja17-13, -14A, -14B) were taken from large boulders of the lateral moraine of the second largest glacial phase (Kutel Phase) in the Vevčani valley providing10Be exposure durations between 17.4
± 0.5 ka and 16.6 ± 0.5 ka (Figs. 3, 4).
Four boulders were sampled on the well-preserved lateral moraine interpreted as the subsequent deglaciation phase (Leništa Phase, Ja17-07, -08, -11, -12). Three CRE durations are clustered in the range from 16.5 ± 0.6 ka to 15.8 ± 0.5 ka while one boulder leads to a significantly younger exposure age (Ja17-07; 12.8 ± 0.4 ka). It is subsequently con-sidered as an outlier.
In the Vevčani valley, the next deglaciation phase (Golina Phase) is represented by a well-expressed moraine ridge, interpreted as a medial moraine. The left lateral moraine of this phase has apparently been merged with the lateral moraine of the previous phase (Fig. 4). Two samples from two adjacent boulders at the lower end of the medial mo-raine (Ja17-10A, -10B) that could be used to constrain its stabilization age lead to CRE durations of 16.4 ± 0.5 ka and 15.1 ± 0.5 ka.
Based on their morphostratigraphic position the terminal moraines of two small nested cirques (~2040 m a.s.l.) in the Labuništa valley (Pupuljak valley;Figs. 2A,4) were assigned to the last deglaciation
Table 2
Measured10Be concentrations and calculated surface exposure durations. Outliers are shown in italic. The measured AMS ratios were corrected for full processed blank ratios: (2.03 ± 0.15) × 10−14for samples Ja17-01 to -09; (3.86 ± 0.49) × 10−15for samples Ja17-10a to -16 and (3.41 ± 0.39) × 10−15for samples Ja17-17 to -25. Age uncertainties: the 1st number is the analytical and half-life uncertainty (1σ) and the 2nd number (in parenthesis) includes the uncertainty of the reference production rate. The corrected ages printed in bold are discussed in this study. Outliers are printed in italic. For more cosmogenic nuclide data refer to Table S2.
Sample ID
10
Be concentration (at/grSiO2) (blank corrected)
Exposure duration (ka)
Exposure duration (ka) Morphostratigraphy No correction Corrected for surface denudation (1 mm/ka) and uplift (1 mm/ka) and
snow shielding Ja-17-01 233,476 ± 7150 12.8 ± 0.4 (1.1) 13.2 ± 0.4 (1.2) Lincura Ja-17-02 214,622 ± 6173 11.7 ± 0.3 (1.3) 12.0 ± 0.4 (1) Lincura Ja-17-03 219,295 ± 7252 12.4 ± 0.4 (1.4) 12.8 ± 0.4 (1.1) Lincura Ja-17-04 244,929 ± 7446 13.6 ± 0.4 (1.5) 13.9 ± 0.4 (1.2) Lokva Ja-17-05 229,200 ± 6943 13.5 ± 0.4 (1.5) 14.0 ± 0.4 (1.2) Lokva Ja-17-06 238,800 ± 6992 12.9 ± 0.4 (1.4) 13.2 ± 0.4 (1.2) Lincura Ja-17-07 191,568 ± 5896 12.4 ± 0.4 (1.4) 12.8 ± 0.4 (1.1) Leništa Ja-17-08 199,817 ± 5870 15.4 ± 0.5 (1.7) 15.8 ± 0.5 (1.4) Leništa Ja-17-09 1,271,173 ± 30,762 83.4 ± 2.0 (9.2) 95.4 ± 2.4 (8.2) Golina Ja-17-10a 242,114 ± 6779 15.8 ± 0.4 (1.7) 16.4 ± 0.5 (1.4) Golina Ja-17-10b 222,602 ± 6689 14.7 ± 0.4 (1.6) 15.1 ± 0.5 (1.3) Golina Ja-17-11 239,779 ± 7966 16.0 ± 0.5 (1.8) 16.5 ± 0.6 (1.5) Leništa Ja-17-12 225,509 ± 6279 15.9 ± 0.4 (1.8) 16.4 ± 0.5 (1.4) Leništa Ja-17-13 182,311 ± 5611 16.3 ± 0.5 (1.8) 16.7 ± 0.5 (1.5) Kutel Ja-17-14a 202,431 ± 5730 16.9 ± 0.5 (1.9) 17.4 ± 0.5 (1.5) Kutel Ja-17-14b 196,330 ± 5776 16.0 ± 0.5 (1.8) 16.6 ± 0.5 (1.5) Kutel Ja-17-15 204,462 ± 6096 12.1 ± 0.4 (1.3) 12.5 ± 0.4 (1.1) Lincura Ja-17-16 194,776 ± 6072 13.2 ± 0.4 (1.5) 13.8 ± 0.4 (1.2) Lokva Ja-17-17 298,875 ± 10,957 16.0 ± 0.6 (1.8) 16.7 ± 0.6 (1.5) Golina Ja-17-18 147,582 ± 4904 8.0 ± 0.3 (0.9) 8.3 ± 0.3 (0.7) Golina Ja-17-19 248,427 ± 6606 14.8 ± 0.4 (1.6) 15.4 ± 0.4 (1.3) Golina Ja-17-20 235,657 ± 7877 12.6 ± 0.4 (1.4) 13.1 ± 0.4 (1.2) Lincura Ja-17-21 238,539 ± 7028 12.7 ± 0.4 (1.4) 13.2 ± 0.4 (1.2) Lincura Ja-17-22 267,907 ± 8108 14.7 ± 0.4 (1.6) 15.3 ± 0.5 (1.3) Golina Ja-17-23 246,606 ± 8656 14.4 ± 0.5 (1.6) 14.9 ± 0.5 (1.3) Golina Ja-17-24 447,312 ± 12,696 25.0 ± 0.7 (2.8) 26.5 ± 0.8 (2.3) Golina Ja-17-25 100,927 ± 3578 11.2 ± 0.4 (1.2) 11.4 ± 0.4 (1) Vevčani
stage (Temovski et al., 2018). The determined CRE durations argue against this preliminary geomorphological classification. Four out of six samples taken on these moraines (Ja17-17, -19, -22, -23) provide
10Be CRE ages between 16.7 ± 0.6 ka and 14.9 ± 0.5 ka, corresponding
to the age range of the Golina Phase and Lenista Phases in the Vevčani valley.
The type locality of the Lokva Member is the frontal moraine at the Vevčani Lake at 1980 m a.s.l. (Figs. 2D,4) Two samples (Ja17-04, -05) taken from this landform lead to CRE durations of 13.9 ± 0.4 ka and 14.0 ± 0.4 ka, respectively.
At the Lower Labuništa Lake (~1930 m) a single boulder (Ja17-16) from the lower part of the frontal slope of the terminal moraine yield a CRE duration of 13.8 ± 0.4 ka (Figs. 2B,4).
In the nested cirques of the Vevčani and Podgorci valleys, the10Be
exposure data quantified the stabilization age of the moraines between 13.2 ± 0.4 ka and 12.0 ± 0.4 ka (~2030–2050 m a.s.l.; Ja17-01, -02, -03, -06, -15), that is during to the youngest Lincura Phase. In the Labuništa valley, two samples from a protalus rampart (Ja17-20, -21, ~2075 m a.s. l.) lead to similar ages (Figs. 2A, D,4,Table 2).
4.1.1. Cosmic ray exposure age estimates using online calculators and time dependent scaling models
Using the time dependent Stone scaling (Lm) the online calculators provided 1% older (CREp, Table S3c) to 3% younger (CronusV3, Table S3a) exposure durations on average, compared to the values calculated using the time independent Lal/stone scaling and Eq. (1) of Braucher et al. (2011) as described inSection 3.1.3(Tables 2, S2). Estimations using the LSD scaling provided 2–4% older exposure age on average (CREp and CronusWeb, Table S3c,b). Exposure durations using the LSDn scaling scheme were 1% younger (CronusV3, Table S3a) or 4% older (CronusWeb, Table S3b) on average, compared to our calculations. When exposure durations were calculated using the time-invariant Lal/Stone scaling, the difference between our estimates and the calcula-tors' remained under 1% (CronusV3; CronusWeb; Tables S3a,b). As these results remain within uncertainties the exposure ages calculated following Braucher et al. (2011) and using the time independent Lal/ Stone scaling are discussed in this study (Table 2).
4.2. Recalculated10Be exposure ages of glacial landforms in the Central
Balkan Peninsula
The recalculated CRE ages of the Pelister Mt. resulted to be 2–4% older, those of theŠar Mts 6–15% older compared to the ages in the orig-inal studies. For the Rila Mts (Bulgaria), the recalculated10Be exposure
ages resulted to be 2–14% older than the originally published values (Table S4).
However, the applicability of the datasets from theŠar and Rila Mts (Kuhlemann et al., 2009, 2013) for a regional comparison is limited due to the poorly described geomorphological settings and large age dis-crepancies within the datasets. Therefore from theŠar Mts only the recalculated CRE age of 22.1 ± 1.6 ka (Table S4) corresponding to the sample S11 of the most extended glacial phase is used for further discus-sion in this study.
The unusually high uncertainties (13–44%) of the measured10Be
concentrations of the dataset from the Rila Mts and poorly documented geomorphological setting of the dated landforms allows only tentative conclusions to be drawn. The recalculated dataset suggests that the most extended glacial phase occurred between 24.6 ± 8.1 ka and 16.9 ± 4.4 ka, thus it can be attributed most probably to the LGM.
4.3. Glacier reconstruction and ELAs
In the following, a brief summary of the most important parameters for the glacier reconstruction are provided. At some locations, the pre-liminary morphostratigraphic classification of the moraines based on geomorphic position and stratigraphy (Temovski et al., 2018) had to
be modified in the light of the obtained CRE exposure durations. Appar-ently, the glaciers in the Labuništa valley were shrinking more rapidly than those of the Podgorci and Vevčani valleys. In the Pupuljak valley glaciers retreated to their cirques already during the Golina Phase (~15 ka) while in the other valleys such a retreat occurred with 1–2 thousand years delay. These diachronous ages of the moraines of the cirque glaciers could not have been revealed based on geomorphologi-cal and sedimentologigeomorphologi-cal observations.
Glaciers in the studied valleys of the central Jablanica Mt. reached their maximum extent, down to ~1100 m a.s.l. during the Vevčani Phase. The reconstructed glacier systems occupied an area of 20.7 km2, the longest glacier in the Labuništa system being of 8.7 km long. The estimated ELAs at this phase varied between 1786 m and 1812 m, averaging at 1792 m (all elevations are above sea level) (Fig. 5A, Table S5).
The area covered by glaciers shrank to 12.4 km2by the subsequent
Kutel Phase, with a maximum glacier length being 4.2 km. The former large glacier systems were disintegrated into smaller glaciers. The calcu-lated ELAs of the reconstructed glaciers varied between 1908 and 1931 m, with a mean ELA of 1918 m (Fig. 5B, Table S5).
The fast retreat of the glaciers continued and the glacier surface dur-ing the Leništa Phase was reduced to 5.6 km2
. Seven glaciers were pres-ent in the studied valleys during this phase, among which the largest was 2.5 km long. The mean ELA was 1983 m, with ELAs of the individual valleys varying between 1948 m and 2035 m (Fig. 5C, Table S5).
During the Golina and Lokva Phases, glaciers occupied an area of 3.2 and 1.3 km2, respectively. Some glaciers have disappeared and others
were further divided during these stages. Seven glaciers were present in the Golina Phase with a maximum length of 1.64 km. The largest among the six glaciers of the Lokva Phase was 0.97 km long. The mean ELA of the Golina Phase was 2054 m, with ELAs between 2003 m and 2104 m. The ELAs varied between 2050 and 2078 during the Lokva Phase, averaging at 2065 m (Fig. 5D,E, Table S5).
During the Lincura Phase, glaciers on the northern part of the study area have disappeared, or were tiny ice masses retreated to the nested cirques. Their area was only 0.5 km2, and their length did not exceed
0.54 km. The calculated ELAs vary between 2077 m and 2121 m, with a mean of 2096 m (Fig. 5F, Table S5).
5. Discussion
5.1. Last deglaciation of the central Jablanica Mt. in the light of the regional data
5.1.1. The most extensive glaciation
Glaciers of the central Jablanica Mt. reached their maximum extent during the Vevčani Phase (Fig. 5A). Unfortunately, the single boulder that could be sampled at its termination in the Vevčani valley (~1100 m a.s.l.) led to an anomalously young age. However, the morphostratigraphic position under the moraines of the subsequent Kutel Phase allowed to assign a minimum age of ~17 ka for this stage. Based on a preliminary evaluation of the regional paleo-ELA pattern, a MIS 6 age was proposed for the Vevčani Phase (Temovski et al., 2018) because its ELA estimate of 1792 ± 18 m a.s.l. is close to the ELA values calculated for MIS 6 in the Durmitor (1784 m,Hughes et al., 2011) and Prokletije Mts (1750 m,Milivojević et al., 2008).
However, the ~1792 m ELA of the Vevčani Phase is between the values published for the coastal and inland areas for the LGM. The low-est LGM ELA of 1456 m was reported in the coastal Orjen Mt. (Hughes et al., 2010), which like today probably received the largest amount of pre-cipitation. For the inner ranges, the LGM ELA was estimated between 1942 m (Prokletije Mts,Milivojević et al., 2008) and ~2200 m a.s.l. (Rila Mt.,Kuhlemann et al., 2013). These ranges are located at a distance from the coast comparable to that of Jablanica Mt. Accordingly; on the one hand, the lower ELA estimated for the Vevčani Phase could be used to argue for its older, MIS 6 age. On the other hand, the validity
of this link based solely on ELA estimates is questionable for at least two reasons: (1) the ELAs can be highly variable in space, even at a local scale (Boxleitner et al., 2019) and (2) in several cases the
geochronological constraints of the glaciations are weakly defined (geo-morphological considerations only (e.g., Prokletije Mt.,Milivojević et al., 2008), CRE duration from a single boulder on a single landform
Fig. 5. Reconstructed glaciers and probability density distributions of CRE ages relevant for each glacial phase. (A) Vevčani Phase, (B) Kutel Phase, (C) Leništa Phase, (D) Golina Phase, (E) Lokva Phase, (F) Lincura Phase. The red lines on the reconstructed glaciers indicate the contour line corresponding to the estimated ELAs. Most probable10Be exposure ages are presented on the camelplots. The calculated mean ELAs (using AABR 1.6) are plotted under the camelplots. The red dots indicate the sample sites. The legend for the glacial landforms as inFig. 4. Note that the light to dark blue colouring of the glaciers is just for better visualization, the colours do not indicate a specific elevation.
extrapolated to the entire range (Šar Mts,Kuhlemann et al., 2009), poorly constrained chronostratigraphic framework (Šar, Rila MtsKuhlemann et al., 2009, 2013). These shortcomings make glacier age estimation based merely on calculated ELAs problematic. Additionally, the diverse ELA cal-culation methods (mostly AAR and AABR) used by the cited studies, may increase the scatter of the reported ELAs. Nevertheless, while the chronol-ogy of the glacier advances is weakly constrained, the uncertainties intro-duced by the different ELA calculation methods remain of secondary importance, and thus are not accounted for in this study.
Based on previous studies, the timing of the maximum ice extent in and around the central Balkan Peninsula is widely variable. The oldest estimates place the largest glaciers to MIS 12 (Pindus, Orjen, Durmitor Mts; U-Th dating;Hughes et al., 2007, 2010, 2011) with the lowest ELA estimates at the Adriatic coast, in the Orjen (1256 m; a.s.l.), and somewhat higher values were estimated in the Durmitor (1607 m) and Pindus (1741 m) mountains. The maximum ice extent was attrib-uted to the MIS 8 in the Olympus Mt. (U-Th dating;Smith et al., 2006) and to MIS 4 in the Prokletije Mt. (geomorphological mapping; Milivojević et al., 2008). Other studies suggested that glaciers reached their maximum extent during the LGM (Šar, Rila; Mts;10Be exposure
dating;Kuhlemann et al., 2009, 2013).
The geochemical data from the Pleistocene sedimentary sequence of Ohrid Lake imply that more severe glacial conditions prevailed in the catchment of the lake during MIS 16, 12, 10 and 6 compared to MIS 2 (Francke et al., 2016). Therefore, it still remains an open question whether MIS 2 (LGM) was the most extensive glaciation in the central Balkan Peninsula (Kuhlemann et al., 2009, 2013), or MIS 6 or older gla-ciations, as reported along the western coast of the peninsula (Pindus, Orjen, Durmitor Mts).
Two geomorphological arguments might support the LGM age of the most extensive glaciation (Vevčani Phase) in the Jablanica Mt.: (1) An LGM glacier advance was reported in studies, which proposed to assign the largest phase to Middle Pleistocene glaciations (Hughes et al., 2007, 2010, 2011). Therefore, an LGM glacier advance most probably occurred in the Jablanica Mt. as well. If the Vevčani Member belonged to MIS 4 or an older glaciation, there would be no space left for an LGM glacier ad-vance (Fig. 5A, B). (2) The limited number and extent of mapped glacial features of the second largest Kutel Phase suggest that postglacial denu-dation has efficiently destroyed the majority of the glacial landforms over the last ~17 ka. Accordingly, it is highly probable that remnants of glacial landforms at ~1100 m a.s.l. in the narrow lower valleys of the Jablanica Mt. would have been completely destroyed if exposed to erosion for several tens of thousands of years.
Nevertheless, despite that apparently no geomorphological evidence of past glaciers overriding the moraines of the Vevčani Phase was pre-served in the Jablanica Mt., it is possible that glaciers of pre-LGM glacia-tions had a similar or larger maximum extent compared to the ice streams of the Vevčani Phase. Conversely, it cannot be excluded that moraines of the Vevčani Phase are older than LGM. In this case, LGM moraines must have been overridden by glaciers of the Kutel Phase and therefore are absent from the current geomorphological record.
Finally, it is worth mentioning that the locally largest ice extent of the nearby Velež and Crvanj Mts in the southeastern part of the coastal Dinarides was dated at 14.9 ± 1.1 ka and 11.9 ± 0.9 ka, respectively (36Cl exposure dating;Žebre et al., 2019). Their estimated ELAs were
among the lowest reported values: 1388 m and 1541 m, respectively. The recalculation of these36Cl ages using the36Cl production rate by
spallation of Ca from the calibration site at Mt. Etna (Schimmelpfennig et al., 2011) would result in ~10% older ages. These relatively young ages (even if recalculated) for the maximum ice extent are unusual in the region and cannot be synchronized neither with the deglaciation stages of the Jablanica Mt., or with any other regional record.
5.1.2. Glacier retreat during thefirst part of the Lateglacial
The most probable CRE age of the second largest, Kutel Phase is 16.8+0.8/
−0.5ka and the moraines belonging to the subsequent Leništa
Phase stabilized at 16.3+0.6/
−0.6ka (Fig. 5B, C). These glacial phases of
the Jablanica Mt. may correspond to the colder glacial conditions during the late Greenland Stadial 2 (GS-2;Fig. 6A, B). A glacial stage corre-sponding to the Kutel Phase is currently not known from the surround-ing mountains, however, extensive glaciation phases reported from the Iberian mountains show remarkable coincidence (Palacios et al., 2017). The PDF curve of the CRE ages of moraines assigned to the Golina Phase shows a bimodal pattern (Fig. 5D). Therefore, the samples be-longing to the two peaks were treated separately. The older peak at 16.5+0.6/
−0.5ka is in agreement with the most probable age assigned
to the preceding Leništa Phase suggesting that development of these landforms was initiated already during the previous glacier advance. The younger peak at 15.2+0.5/
−0.5ka is considered as the stabilization
age related to the Golina Phase. The landforms connected to these phases are situated in close proximity in the Vevčani valley, supporting that they might have been active during both glacial phases. The most probable CRE age (from recalculated data ofRibolini et al., 2017; Table S4) of a single dated moraine, locally the youngest in the Pelister Mt. is 15.8+0.5/
−0.6ka. This age is between, overlapping within error with
both the Leništa and Golina Phases identified in Jablanica Mt. (Fig. 6). The most probable age of the stabilization of the Golina Phase corre-sponds to thefirst Lateglacial moraine stabilization dated at ~15.5 ka in Mt. Olympus (Styllas et al., 2018). Some of the data from theŠar and Rila Mts (Kuhlemann et al., 2009, 2013) also fall in this period.
Fig. 6. CRE dated deglaciation stages in Macedonian mountains during the Lateglacial compared to regional paleoclimate indicators. (A): Theδ18
O stratigraphy of the Greenland Ice Sheet (GICC05ext chronological framework;Andersen et al., 2006;
Rasmussen et al., 2006). B: event stratigraphy (stadial-interstadial) in the North Atlantic region for the Last Glacial-Interglacial Transition (Lowe et al., 2008) (C): CRE ages of glacial landforms in North Macedonia; (D) and (E): mean winter precipitation and mean temperature of the warmest month inferred from pollen records from Maliq Lake (Bordon et al., 2009), respectively. For comparability, all ages were converted to BP timescale (meaning before 1950 CE).
However, the poorly described geomorphological context hinders more advanced interpretation.
During thefirst part of the Lateglacial the estimated ELA values in-crease from 1918 ± 10 m to above 2000 m (Fig. 5B–D). The largest scat-ter of the ELA values was observed during the Leništa and Golina Phases, for which the glacier retreat in some valleys was apparently faster than in other valleys (Fig. 4, Table S5). Our CRE dating results suggest that the elevation of glacier termination, the size of the reconstructed glaciers and the calculated ELAs can be variable at a local scale. These scatter well within the range found for stratigraphically correlated moraines in the central Alps for the Lateglacial and Early Holocene stages (Boxleitner et al., 2019). Similar results were published for the Western Alps, where several hundred meters of difference in the calculated ELAs of glaciers occupying cirques of the same or neighbouring glacier sys-tems was reported (Hofmann et al., 2019).
5.1.3. Thefinal deglaciation
In the Jablanica Mt. the most probable CRE age of the last Lokva and Lincura Phases is ~13.9+0.4/
−0.4ka and 13.0+0.4/−0.9ka, respectively
(Fig. 5E, F). The CRE durations of two boulders (Ja17-21 and -21; 13.1 ± 0.5 ka and 13.2 ± 0.4 ka) sampled on a protalus rampart suggest that this landform most likely co-existed with the small cirque glaciers during the Lincura Phase. The estimated ELAs during these phases are 2065 ± 15 m and 2096 ± 18 m, respectively (Fig.5E, F, Table S5).
Determining the age of the last glacier advance was attempted at several locations in the region and resulted in contradictory results for the chronology of the last deglaciation. It was dated to the LGM in the Pindus Mt. (Hughes et al., 2007), to the Lateglacial in the Pelister Mt. (Ribolini et al., 2017) and around the Younger Dryas in the Orjen Mts (Hughes et al., 2010),Šar Mts (Kuhlemann et al., 2009), Galičica Mt.; (Gromig et al., 2018). In the highest ranges of the Balkan Peninsula small glacier advances were recorded even during the Holocene (Olym-pus Mt.:Styllas et al., 2016, 2018; Prokletije:Hughes, 2010; Durmitor: Hughes, 2007; Pirin:Gachev et al., 2016).
A moraine at 2230 m in the Pelister Mt., geomorphologically belong-ing to the locally last glacial phase, was dated to 15.8+0.5/
−0.6 ka
(Ribolini et al., 2017, recalculated by this study, Table S4). This re-eval-uated age is more comparable to the earlier stages of the deglaciation, while the ELA estimated for this glacier seems to be surprisingly high (2250 m a.s.l.), more like the younger glacial stages in the area. Due to the lack of information about ages of the other glacial landforms in the Pelister Mt., deciphering a more detailed glacial history is impossible.
The recalculated36Cl exposure age of 14.0 ± 1.8 ka (Styllas et al.,
2018) associated to the second to outmost moraine ridge of the land-form attributed to the last glacial stage of Galičica Mt. (Ribolini et al., 2011;Gromig et al., 2018) coincides with the Lokva Phase (Fig. 6C). This recalculation was done using the36Cl production rate by spallation
of Ca from the calibration site at Mt. Etna (Schimmelpfennig et al., 2011), the closest36Cl calibration site. This36Cl production rate is
~20% lower than the one applied by the CronusWeb calculator used in the original study (Gromig et al., 2018). As a result, the recalculated age is ~14% older than the previously published age (12.0 ± 0.6 ka) from which a Younger Dryas glacial stabilization was suggested for the Galičica Mt. The critical evaluation of the36Cl production rates is beyond
the scope of this study. However, considering the geographical proxim-ity and similar orientation of the dated moraines in Pelister and Galičica Mts, the ~12 ka age of the moraine in the Galičica Mt. appears to be less likely than the recalculated value of ~14 ka. Similarly, the geomorpho-logical position and ~14 ka age of the dated moraine in the Galičica Mt. seems to be in agreement with the penultimate, Lokva Phase re-corded on the Jablanica Mt. (Fig. 6).
5.2. Implications for paleoclimate
The reconstructed sequence of glaciological events in the Jablanica Mt. can be examined in relation to the paleoclimatic context in order
tofind a link between past temperature and precipitation conditions and phases of glacier stabilization during the deglaciation. The recon-struction of climatic events on millennial or sub-millennial timescale using10Be exposure ages might be problematic due to the relatively
large uncertainties of the method. Here the paleoclimate record is used tofind the period favourable for ice accumulation within the time interval of CRE dated glacial phases. Using this information in some occasions it was possible to narrow of the CRE age range, and link certain glacial stages to a certain climate phase, which would not have been possible using merely the CRE data.
Between 17.1 ka and 15.7 ka typical stadial conditions were recon-structed using sedimentological and geochemical proxies in the nearby Lake Prespa Lake (Aufgebauer et al., 2012). Over the same period, the pollen record in the MD90-917 core from the Adriatic Sea (Combourieu-Nebout et al., 1998) evidenced an increased proportion of steppe vegetation with a decrease of temperate vegetation, also sug-gesting stadial conditions (Bazin et al., 2019). In the Jablanica Mt. the glacier stillstands or re-advances of the Kutel and Leništa Phases were dated to this period. These glacial phases were most probably associated to periods of glaciologically stable mass balance regulated by cool sum-mer temperatures (Fig. 6). This cold period corresponds to the GS-2 (Fig. 6).
Snow accumulation and thermal conditions during the ablation sea-son are the key climatic drivers of the glaciological mass balance (Ohmura et al., 1992). Pastfluctuations of winter precipitation and mean temperature of the warmest month were derived from the pollen assemblages along sedimentary sequences from the Maliq Lake, located in close proximity to the Jablanica Mt. (b70 km,Fig. 1) (Bordon et al., 2009). They provide independent information about the local fluctua-tion of the key climatic drivers of the glaciological mass balance in the region after ~16 ka (Fig. 6D, E). The trend of the changes of these param-eters is considered as good estimates of the conditions also in the Jablanica Mt.
Although the GS-2 stadial lasted until ~14.5 ka, the local, pollen-based record implies that warming in the region of the Jablanica Mt. al-ready started at ~15 ka (Fig. 6B, E). Glacier stabilization during the Golina Phase (~15.2 ka) can be explained by a positive glaciological mass balance due to the relatively low summer temperatures and in-creasing winter accumulation as reconstructed for this time period (Fig. 6D, E). This is suggested to be the last glacier re-advance that cor-responds to GS-2 in the region. Although the pollen records of Maliq Lake do not show changes in the local climatic drivers that would lead to increased snow accumulation around the Lokva Phase (~14 ka), it might correspond to a slight cooling related to a colder stage within the Greenland Interstadial-1 (GI-1d;Fig. 6A).
According to the pollen records of Maliq Lake, there was a period be-tween ~13.3 and 13.0 ka during which a small drop in temperature oc-curred with the winter precipitation remaining unchanged (Fig. 6D, E). The moraines of the Lincura Phase are interpreted as resulting from the halt in the glacier recession caused by these cooler and wetter climate conditions. This period might be the regional paleoclimate response corresponding to the large-scale cooling during GI-1b.
The climate deterioration during GS-1 (also known as Younger Dryas) initiated a well-known glacial advance across the Atlantic realm (Carlson, 2013). The pollen-based local paleoclimate reconstruc-tions (Bordon et al., 2009) suggest that during this period the remark-able temperature drop was coupled with dry winters, which is unfavourable for glacier expansion. The 13.0+0.4/
−0.9ka most probable
exposure age of moraines of the last glacier advance in the Jablanica Mt. does not enable to differentiate between GS-1 and GI-1b. However, the local paleoclimate conditions were more favourable for glacier ex-pansion during the GI-1b, assigning this period more probable for the last glacier advance in the study area. Despite the cold temperatures, the strong decrease of winter precipitation in the area during the GS-1 (Fig. 6D, E) rendered this phase climatically unfavourable for snow ac-cumulation. This might explain the lack of a noticeable phase of glacier
stabilization following 13 ka in the Jablanica Mt. However, in more coastal settings moraines attributed to the Younger Dryas were re-ported (Orjen, Durmitor:Hughes et al., 2010, 2011; Prokletije Mts: Milivojević et al., 2008).
6. Conclusions
Despite the suboptimal lithological conditions, the geochronological results validate the assumption that quartz veins represent pristine boulder surfaces relevant for determining the age of moraines stabiliza-tion in the Jablanica Mt.
The age of the locally most extended glaciation isN~17 ka, as inferred from the age of the second largest glacial phase in the Jablanica Mt. The LGM age of this glacier advance is supported by geomorphological and geochronological considerations, although it is probable that glaciers of the same size or larger existed during previous glaciations (MIS 6, 12). The CRE ages of the dated landforms connected tofive subsequent deglaciation phases suggest that the glacier recession took place be-tween ~17 ka and ~13 ka.
The chronology of the reconstructed deglaciation phases of the Jablanica Mt. compared to independent paleoclimate reconstructions suggest that thermal conditions during the ablation season were the key drivers of glacial dynamics before ~15 ka. The last glacier stabiliza-tion phase was apparently a response of locally increased winter precip-itation and a slight summer cooling during the GI-1b.
The morphostratigraphy of the landforms and estimated ELA of the relevant glaciers can be highly variable for co-existing glaciers, hence numerical age determinations are required for a creditable glacial chro-nology. The evaluation of the exposure dating results from Jablanica Mt. in the light of the available glacial geochronological data in the central Balkan Peninsula suggests that more systematic work is necessary. Analysis of multiple samples at several subsequent glacial stages in each mountain range is recommended to achieve a solid local glacier chronology, which can be used for regional comparisons. Besides, a re-calculation of the exposure durations on a common basis is necessary, including the best possible estimate of the snow cover and local denu-dation rates. Ignoring these factors introduces a non-systematic bias of the CRE ages from site to site, and makes comparability of the recalculated results questionable.
Declaration of competing interest
The authors declare that they have no known competingfinancial interests or personal relationships that could have appeared to in flu-ence the work reported in this paper.
Acknowledgements
This research was funded by the National Research, Development and Innovation Office of Hungary grant OTKA FK 124807 and by the Eu-ropean Union and the State of Hungary, co-financed by the European Regional Development Fund in the project of GINOP-2.3.2-15-2016-00009‘ICER’. The ASTER AMS national facility (CEREGE, Aix en Pro-vence), where the10Be/9Be measurements were performed, is
sup-ported by the INSU/CNRS, the ANR through the“Projets thématiques d'excellence” program for the “Equipements d'excellence” ASTER-CEREGE action, and the IRD. We are grateful for the comments and sug-gestions of Philip Hughes and an Anonymous Reviewer, which helped to improve the manuscript. This is contribution No. 65. of 2 ka Palæoclimatology Research Group.
Appendix A. Supplementary data
Supplementary data to this article can be found online athttps://doi. org/10.1016/j.geomorph.2019.106985.
References
Andersen, K.K., Svensson, A., Johnsen, S.J., Rasmussen, S.O., Bigler, M., Röthlisberger, R., Ruth, U., Siggaard-Andersen, M.L., Steffensen, J.P., Dahl-Jensen, D., Vinther, B.M., Clausen, H.B., 2006.The Greenland ice core chronology 2005, 15–42 ka. Part 1: con-structing the time scale. Quat. Sci. Rev. 25 (23–24), 3246–3257.
André, M.-F., 2002.Rates of Postglacial rock weathering on glacially scoured outcrops (Abisko-Riksgränsen area, 68°N). Geogr. Ann. 84 (A (3–4)), 139–150.
Arnold, M., Merchel, S., Bourlès, D.L., Braucher, R., Benedetti, L., Finkel, R.C., Aumaître, G., Gottdang, A., Klein, M., 2010.The French accelerator mass spectrometry facility ASTER: improved performance and developments. Nucl. Instrum. and Methods in Phys. Res. B 268, 1954–1959.
Aufgebauer, A., Panagiotopoulos, K., Wagner, B., Schaebitz, F., Viehberg, F.A., Vogel, H., Zanchetta, G., Sulpicio, R., Leng, M.J., Damaschke, M., 2012.Climate and environmen-tal change in the Balkans over the last 17 ka recorded in sediments from Lake Prespa (Albania/FYR of Macedonia/Greece). Quat. Int. 274, 122–135.
Balco, G., 2009. MATLAB Code for Camel Diagrams.http://cosmognosis.wordpress.com/ 2009/07/13/matlab-code-for-camel-diagrams.
Balco, G., 2011.Contributions and unrealized potential contributions of cosmogenic nu-clide exposure dating to glacier chronology, 1990–2010. Quat. Sci. Rev. 30, 3–27.
Balco, G., Stone, J.O., Lifton, N., Dunai, T.J., 2008.A complete and easily accessible means of calculating surface exposure ages or erosion rates from10
Be and26
Al measurements. Quat. Geochronol. 3, 174–195.
Barr, I.D., Spagnolo, M., 2015.Glacial cirques as palaeoenvironmental indicators: their po-tential and limitations. Earth-Sci. Rev. 151, 48–78.
Bazin, L., Lemieux-Dudon, B., Siani, G., Govin, A., Landais, A., Genty, D., Michel, E., Nomade, S., 2019.Construction of a tephra-based multi-archive coherent chro-nological framework for the last deglaciation in the Mediterranean region. Quat. Sci. Rev. 216, 47–57.
Benn, D.I., Hulton, N.R.J., 2010.An Excel™ spreadsheet program for reconstructing the surface profile of former mountain glaciers and ice caps. Comput. Geosci. 36, 605–610.
Borchers, B., Marrero, S., Balco, G., Caffee, M., Goehring, B., Lifton, N., Nishiizumi, K., Phillips, F., Schaefer, J., Stone, J., 2016.Geological calibration of spallation production rates in the CRONUS-Earth project. Quat. Geochronol. 31, 188–198.
Bordon, A., Peyron, O., Lézine, A.M., Brewer, S., Fouache, E., 2009.Pollen-inferred late-gla-cial and Holocene climate in southern Balkans (Lake Maliq). Quat. Int. 200 (1–2), 19–30.
Boxleitner, M., Ivy-Ochs, S., Brandova, D., Christl, M., Maisch, M., 2019.Lateglacial and Early Holocene glacier stages - new dating evidence from the Meiental in central Switzerland. Geomorphology 340, 15–31.
Braucher, R., Merchel, S., Borgomano, J., Bourles, D.L., 2011.Production of cosmogenic ra-dionuclides at great depth: A multi element approach. Earth and Planet. Sci. Lett. 309, 1–9.
Braucher, R., Guillou, V., Bourlès, D.L., Arnold, M., Aumaître, G., Keddadouche, K., Nottoli, E., 2015.Preparation of ASTER in-house10
Be/9
Be standard solutions. Nuclear Instru-ments and Methods in Phys. Res. Sect. B: Beam Interact. with Mater. and At. 361, 335–340.
Carlson, A.E., 2013.The younger Dryas climate event. In: Elias, S.A. (Ed.), The Encyclopedia of Quat. Sci. 3. Elsevier, Amsterdam, pp. 126–134.
Chmeleff, J., von Blanckenburg, F., Kossert, K., Jakob, D., 2010.Determination of the10
Be half-life by multicollector ICP-MS and liquid scintillation counting. Nuclear Instru-ments & Methods in Phys. Res. Sect. B, Beam Interact. with Mater. and Atoms 268, 192–199.
Codilean, A.T., 2006.Calculation of the cosmogenic nuclide production topographic shielding scaling factor for large areas using DEMs. Earth Surf. Proc. and Landf. 31 (6), 785–794.
Combourieu-Nebout, N., Paterne, M., Turon, J.L., Siani, G., 1998.A high-resolution record of the last deglaciation in the Central Mediterranean sea: palaeovegetation and palaeohydrological evolution. Quat. Sci. Rev. 17, 303–317.
Cvijič, J., 1889.Glacijalne i morfoloske studije o planinama Bosne, Hercegovine i Crne Gore. Glas Srpske Kraljevske Akademije Nauka. LVII 1/21, Beograd.
Cvijič, J., 1917.L'époque glaciaire dans la péninsule des Balkanique. Annales de Géographie 26, 189–218.
Djurović, P., 2009.Reconstruction of the Pleistocene glaciers of Mt. Durmitor in Montene-gro. Acta Geographica Slovenica 49-2, 263–289.
Dumurdžanov, N., Ivanovski, T., 1978.Explanatory Notes for the General Geological Map of Ohrid and Podgradec, 1:100000. Federal Geological Survey: Belgrade, Serbia 51 (In Macedonian).
Dumurdžanov, N., Serafimovski, T., Burchfiel, B.C., 2004.Evolution of the Neogene-Pleisto-cene basins of Macedonia. Geol Soc Am Digit Map Chart Ser 1, 1–20.
Francke, A., Wagner, B., Just, J., Leicher, N., Gromig, R., Baumgarten, H., Vogel, H., Sadori, L., Wonik, T., Leng, M.J., Zanchetta, G., Sulpicio, R., Giaccio, B., 2016.Sedimentological processes and environmental variability at Lake Ohrid (Macedonia, Albania) between 637 ka and the present. Biogeosci. 13, 1179–1196.
Gachev, E., Stayanov, K., Gikov, A., 2016.Small glaciers on the Balkan Peninsula: State and changes in the last several years. Quat. Int. 415, 33–54.
Gromig, R., Mechernich, S., Ribolini, A., Wagner, B., Zanchetta, G., Isola, I., Bini, M., Dunai, T., 2018.Evidence for a Younger Dryas deglaciation in the Galicica Mountains (FYROM) from cosmogenic36Cl. Quat. Int. 464, 352–363.
Hofmann, F.M., Alexanderson, H., Schoeneich, P., Mertes, J.R., Léeanni, L., ASTER Team, 2019. Post-Last Glacial Maximum glacierfluctuations in the southern Écrins massif (westernmost Alps): insights from10Be cosmic ray exposure dating. Boreas.https://
doi.org/10.1111/bor.12405.
Hughes, P.D., 2007.Recent behaviour of the Debeli Namet glacier, Durmitor. Montenegro. Earth Surface Proc. and Landf. 10, 1593–1602.