HAL Id: inserm-02073883
https://www.hal.inserm.fr/inserm-02073883
Submitted on 20 Mar 2019
HAL is a multi-disciplinary open access
archive for the deposit and dissemination of
sci-entific research documents, whether they are
pub-lished or not. The documents may come from
teaching and research institutions in France or
abroad, or from public or private research centers.
L’archive ouverte pluridisciplinaire HAL, est
destinée au dépôt et à la diffusion de documents
scientifiques de niveau recherche, publiés ou non,
émanant des établissements d’enseignement et de
recherche français ou étrangers, des laboratoires
publics ou privés.
results from a nationwide study
Coralie Gandré, Jeanne Gervaix, Julien Thillard, Jean-Marc Macé, Jean-Luc
Roelandt, Karine Chevreul
To cite this version:
Coralie Gandré, Jeanne Gervaix, Julien Thillard, Jean-Marc Macé, Jean-Luc Roelandt, et al..
Ge-ographic variations in involuntary care and associations with the supply of health and social care:
results from a nationwide study. BMC Health Services Research, BioMed Central, 2018, 18 (1),
pp.253. �10.1186/s12913-018-3064-3�. �inserm-02073883�
R E S E A R C H A R T I C L E
Open Access
Geographic variations in involuntary care
and associations with the supply of health
and social care: results from a nationwide
study
Coralie Gandré
1,2*, Jeanne Gervaix
1,2, Julien Thillard
1,2, Jean-Marc Macé
3, Jean-Luc Roelandt
1,4and Karine Chevreul
1,2Abstract
Background: Involuntary psychiatric care remains controversial. Geographic disparities in its use can challenge the appropriateness of the care provided when they do not result from different health needs of the population. These disparities should be reduced through dedicated health policies. However, their association with the supply of health and social care, which could be targeted by such policies, has been insufficiently studied. Our objectives were therefore to describe geographic variations in involuntary admission rates across France and to identify the characteristics of the supply of care which were associated with these variations.
Methods: Involuntary admission rate per 100,000 adult inhabitants was calculated in French psychiatric sectors’ catchment areas using 2012 data from the national psychiatric discharge database. Its variations were first described numerically and graphically. Several factors potentially associated with these variations were then considered in a negative binomial regression with an offset term accounting for the size of catchment areas. They included characteristics of the supply of care (public and private care, health and social care, hospital and community-based care, specialised and non-specialised care) as well as adjustment factors related to epidemiological characteristics of the population of each sector’s catchment area and its level of urbanization. Such variables were extracted from complementary administrative databases. Supply characteristics associated with geographic variations were identified using a significance level of 0.05. Results: Significant variations in involuntary admission rates were observed between psychiatric sectors’ catchment areas with a coefficient of variation close to 80%. These variations were associated with some characteristics of the supply of health and social care in the sectors’ catchment areas. Notably, an increase in the availability of community-based private psychiatrists and the capacity of housing institutions for disabled individuals was associated with a decrease in involuntary admission rates while an increase in the availability of general practitioners was associated with an increase in those rates. Conclusions: There is evidence of considerable variations in involuntary admission rates between psychiatric sectors’ catchment areas. Our results provide lines of thoughts to reduce such variations, in particular by supporting an increase in the availability of upstream and downstream care in the community.
Keywords: Geographic variations, Psychiatry, Involuntary care, Supply
* Correspondence:coralie.gandre@urc-eco.fr
1ECEVE, UMRS 1123, Université Paris Diderot, Sorbonne Paris Cité, INSERM,
Paris, France
2AP-HP, URC Eco, Paris, France
Full list of author information is available at the end of the article
© The Author(s). 2018 Open Access This article is distributed under the terms of the Creative Commons Attribution 4.0 International License (http://creativecommons.org/licenses/by/4.0/), which permits unrestricted use, distribution, and reproduction in any medium, provided you give appropriate credit to the original author(s) and the source, provide a link to the Creative Commons license, and indicate if changes were made. The Creative Commons Public Domain Dedication waiver (http://creativecommons.org/publicdomain/zero/1.0/) applies to the data made available in this article, unless otherwise stated.
Gandréet al. BMC Health Services Research (2018) 18:253 https://doi.org/10.1186/s12913-018-3064-3
Background
Involuntary psychiatric care is a form of care where pa-tients’ consent is not required. It is provided to deal with crisis situations where the patient, who is no longer able to make an informed decision, represents a significant danger to oneself or to others due to his/her psychiatric condition [1, 2]. Involuntary care is however controver-sial as it represents a limitation of one’s freedom and is not retrospectively perceived as justified or beneficial by patients [3]. As a consequence, it is often considered an indicator of the quality of care [4–6] and its reduction is
supported by international recommendations [7].
Reforms have therefore been issued to moderate its frequency [1,8].
Previous research has shown significant geographical variations in involuntary care both between and within countries [1, 5, 9]. Some of these variations arose from different population profiles. The health needs of the population, approximated by the prevalence of severe mental disorders such as psychotic disorders [5], were in particular found to be associated with involuntary care, and so were socio-economic characteristics of the popu-lation, including social support and deprivation [10,11]. In addition, a large body of literature has underscored the possibility that health care supply could also be asso-ciated with geographic variations in the use of care [12– 14]. A few studies have suggested that this could indeed be the case for variations in the use of involuntary care [5, 10, 15, 16]. However, they have only focused on lim-ited types of providers or on too few areas [5, 9]. Add-itional work carried out on a large scale and including a wide number of variables is therefore necessary to better illustrate geographical variations in involuntary care and to understand their associations with the supply of care. This is particularly important as disparities in the use of involuntary care– when they do not result from differ-ent health needs – can challenge the quality, equity and efficiency of the care provided.
Given these elements, our objective was first to de-scribe geographic variations in involuntary admission rates across France, and second to identify the character-istics of the supply of care which were associated with these variations after adjusting for other relevant factors, in particular population characteristics.
Methods
Setting
In France, public mental health care – the only type of care allowed to provide involuntary treatment– is orga-nised separately for adults, children and adolescents, and forensic patients. For these three populations, there is a territorial organization of care which is divided into geo-demographic areas (sectors’ catchment areas) where multidisciplinary teams (sectors) provide integrated
outpatient and inpatient care necessary to cover the mental health needs of their population, including pre-ventive, diagnostic and therapeutic services [17]. The staff needed to provide these services is employed by a hospital which can be in charge of several sectors. This hospital may be either public or private non-profit, and it can also be either specialised in psychiatry or a general hospital with an activity in psychiatry which then fulfils the same tasks as a specialised hospital. Additionally, complementary care may be delivered in sectors’ catch-ment areas by social institutions or private providers, ei-ther specialised (such as community-based private psychiatrists, psychologists or private for-profit hospi-tals) or not (such as general practitioners).
Due to these specificities, our study was carried out in adult non-forensic sectors’ catchment areas, which were our units of analysis, in the entire territory of mainland France. On this territory, involuntary care is regulated by the same national law which states that involuntary care may only be provided by sectors linked to hospitals man-dated to do so by regional health agencies [18]. We there-fore only analysed data from sectors linked to such hospitals. Furthermore, to ensure comparability and data quality, we only included data from sectors linked to hos-pitals which provided exhaustive information on their ad-missions. These sectors were identified by cross-checking aggregated data from the French national discharge data-base which contains individual information on the use of psychiatric care (Recueil d’informations médicalisé en psy-chiatrie, RIM-P) [19] with data from the annual national survey on health care providers (Statistique annuelle des établissements de santé, SAE) [20] (see Additional file 1
for more information on these databases).
As the geographical boundaries of psychiatric sectors’ catchment areas are not publicly available on a national scale and to take into account actual patients’ behaviours when seeking care, we built sectors’ catchment areas using patient-origin data [21]. Based on the official age limit of adult psychiatry in France [22], the zip codes of patients over 16 seen in each sector were extracted from the RIM-P database. Access to individual information from this database is regulated by the French data
pro-tection authority (CNIL), which granted us an
authorization in August 2014 (Decision DE-2014-090). A geographic information system (Geoconcept® soft-ware) was then used to map the catchment areas and to exclude outlier zip codes.
Involuntary admission rate
The number of inhabitants of each sector’s catchment area admitted in involuntary care at least once in each sector over the course of the year studied (2012) was ex-tracted from the RIM-P database. We only considered
involuntary admissions in full-time inpatient care (day and night) provided in hospital settings.
We included involuntary admissions of patients who were diagnosed with a mental disorder from Chapter V of the International Classification of Diseases, tenth revision (ICD-10) [23]. We excluded patients suffering from or-ganic mental disorders, mental retardation and disorders of psychological development (apart from pervasive devel-opmental disorders) because of the specificity of the care they require. This diagnosis scope corresponds to psychia-trists’ expertise in France and has been used in previous international studies in the mental health field [24,25].
To calculate the involuntary admission rate per 100,000 inhabitants, the number of inhabitants involun-tarily admitted at least once over the course of the year 2012 was divided by the total number of inhabitants over 16 in the sector’s catchment area.
Potential factors associated with geographic variations in involuntary admission rate
Factors related to the supply of health and social care
We first considered the supply of public mental health care in sectors’ catchment areas. We included both insti-tutional characteristics (such as participation to teaching activities) and organizational characteristics (such as number of psychiatric inpatient beds or full-time equiva-lents allocated to psychiatry) of the hospital to which each psychiatric sector was linked.
Second, we considered the supply of private mental health care in sectors’ catchment areas. We included the availability of self-employed community-based psychia-trists or psychologists and of hospitalization beds in pri-vate psychiatry.
Third, we considered the availability of
non-specialised health care, both for primary care (general practitioners) and for hospital-based care (non-psychi-atric hospitalization beds).
Finally, we included data on the supply of social care (residential care or services for disabled individuals).
The full list of supply factors considered is available in Table 1. Information regarding these variables were ex-tracted from administrative databases: the SAE database, the French national database of permanent facilities (Base permanente des équipements), the national register of health and social institutions (Fichier national des établissements sanitaires et sociaux) and the national directory of professionals [20,26–28] (see Additional file
1for more information on these databases).
Epidemiological factors
We considered several direct characteristics of popula-tion health needs. They included three characteristics of the mental health status of the population living in each sector’s catchment area. They were the rate of
individ-uals suffering from chronic psychiatric disorders,
assessed by the number of individuals covered by the long-term illness scheme for psychiatric reasons (i.e. in-dividuals who are exonerated from co-payments of any health care linked with their chronic illness) per 100,000 inhabitants; the percentage of deaths by suicide; and the acute admission rate for psychiatric disorders (including both voluntary and involuntary admissions). We also in-cluded characteristics of the overall health status of the population (global mortality rate, rate of individuals suf-fering from chronic somatic disorders, and acute admis-sion rate for somatic disorders). These variables were extracted from the database of the national centre on epidemiological causes of death (Centre d’épidémiologie sur les causes médicales de décès), the census database (Base des recensements de la population), the French na-tional discharge database for somatic care (Programme de médicalisation des systèmes d’information en méde-cine, chirurgie, obstétrique) and the Eco-Santé database which provides data on the health of the French popula-tion before 2016 [29–32] (see Additional file 1for more information on these databases).
Additionally, we considered the demographics of the population, which have been shown to be correlated with health needs [33]: the mean age of the adult popu-lation in the sectors’ catchment areas and the percentage of women in these areas extracted from the census data-base (Additional file1) [31].
Finally, socio-economic factors have also been shown to be correlated with health needs [34,35]. We therefore calculated a proxy deprivation index for each zip code belonging to a sector’s catchment area and calculated its mean value in the area, using a validated composite index specifically developed for France, the FDep. This index takes into account the median household income, the percentage of high school graduates in the popula-tion aged 15 years and older, the percentage of blue-collar workers in the active population and the unemployment rate [36–38].
Level of urbanization
Urbanicity is likely to be linked with involuntary care through different mechanisms related to coordination and distances between the different types of care supply
Table 1 Variations in involuntary admission rates between psychiatric sectors’ catchment areas
Mean (SD) Median (interquartile range) Range CV (%) Ratio 90/10th percentiles Involuntary admission rate per 100,000 inhabitants 21.92 (17.43) 17.51 (21.98) 135.11 79.51 10.24
[39] and the availability of other actors which can play a role in involuntary care, such as police stations. We therefore introduced the level of urbanization as an
add-itional adjustment factor. This characteristic was
assessed by the density of inhabitants in the zip codes of the sectors’ catchment areas and extracted from a na-tional administrative database on urbanicity (Base des unités urbaines) [40] (see Additional file1).
Methods of analysis Description of variations
We first described the characteristics of the population in sectors’ catchment areas either by the mean and standard deviation (SD) or by number and percentage.
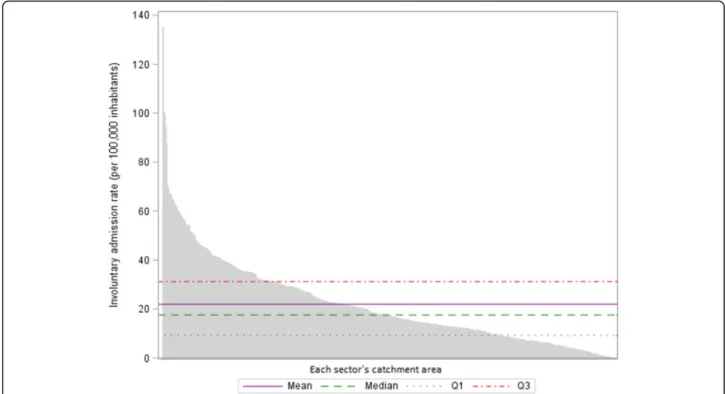
Variations in involuntary admission rates between catchment areas were described by calculating the na-tional mean, SD, median, interquartile range and range. A coefficient of variation (CV), which measures the dis-persion around the national mean [41], was also calcu-lated. This coefficient was interpreted together with the ratio between the 90th and the 10th percentiles of the distribution, which is less sensitive to outlier values (a high value for this ratio suggests that variations remain when extreme observations are excluded from the ana-lysis) [13]. To explore further the potential impact of outlier values, we constructed a waterfall plot represent-ing the involuntary admission rate in each sector’s catch-ment area, ranked by decreasing order, in comparison to the national average.
Identification of factors associated with variations in involuntary admission rates
To identify the characteristics of the supply of health and social care in sectors’ catchment areas which were associated with variations in involuntary admission rates, we carried out a negative binomial regression to account for the overdispersion of data (deviances considerably exceeding the degrees of freedom). The dependent vari-able was the observed number of inhabitants of each sector’s catchment area admitted in involuntary care at least once over the course of the year 2012 (event) while the natural logarithm of the total number of inhabitants aged over 16 in each sector’s catchment area was used as an offset term in the regression [42–44]. All supply factors (described above) were introduced as explanatory variables (except for explanatory variables that were highly correlated). We also added relevant adjustment factors relating to epidemiological data and level of urbanization. Statistical significance was taken to be in-dicated by a probability value of 0.05 or less. The ana-lysis produced estimated values of the regression coefficients for all explanatory variables in the model, whose sign indicated whether the association was posi-tive or negaposi-tive, as well as their 95% confidence intervals
(95%CI). Regression coefficients for each explanatory variable were finally exponentiated to obtain an estima-tion of the inpatient admission incidence rate ratio given the other variables were held constant in the model. The rate ratio for the dependent variable was expressed for a one unit increase in each continuous explanatory vari-able while, for categorical explanatory varivari-ables, a refer-ence was chosen for comparison [42,43].
All the analyses were performed using SAS software version 9.4 (SAS Institute Inc., Cary, NC, USA).
Results
Setting
Five hundred fourteen adult psychiatric sectors were linked to hospitals providing exhaustive information on their admissions. They accounted for 66.0% of all adult non-forensic psychiatric sectors delivering involuntary care reported in the RIM-P database for the year 2012 in mainland France. They corresponded to 168 hospitals representing 73.4% of all hospitals participating in psy-chiatric sectorisation and mandated by regional health agencies to deliver involuntary care. Sectors that had data included were linked to hospitals which were more often public than hospitals linked to excluded sectors (96.6% vs. 90.3%, p = 0.043), but they did not differ in terms of other main institutional, organizational or case-mix characteristics.
Characteristics of the population of sectors’ catchment areas
The mean percentage of women of sectors’ catchment areas was 52.3% (±2.5) and the mean age of this popula-tion was 48.1 years old (±3.6). On average, the number of individuals suffering from chronic mental disorders per 100,000 inhabitants of sectors’ catchment areas was 1627.4 (±366.1) and deaths by suicide represented 5.1% (± 2.0%) of all deaths.
Five hundred fifty-seven thousand five hundred forty-three individuals living in these catchment areas were treated in the corresponding psychiatric sectors in 2012 (accounting for 5,514,001 admissions). Forty thousand four hundred seventeen individuals were admitted at least once in involuntary care. They represented 5.7% of all pa-tients seen in included psychiatric sectors and 29.1% of patients admitted to inpatient care in these sectors.
Variations in involuntary admission rates
The national mean psychiatric involuntary admission rate was 21.9 (±17.4) per 100,000 inhabitants of a sec-tor’s catchment area. Significant variations were ob-served between catchment areas with a coefficient of variation close to 80%. These variations were not only a result of catchment areas with outlier values, as the ratio between the 90th and the 10th percentiles of the distri-bution was superior to ten (Table1).
Similarly, the waterfall plot showed a wide scattering of the values of the involuntary admission rate in the dif-ferent catchment areas (not only for a limited number of catchment areas) in comparison to aggregated national values (Fig.1).
Factors associated with variations in involuntary admission rates
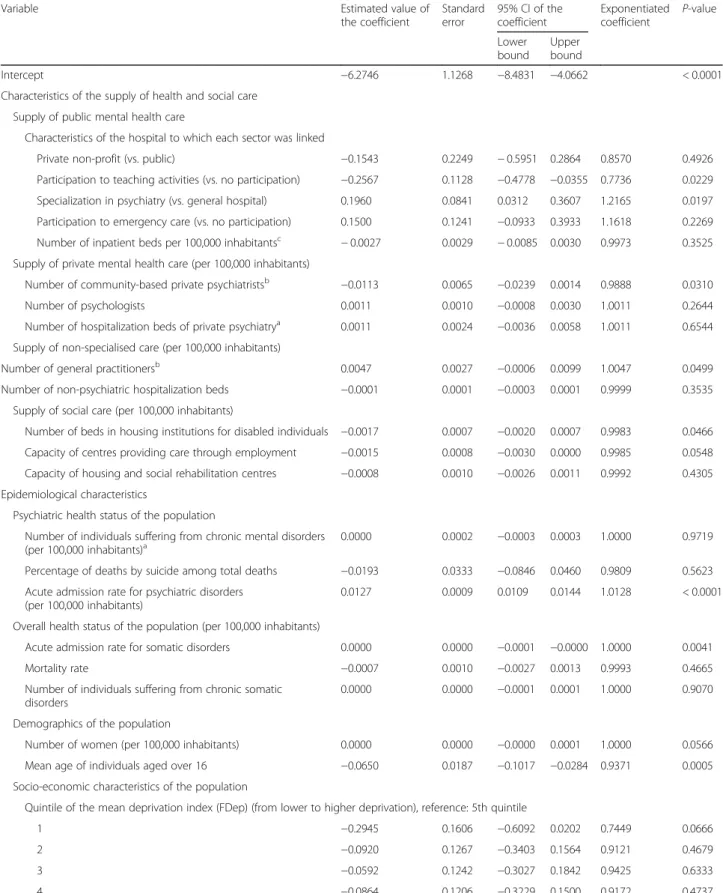
Thirteen characteristics of the supply of health and so-cial care in sectors’ catchment areas were introduced in the model after controlling for potential correlations (see Table 2 and associated footnotes). After adjusting for epidemiological data and level of urbanization, sev-eral of these characteristics were significantly associated with the involuntary admission rate.
Regarding the characteristics of public mental health care, the fact that a sector was linked to a hospital spe-cialised in psychiatry (vs. a general hospital) was associ-ated with a 21.7% increase in the involuntary admission rate per 100,000 inhabitants of the catchment area. The fact that a sector was linked to a hospital participating to teaching activities (vs. a hospital not participating to such activities) was associated with a 22.6% decrease in this rate (Table2).
Considering the characteristics of private health care, an increase by 1.0 in the number of community-based private psychiatrists per 100,000 inhabitants, whose aver-age national value was 12.8, was associated with a
decrease by 1.1% of the involuntary admission rate. On the contrary, an increase by 1.0 in the number of general practitioners (GPs) per 100,000 inhabitants (average na-tional value = 108.2) was associated with an increase by 0.5% of the involuntary admission rate (Table2).
Regarding the availability of social care, an increase by 1.0 in the number of beds in housing institutions for dis-abled individuals per 100,000 inhabitants (average na-tional value = 195.4) was associated with a decrease by 0. 2% of the involuntary admission rate (Table2).
Notably, some of our adjustment factors, in particular the socio-economic characteristics of the population and the level of urbanization, were not significantly associ-ated with involuntary admission rates in the multivariate analysis (Table2).
Discussion
Significant variations in involuntary admission rates were observed between sectors’ catchment areas in France. After adjusting for epidemiological differences and varying levels of urbanization, an increase in the supply of health and social care, in particular the avail-ability of community-based private psychiatrists and the capacity of housing institutions for disabled individuals, was associated with a decrease in involuntary admission rates. In contrast, an increase in the availability of gen-eral practitioners was associated with an increase in involuntary admission rates. Finally, these rates also
Fig. 1 Involuntary admission rate in the catchment area of each sector in comparison to the national average. Q1: upper limit of the first quartile; Q3: lower limit of the last quartile
Table 2 Results of the negative binomial regression
Variable Estimated value of
the coefficient Standard error 95% CI of the coefficient Exponentiated coefficient P-value Lower bound Upper bound Intercept −6.2746 1.1268 −8.4831 −4.0662 < 0.0001
Characteristics of the supply of health and social care Supply of public mental health care
Characteristics of the hospital to which each sector was linked
Private non-profit (vs. public) −0.1543 0.2249 − 0.5951 0.2864 0.8570 0.4926 Participation to teaching activities (vs. no participation) −0.2567 0.1128 −0.4778 −0.0355 0.7736 0.0229 Specialization in psychiatry (vs. general hospital) 0.1960 0.0841 0.0312 0.3607 1.2165 0.0197 Participation to emergency care (vs. no participation) 0.1500 0.1241 −0.0933 0.3933 1.1618 0.2269 Number of inpatient beds per 100,000 inhabitantsc − 0.0027 0.0029 − 0.0085 0.0030 0.9973 0.3525
Supply of private mental health care (per 100,000 inhabitants)
Number of community-based private psychiatristsb −0.0113 0.0065 −0.0239 0.0014 0.9888 0.0310
Number of psychologists 0.0011 0.0010 −0.0008 0.0030 1.0011 0.2644
Number of hospitalization beds of private psychiatrya 0.0011 0.0024 −0.0036 0.0058 1.0011 0.6544
Supply of non-specialised care (per 100,000 inhabitants)
Number of general practitionersb 0.0047 0.0027 −0.0006 0.0099 1.0047 0.0499
Number of non-psychiatric hospitalization beds −0.0001 0.0001 −0.0003 0.0001 0.9999 0.3535 Supply of social care (per 100,000 inhabitants)
Number of beds in housing institutions for disabled individuals −0.0017 0.0007 −0.0020 0.0007 0.9983 0.0466 Capacity of centres providing care through employment −0.0015 0.0008 −0.0030 0.0000 0.9985 0.0548 Capacity of housing and social rehabilitation centres −0.0008 0.0010 −0.0026 0.0011 0.9992 0.4305 Epidemiological characteristics
Psychiatric health status of the population
Number of individuals suffering from chronic mental disorders (per 100,000 inhabitants)a
0.0000 0.0002 −0.0003 0.0003 1.0000 0.9719 Percentage of deaths by suicide among total deaths −0.0193 0.0333 −0.0846 0.0460 0.9809 0.5623 Acute admission rate for psychiatric disorders
(per 100,000 inhabitants)
0.0127 0.0009 0.0109 0.0144 1.0128 < 0.0001
Overall health status of the population (per 100,000 inhabitants)
Acute admission rate for somatic disorders 0.0000 0.0000 −0.0001 −0.0000 1.0000 0.0041
Mortality rate −0.0007 0.0010 −0.0027 0.0013 0.9993 0.4665
Number of individuals suffering from chronic somatic disorders
0.0000 0.0000 −0.0001 0.0001 1.0000 0.9070 Demographics of the population
Number of women (per 100,000 inhabitants) 0.0000 0.0000 −0.0000 0.0001 1.0000 0.0566 Mean age of individuals aged over 16 −0.0650 0.0187 −0.1017 −0.0284 0.9371 0.0005 Socio-economic characteristics of the population
Quintile of the mean deprivation index (FDep) (from lower to higher deprivation), reference: 5th quintile
1 −0.2945 0.1606 −0.6092 0.0202 0.7449 0.0666
2 −0.0920 0.1267 −0.3403 0.1564 0.9121 0.4679
3 −0.0592 0.1242 −0.3027 0.1842 0.9425 0.6333
4 −0.0864 0.1206 −0.3229 0.1500 0.9172 0.4737
Level of urbanisation
increased in the catchment areas of sectors linked to a hospital specialised in psychiatry (vs. a general hospital) while they decrease in the catchment areas of sectors linked to a hospital participating to teaching activities.
While deaths by suicide in France account for a par-ticularly high share of the total mortality [45], we believe that our population of interest is relatively comparable to that of other countries with similar economic devel-opments in terms of prevalence of mental disorders and demographic structure [45–48]. The national mean in-voluntary admission rate (22 per 100,000 inhabitants) found in our study was close to that observed in other European countries, such as Denmark or Italy [49, 50], even though the percentage of involuntary admissions over the total number of inpatient admissions seemed to be higher than in other countries [5]. In addition, these national estimates were older than ours and compari-sons must be made with caution. A more recent study carried out at the local level in Italy showed wide variations in involuntary admission rates between geo-demographic areas, similarly to what was observed between French psychiatric sectors’ catchment areas. However, the variations seemed to be slightly less considerable than in our study (CV of 69% vs. 80%) [5]. These differences may be partly explained by a stronger and older consensus on the benefits of deinstitutionalization in Italy [51], a more homogenous development of alternatives in the community as a consequence, and the scale of the study (regional vs. national).
The extent of the variations observed between psychi-atric sectors’ catchment areas questions the adequacy of care and suggests that some of them may be unwar-ranted. This hypothesis is further supported by the
asso-ciations found between these variations and the
characteristics of the supply of health and social care in sectors’ catchment areas, even after adjusting for
epi-demiological differences and varying levels of
urbanization. If previous research has shown that the
availability of social workers and of less restrictive forms of care were associated with involuntary care [5,52,53], no study has ever considered as wide a range of supply factors, which limits comparisons.
Regarding the underlying mechanisms which could ex-plain the associations found in our study, several hy-potheses can be made. First of all, it could be hypothesized that supply influences demand. This may explain that involuntary admission rates are higher in the catchment areas of sectors linked to psychiatric hos-pitals compared to those linked to general hoshos-pitals, as the former are more likely to have high-capacity closed wards. It may additionally result from varying practice patterns between the different types of hospital, which could also explain that involuntary admission rates are lower in the catchment areas of sectors linked to a hos-pital participating to teaching activities. These varying practice patterns should be further explored, particularly by qualitative studies. Second, it could be hypothesized that the availability of both upstream and downstream care in the community (especially community-based pri-vate psychiatrists and residential alternatives) enables a better continuity of care which reduces crisis situations and the need for involuntary care. This hypothesis does not hold for general practitioners whose availability was associated with an increase in involuntary care. However, the difficulties of French GPs to adequately detect the mental health needs of their patients have often been underscored while they also lack appropriate training to address such needs once identified [54, 55]. In addition, it could be linked to non-optimal collaborations between primary care and psychiatric sectors [56]. France is in-deed one of the European countries where GPs address the least often their patients to specialised psychiatric care [57]. In parallel, GPs also report difficult relation-ships with sectors as they estimate that they do not re-ceive enough information on their patients’ evolution when they are seen in public psychiatry [58]. Finally, it is
Table 2 Results of the negative binomial regression (Continued)
Variable Estimated value of
the coefficient Standard error 95% CI of the coefficient Exponentiated coefficient P-value Lower bound Upper bound 1 0.0701 0.1253 −0.1754 0.3156 1.0726 0.5758 2 0.0423 0.1613 −0.2739 0.3585 1.0432 0.7933 3 0.1125 0.3969 −0.6655 0.8904 1.1191 0.7769 4 0.5827 0.5735 −0.5412 1.7067 1.7909 0.3095 5 0.0099 0.1254 −0.2359 0.2557 1.0099 0.9373 a andb
Significant correlations were observed between these variables. However, corresponding correlation coefficients were weak and there were strong hypotheses on associations of these variables with involuntary admission rates so they were all introduced in the model
c
The number of inpatient beds per 100,000 inhabitants of the catchment area was highly correlated with the total number of full-time equivalents per 100,000 inhabitants allocated to psychiatric care by the hospital to which each sector was linked (ρ = 0.96; p < 0.0001). We therefore only introduced the number of beds in the model
possible that part of the association found between the availability of GPs and the involuntary admission rate translate unmeasured differences in the level of urban-isation between sectors’ catchment areas. Our indicator of urbanisation was indeed only based on population density, which could explain that it was not associated with involuntary care, similarly to what was observed in a previous study using the same kind of indicator of ur-banisation [5]. Complementary quantitative and qualita-tive studies would be particularly useful in exploring further these hypotheses.
This study, conducted in France, is the first to focus on geographical variations in involuntary care in a whole country. We considered a wide range of supply factors, relating to both public and private care, health and social care, hospital and community-based care, and specia-lised and non-speciaspecia-lised care, by mobilizing ten com-plementary national administrative databases, mostly compiled by governmental institutions. Studies available in the current literature focused on a limited geographic area and included few characteristics of the supply of care available in the environment [5, 9]. While carrying out analysis at the local level can increase the availability and accuracy of data, it often impairs the generalizability of the findings, especially as the supply of care is more likely to be homogenous within a given region than be-tween regions. The results of our study should neverthe-less be interpreted in light of several caveats. First of all, it should be kept in mind that we did not aim to explain use of involuntary care by individual patients. We adopted an ecological and geographical approach and used sectors’ catchment areas as our units of analysis. It should therefore not be assumed that individual mental health care users have characteristics similar to the population average in sectors’ catchment area. Concur-rently, the significant associations found in our study could be affected by compositional effects which we were not able to account for in our analysis. Further re-search could be useful to explore such effects by calcu-lating inpatient involuntary admissions rates directly standardised on population demographic characteristics in each sector’s catchment area prior to conducting the multivariable analysis. Second, the RIM-P database, from which we extracted data on inpatient involuntary admis-sions, is not used for financial or certification purposes and this can limit data quality. In order not to interpret the variability in data reporting and quality as variability in inpatient involuntary admission rates, we therefore had to exclude the data of around one third of the sec-tors meeting our inclusion criteria as they were linked to hospitals for which exhaustive information on their ad-missions were not available. However, such hospitals presented very few differences with hospitals whose data was included. Third, we were limited by the availability
of some of the potential factors associated with varia-tions in psychiatric care due to our use of administrative databases. Regarding supply factors, previous research focusing on the local context of mental health care col-lected exhaustive data on available primary, secondary and tertiary health care supply, as well as on all social and voluntary services through ad hoc interviews with local stakeholders and a validated taxonomy which facili-tates international comparisons [59, 60]. These kinds of approaches could be usefully implemented for the study of geographic variations in mental health care use. Nevertheless, their feasibility is limited on the national scale. Furthermore, additional epidemiological data, used here as adjustment factors, could be considered. Indeed our study is notably impaired by the lack of detailed information related to the prevalence of the different mental disorders in sectors’ catchment areas; such infor-mation is currently not available. Similarly, no informa-tion is collected on ethnicity and immigrainforma-tion status of the population in France [61], while these characteristics could also be correlated with mental health needs.
Conclusions
Our results underscore the need to routinely monitor geo-graphic variations in psychiatric involuntary care as they remain considerable. Our findings also suggest several measures that can be explored by policy makers to target unwarranted variations in involuntary care worldwide, notably the development of upstream and downstream care in the community. In France, an increase in the avail-ability of community-based private psychiatrists through their better repartition is a lever which could be mobilized. This has already been advocated by international recom-mendations which support a homogenous geographical distribution of mental health professionals, in line with population needs, and equal access to mental health care for all [62, 63]. An increase in the availability of down-stream alternatives to hospitalization such as housing in-stitutions for disabled individuals could also be planned.
Additional file
Additional file 1:Description of the different databases used in the study. Table including the name, main content and data compilation method for each database included in the study. (DOCX 17 kb)
Abbreviations
95% CI:95% confidence intervals; CNIL: French data protection authority; CV: Coefficient of variation; FDep: French deprivation index; GP: General practitioner; ICD-10: International classification of diseases, tenth revision; Q1: Upper limit of the first quartile; Q3: Lower limit of the last quartile; RIM-P: Recueil d’informations médicalisé en psychiatrie, French national psychiatric discharge database; SAE: Statistique annuelle des établissements de santé, French annual national survey on health care providers; SD: Standard deviation
Acknowledgements
The authors are indebted to Dr. Morgane Michel for her proof-reading of the manuscript.
Funding
This study received funding from the French national research agency (project ANR-13-SAMA-0009-01). This agency had no role in the conception and design of the study, in the acquisition, analysis and interpretation of data or in the writing of the manuscript.
Availability of data and materials
The datasets generated and/or analysed during the current study are available from the corresponding author on request and in compliance with requirements from the French data protection authority.
Authors’ contributions
CG participated in the conception and design of the study, in the acquisition, analysis and interpretation of data and wrote the manuscript. JG participated in the acquisition, analysis and interpretation of data. JT participated in the acquisition and analysis of data. JM participated in the conception and design of the study and in the acquisition of data. JR participated in the conception and design of the study and in the interpretation of data. KC participated in the conception and design of the study, in the interpretation of data and in the drafting of the manuscript. All authors give final approval of the manuscript submitted.
Ethics approval and consent to participate
Authorization to access the different databases used for the purpose of this research was obtained from the French data protection authority (CNIL) in August 2014 (Decision DE-2014-090).
No informed consent was required from patients as this research did not involve human and/or animal experimentation and as the analysed data was entirely anonymized.
Consent for publication Not applicable. Competing interests
The authors declare that they have no competing interests.
Publisher’s Note
Springer Nature remains neutral with regard to jurisdictional claims in published maps and institutional affiliations.
Author details
1ECEVE, UMRS 1123, Université Paris Diderot, Sorbonne Paris Cité, INSERM,
Paris, France.2AP-HP, URC Eco, Paris, France.3National Conservatory of Arts and Crafts, LIRSA, 4603 Paris, EA, France.4World Health Organization
Collaborating Centre for Research and Training in Mental Health, Lille, France.
Received: 24 August 2017 Accepted: 27 March 2018
References
1. Salize H, Drebing H, Peitz M. Compulsory admission and involuntary treatment of mentally ill patients - legislation and practice in EU-member states. Mannheim: Central institute of mental health; 2002.
2. Fistein EC, Holland AJ, Clare ICH, Gunn MJ. A comparison of mental health legislation from diverse commonwealth jurisdictions. Int J Law Psychiatry. 2009;32:147–55.
3. Katsakou C, Priebe S. Outcomes of involuntary hospital admission - a review. Acta Psychiatr Scand. 2006;114:232–41.
4. Center for quality assessment and improvement in mental health. Quality measure inventory. [Internet]. 2015 [cited 2015 Jun 30]. Available from:
http://www.cqaimh.org/NIMHQM.htm.
5. Donisi V, Tedeschi F, Salazzari D, Amaddeo F. Differences in the use of involuntary admission across the Veneto region: which role for individual and contextual variables? Epidemiol Psychiatr Sci. 2016;25:49–57. 6. Hermann C. Improving mental healthcare. A guide to measurement-based
quality improvement. Arlington, Etats-Unis: American psychiatric publishing; 2006.
7. World Health Organization. WHO QualityRights tool kit. Assessing and improving quality and human rights in mental health and social care facilities. Geneva: World Health Organization; 2012.
8. Salize HJ, Dressing H. Coercion, involuntary treatment and quality of mental health care: is there any link? Curr Opin Psychiatry. 2005;18:576–84. 9. Siponen U, Välimäki M, Kaivosoja M, Marttunen M, Kaltiala-Heino R. A
comparison of two hospital districts with low and high figures in the compulsory care of minors: an ecological study. Soc Psychiatry Psychiatr Epidemiol. 2011;46:661–70.
10. Emons B, Haussleiter IS, Kalthoff J, Schramm A, Hoffmann K, Jendreyschak J, et al. Impact of social-psychiatric services and psychiatric clinics on involuntary admissions. Int J Soc Psychiatry. 2014;60:672–80.
11. Hattori I, Higashi T. Socioeconomic and familial factors in the involuntary hospitalization of patients with schizophrenia. Psychiatry Clin Neurosci. 2004;58:8–15.
12. Mercuri M, Gafni A. Medical practice variations: what the literature tells us (or does not) about what are warranted and unwarranted variations. J Eval Clin Pract. 2011;17:671–7.
13. Organisation for economic cooperation and development. Geographic variations in health care. What do we know and what can be done to improve health system performance? [Internet]. Paris: Organisation for economic cooperation and development; 2014 [cited 2015 Mar 3]. Available from: http://www.oecd.org/health/geographic-variations-in-health-care-9789264216594-en.htm.
14. Wennberg J. Time to tackle unwarranted variations in practice. BMJ. 2011; 342:d1513.
15. Lay B, Nordt C, Rössler W. Variation in use of coercive measures in psychiatric hospitals. Eur Psychiatry J Assoc Eur Psychiatr. 2011;26:244–51. 16. Wierdsma AI, Mulder CL. Does mental health service integration affect
compulsory admissions? Int J Integr Care. 2009;9:e90. 17. Legifrance. Circulaire du 15 mars 1960 relative au programme
d’organisation et d’équipement des départements en matière de lutte contre les maladies mentales. [Internet]. 1960 [cited 2014 Nov 17]. Available from:http://www.chameaupsy.com/images/stories/systeme/doc-archives/ circulaires/circulaire-15-mars-1960.pdf.
18. Legifrance. LOI n° 2011–803 du 5 juillet 2011 relative aux droits et à la protection des personnes faisant l’objet de soins psychiatriques et aux modalités de leur prise en charge [Internet]. 2011 [cited 2014 Oct 23]. Available from:https://www.legifrance.gouv.fr/affichTexte.do?cidTexte= JORFTEXT000024312722&categorieLien=id.
19. Technical agency for information on hospital care. Base nationale RIM-P [Internet]. 2012 [cited 2016 Dec 5]. Available from:http://www.atih.sante.fr/ base-nationale-rim-p.
20. Ministry of Health. SAE [Internet]. 2012 [cited 2017 Feb 6]. Available from:
https://www.sae-diffusion.sante.gouv.fr/sae-diffusion/recherche.htm. 21. Garnick DW, Luft HS, Robinson JC, Tetreault J. Appropriate measures of
hospital market areas. Health Serv Res. 1987;22:69–89.
22. Legifrance. Décret n°86–602 du 14 mars 1986 relatif à la lutte contre les maladies mentales et à l’organisation de la sectorisation psychiatrique. [Internet]. 1986 [cited 2015 Apr 22]. Available from:http://www.legifrance.gouv. fr/affichTexte.do?cidTexte=LEGITEXT000006065611&dateTexte=20050725. 23. World Health Organization. ICD-10 Version:2010 [Internet]. 2010 [cited 2016 Mar
18]. Available from:http://apps.who.int/classifications/icd10/browse/2010/en. 24. Haro JM, Ayuso-Mateos JL, Bitter I, Demotes-Mainard J, Leboyer M, Lewis
SW, et al. ROAMER: roadmap for mental health research in Europe. Int J Methods Psychiatr Res. 2014;23(Suppl 1):1–14.
25. Prigent A, Auraaen A, Kamendje-Tchokobou B, Durand-Zaleski I, Chevreul K. Health-related quality of life and utility scores in people with mental disorders: a comparison with the non-mentally ill general population. Int J Environ Res Public Health. 2014;11:2804–17.
26. National institute for statistical and economic studies. Base permanente des équipements [Internet]. 2010 [cited 2017 Aug 18]. Available from: /fr/ datasets/base-permanente-des-equipements-1/.
27. Pages jaunes [Internet]. 2012 [cited 2015 Jul 27]. Available from:http://www. pagesjaunes.fr/.
28. Ministry of Health. Fichier national des établissements sanitaires et sociaux [Internet]. [cited 2017 Jun 1]. Available from:http://finess.sante.gouv.fr/jsp/ index.jsp.
29. Epidemiological center on medical causes of death. Causes de mortalité [Internet]. 2012 [cited 2017 Aug 18]. Available from:http://www.cepidc. inserm.fr/inserm/html/index2.htm.
30. Institute for research and information in health economics. Eco-Santé France, Régions & Départements [Internet]. 2012 [cited 2017 Aug 18]. Available from: http://www.irdes.fr/recherche/eco-sante/regions-et-departements.html.
31. National institute for statistical and economic studies. Les résultats des recensements de la population [Internet]. 2012 [cited 2017 Aug 18]. Available from:https://www.insee.fr/fr/information/2008354. 32. Technical agency for information on hospital care. Programme de
médicalisation des systèmes d’information en médecine, chirurgie, obstétrique et odontologie (PMSI MCO) [Internet]. [cited 2016 Dec 2]. Available from:http://www.atih.sante.fr/mco/presentation.
33. Almog M, Curtis S, Copeland A, Congdon P. Geographical variation in acute psychiatric admissions within new York City 1990-2000: growing inequalities in service use? Soc Sci Med 1982. 2004;59:361–76.
34. Payne JN, Coy J, Milner PC, Patterson S. Are deprivation indicators a proxy for morbidity? A comparison of the prevalence of arthritis, depression, dyspepsia, obesity and respiratory symptoms with unemployment rates and Jarman scores. J Public Health Med. 1993;15:161–70.
35. Schulz M, Czihal T, Erhart M, Stillfried D. Correlation between area-level sociodemographic patterns and estimates of need for medical care. Gesundheitswesen Bundesverb Arzte Offentlichen Gesundheitsdienstes Ger. 2016;78:290–7.
36. Rey G, Jougla E, Fouillet A, Hémon D. Ecological association between a deprivation index and mortality in France over the period 1997 - 2001: variations with spatial scale, degree of urbanicity, age, gender and cause of death. BMC Public Health. 2009;9:33.
37. Rey G, Rican S, Jougla E. Mesure des inégalités de mortalité par cause de décès. Approche écologique à l’aide d’un indice de désavantage social. Bul Epidémiol Hebd. 2011;8-9:87–90.
38. Windenberger F, Rican S, Jougla E, Rey G. Spatiotemporal association between deprivation and mortality: trends in France during the nineties. Eur J Pub Health. 2012;22:347–53.
39. Coldefy M, Com-Ruelle L, Lucas-Gabrielli V, Marcoux L. Les distances d’accès aux soins en France métropolitaine au 1er janvier 2007 [Internet]. Paris: Institut de recherche et documentation en économie de la santé; 2011 [cited 2015 May 23]. Available from:http://www.irdes.fr/Publications/ Rapports2011/rap1838.pdf.
40. National institute for statistical and economic studies. Définitions, méthodes et qualité - base des unités urbaines [Internet]. 2010 [cited 2017 Aug 18]. Available from:https://www.insee.fr/fr/information/2115011.
41. Abdi H. Coefficient of variation. Encycl res des. Thousand oaks, Etats-Unis: SAGE; 2010. p. 170–1.
42. Zulian G, Donisi V, Secco G, Pertile R, Tansella M, Amaddeo F. How are caseload and service utilisation of psychiatric services influenced by distance? A geographical approach to the study of community-based mental health services. Soc Psychiatry Psychiatr Epidemiol. 2011;46:881–91. 43. Calderón-Larrañaga A, Soljak M, Cowling TE, Gaitatzis A, Majeed A.
Association of primary care factors with hospital admissions for epilepsy in England, 2004-2010: national observational study. Seizure. 2014;23:657–61. 44. Curtis S, Copeland A, Fagg J, Congdon P, Almog M, Fitzpatrick J. The
ecological relationship between deprivation, social isolation and rates of hospital admission for acute psychiatric care: a comparison of London and new York City. Health Place. 2006;12:19–37.
45. World Health Organisation. Disease burden and mortality estimates [Internet]. WHO. [cited 2018 Feb 28]. Available from:http://www.who.int/ healthinfo/global_burden_disease/estimates/en/.
46. World Bank. Population, female (% of total) | Data [Internet]. [cited 2018 Feb 28]. Available from:https://data.worldbank.org/indicator/SP.POP.TOTL.FE.ZS. 47. Eurostat. Population age structure by major age groups, 2006 and 2016 (% of the
total population) [Internet]. [cited 2018 Feb 28]. Available from:http://ec.europa. eu/eurostat/statistics-explained/index.php/File:Population_age_structure_by_ major_age_groups,_2006_and_2016_(%25_of_the_total_population).png. 48. World Bank. Population ages 15–64 (% of total) [Internet]. [cited 2018 Feb 28].
Available from:https://data.worldbank.org/indicator/SP.POP.1564.TO.ZS?view=map. 49. Girolamo GD, Barbato A, Bracco R, Gaddini A, Miglio R, Morosini P, et al.
Characteristics and activities of acute psychiatric in-patient facilities: national survey in Italy. Br J Psychiatry. 2007;191:170–7.
50. Salize HJ, Dressing H. Epidemiology of involuntary placement of mentally ill people across the European Union. Br J Psychiatry J Ment Sci. 2004;184:163–8.
51. Coldefy M. L’évolution des dispositifs de soins psychiatriques en Allemagne, Angleterre, France et Italie : similitudes et divergences. Quest Déconomie Santé; 2012. p. 1–8.
52. Lorant V, Depuydt C, Gillain B, Guillet A, Dubois V. Involuntary commitment in psychiatric care: what drives the decision? Soc Psychiatry Psychiatr Epidemiol. 2007;42:360–5.
53. Segal SP, Laurie TA, Segal MJ. Factors in the use of coercive retention in civil commitment evaluations in psychiatric emergency services. Psychiatr Serv Wash DC. 2001;52:514–20.
54. Norton J, David M, Gandubert C, Bouvier C, Gutierrez L-A, Frangeuil A, et al. [Ability of French General Practitioners to detect common mental disorders identified using the Patient Health Questionnaire: Has this changed with the introduction of gatekeeping and registration with a chosen doctor?]. L’Encephale. 2016;.
55. Norton J, de Roquefeuil G, David M, Boulenger J-P, Ritchie K, Mann A. Prevalence of psychiatric disorders in French general practice using the patient health questionnaire: comparison with GP case-recognition and psychotropic medication prescription. L'Encéphale. 2009;35:560–9. 56. Laforcade M. Rapport relatif à la santé mentale [Internet]. Paris: Ministère
des affaires sociales et de la santé; 2016 [cited 2017 Apr 18]. Available from:
http://social-sante.gouv.fr/IMG/pdf/dgos_rapport_laforcade_mission_sante_ mentale_011016.pdf.
57. Dezetter A, Briffault X, Bruffaerts R, De Graaf R, Alonso J, König HH, et al. Use of general practitioners versus mental health professionals in six European countries: the decisive role of the organization of mental health-care systems. Soc Psychiatry Psychiatr Epidemiol. 2013;48:137–49.
58. Direction de la recherche, des études, de l’évaluation et des statistiques. Organisation de l’offre de soins en psychiatrie et santé mentale [Internet]. Paris: Ministère des affaires sociales et de la santé; 2014 [cited 2017 May 12]. Available from:http://drees.social-sante.gouv.fr/IMG/pdf/dt129.pdf. 59. Fernandez A, Gillespie JA, Smith-Merry J, Feng X, Astell-Burt T, Maas C, et al.
Integrated mental health atlas of the western Sydney local Health District: gaps and recommendations. Aust Health Rev Publ Aust Hosp Assoc. 2016; 41(1):38–44.
60. Salvador-Carulla L, Alvarez-Galvez J, Romero C, Gutiérrez-Colosía MR, Weber G, McDaid D, et al. Evaluation of an integrated system for classification, assessment and comparison of services for long-term care in Europe: the eDESDE-LTC study. BMC Health Serv Res. 2013;13:218.
61. Simon P.“Ethnic” statistics and data protection in the Council of Europe countries. Study report. [internet]. Strasbourg: Conseil de l’Europe; 2007 [cited 2017 May 23]. Available from:https://www.coe.int/t/dghl/monitoring/ ecri/activities/Themes/Ethnic_statistics_and_data_protection.pdf. 62. World Health Organization. Mental health action plan 2013–2020. Geneva:
World Health Organization; 2013.
63. World Health Organization. World health organization assessment instrument for mental health systems. WHO-AIMS version 2.2. Geneva: World Health Organization; 2005.
• We accept pre-submission inquiries
• Our selector tool helps you to find the most relevant journal • We provide round the clock customer support
• Convenient online submission • Thorough peer review
• Inclusion in PubMed and all major indexing services • Maximum visibility for your research
Submit your manuscript at www.biomedcentral.com/submit