Design and Fabrication of a DC Feeder System of
New TF Magnet Power Supply for
Accelerator-Based In-Situ Materials Surveillance in Alcator C-Mod
The MIT Faculty has made this article openly available.
Please share
how this access benefits you. Your story matters.
Citation
Zhou, Lihua. “Design and Fabrication of a DC Feeder System of New
TF Magnet Power Supply for Accelerator-Based In-Situ Materials
Surveillance in Alcator C-Mod.” Fusion Science and Technology 68,
no. 2 (July 2015).
As Published
http://dx.doi.org/10.13182/FST14-933
Publisher
American Nuclear Society
Version
Original manuscript
Citable link
http://hdl.handle.net/1721.1/108724
Terms of Use
Creative Commons Attribution-Noncommercial-Share Alike
Detailed Terms
http://creativecommons.org/licenses/by-nc-sa/4.0/
December, 2014
Plasma Science and Fusion Center
Massachusetts Institute of Technology
Cambridge MA 02139 USA
This work was supported by the U.S. Department of Energy, Grant No.
DE-FC02-99ER54512. Reproduction, translation, publication, use and disposal, in whole or in part,
by or for the United States government is permitted.
PSFC/JA-14-31
Design, Analysis and Fabrication of
a New Magnet Power Supply System for
Accelerator-Based In-Situ Materials Surveillance in
Alcator C-Mod
Zhou L., Vieira R.F., Doody J., Beck W.K., Terry D.R.,
Cochran W., Irby J.H., Hartwig Z., Barnard H.S., Sorbom B.N.,
Whyte D.G.
DESIGN, ANALYSIS AND FABRICATION OF A NEW MAGNET POWER SUPPLY SYSTEM FOR ACCELERATOR-BASED IN-SITU MATERIALS SURVEILLANCE IN ALCATOR C-MOD
Lihua Zhou, Rui Vieira, Jeffrey Doody,William Beck, David Terry, William Cochran, James Irby, Zach Hartwig, Harold Barnard, Brandon Sorbom, Dennis Whyte
Massachusetts Institute of Technology, Plasma Science and Fusion Center, Cambridge, MA 02139, USA, lihua@psfc.mit.edu
Advanced Plasma Material Interaction (PMI) science requires in-situ time and space-resolved measurements over a large area of Plasma Facing Component (PFC) surfaces to study fuel retention & recovery, erosion & redeposition, material mixing, etc. A novel PFC diagnostic technique Accelerator-based In-situ Materials Surveillance (AIMS) has been developed for Alcator C-Mod. At present, the AIMS diagnostic covers a relatively small 35 cm poloidal section of the inner wall PFCs at single toroidal angle; an upgrade is now underway for the toroidal and poloidal C-Mod magnet power supplies that will enable nearly full poloidal (about 124 cm) and 40 degree toroidal PFC coverage.
This paper will introduce the design, analysis and fabrication of the new magnet power supply system for this upgrade. It will cover three areas. First, the design of the busbar system and its support structures will be presented. The power supply includes power supply, bidirectional crowbar and varistor protection assemblies, and a high current bus switch. The busbar is required to carry 15 kA current for long pulse operation of up to 25 minutes. A fault condition with 400 kA for 1 second is possible. More difficult is that the layout of the busbar should not conflict with the existing magnet systems or their support structures in the densely populated power room. New support structures also need to fit. Secondly, multi-physics analyses involved in the design will be presented. Electro-magnetic analysis is required to evaluate the spreading load of the two current-carrying busbars while Joule heating analysis is needed to evaluate the temperature rise in the material. Structural analysis is necessary to guarantee that the support structures will stand the spreading load plus weight of the busbars. All analyses will be done using finite element analysis (FEA) software COMSOL, which has been successfully used in previous analyses for C-Mod. Traditional analytical calculations will also be included to validate the FEA results. Finally, the fabrication of the whole system will be described.
I. INTRODUCTION
In the tokamak Alcator C-Mod, AIMS provides advances in surface diagnostic capabilities of Plasma Facing Components (PFC). AIMS measures the effects of plasma material interactions with unprecedented temporal (a few seconds, after each shot) and spatial resolution (2 cm). Measurements are made in-situ, without vacuum break, over a large poloidal/toroidal range, and are non-destructive to material. AIMS can directly measure erosion/deposition, retention of hydrogen isotopes, migration and mixing of plasma facing materials. 1,2
The measurement range of current AIMS is 35 cm along poloidal direction at a specific toroidal angle. Ideally, it can scan up to 40 degrees toroidally and full poloidal coverage (about 124 cm) at any toroidal angle.
New magnet power supplies will dramatically improve the spatial coverage of measurements. In this paper, the technical requirements, busbar layout, and design of support structure are presented in Section II, and related multi-physics analyses are presented in Section III. Section IV summarizes the work with a brief statement on the fabrication of the power supply system.
II. DESIGN OF THE POWER SUPPLY SYSTEM The upgrade of the power supply system includes poloidal field upgrade, RF amplifier and Toroidal Field (TF) upgrade. This paper focuses on the TF power supply upgrade. An existing power supply will be re-purposed for the poloidal field supply upgrade. The following lists the technical requirements for the TF upgrade design:
Fault level: 400 kA for 1 second
Continuous current rating (
I
total): +/- 15 kA Voltage rating (V
total): +/- 50 V Max. permissible busbar operating temperature: 65 ºC
Permissible busbar final temperature at the end of the fault: 200 ºC
Max. duration of continuous current: 25 min. Fig. 1 shows the preferred upgraded AIMS TF power supply operation.
Fig. 1. Top: TF power supply load current. Bottom: The TF power supply output voltage. +/-50 V range allows current levels to be changed quickly to optimize data collection time.
II.A. Busbar Design and Layout
The busbar material is aluminum alloy 6061 T6511. The first part of the busbar design is to find out the minimum cross-sectional area from the following equation:3
t A I k sc t
20 2 1 100(1)
where
t is temperature rise (45 ºC), k is 1.166 for aluminum,I
scis symmetrical fault current r.m.s. (400 kA), A is cross-sectional area of the conductor (mm2),20
is temperature coefficient of resistance at 20 ºC/ ºC, which is 0.00363 for aluminum alloys; is operating temperature of the conductor at which the fault occurs (65 ºC), and t is duration of fault (s).Based on Eq.1, the minimum area is 7.973 x 10⁻³ m2.
The busbar with 304.8 x 38.1 mm was selected, and its cross-sectional area of 1.16 x 10⁻² m2 meets the
requirement.
The busbars are placed parallel to each other about 343 mm apart. Including the connection between busbar and power supply, there are total 16 joints.
As there are some existing busbars, only partial busbars needed to be added. The two-way length of the new busbars is about 22.7 m and that of the existing ones is about 13.4 m, which yields a total length of about 36.1 m. Maximum mounting height is 3.7 m and weight of the new busbars is 711 kg. When existing and new busbars are considered, the overall weight is 1,131 kg.
II.B. Busbar Support Structure
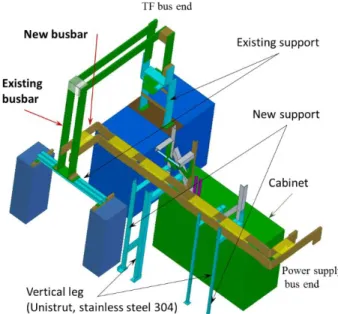
As shown in Fig. 2, the existing support structure for the existing busbars will be used. New support structures for the new busbar need to be added.
In the new support structure, legs and lower pads are Unistrut stainless steel 304. The balance is G10 (fiberglass epoxy laminate insulating sheet) with thickness 12.7 mm).4,5
Fig. 2. Layout of busbars and their support structures. II.C. Power Supply and Related Components
The new power supply is connected to one end of the new busbar. Existing TF busbars to Alcator C-Mod tokamak are connected to the other end of the new busbar. The power supply system includes the power supply itself, varistor protection assembly, and others.
II.C.1.The Power Supply Itself
A six pulse 4-quadrant dual lockout converter power supply is used. Estimated dimensions of the power supply cabinet (length x width x height) are 3.1 x 1.4 x 2.8 m.
II.C.2. Varistor Protection Assembly
The Varistor Protection Assembly (VPS) connects across the supply output bus, providing fast passive protection against bus overvoltage. It is located on the power supply side of high current switch, and backs up the power supply auto-crowbar system. The clamping voltage is 1,500 V, and insulation is rated at 5 kV for 1 min.
The first design step is to check the current rating of each disc to decide how many discs are needed. The current rating for each disc is 250 A, so the current rating for each unit (6 discs) is 1.5 kA. As the total current is 15 kA, at least 10 units are needed. To keep a design margin, 15 units are selected. Each disc sees 167 A, less than the 250 A/disc rating.Fig. 3 shows one of the 15 varistor units.6
Secondly, the energy rating of each disc must be checked. The energy rating for each disc is 75 kJ. For our application, the total current
I
totalis 15 kA, inductance1
L
= 0.007 H, so the total energy can be calculated as follows. ) ( 5 . 787 2 1 2 1 I kJ L E total (2)As there are 90 discs, the energy for each disc is 8.75 kJ, which is less than the 75 kJ/disc rating.
Fig. 3. CAD model of one of the f15 varistor units in the varistor protection assembly. Material of discs are silicon carbide. Disc diameter is 152 mm, and disc thickness is 20 mm.
II.C.3. Other Power Supply Components
Other requirements for the TF upgrade include an automatic, self-powered, bidirectional crowbar circuit, and a high current double-pole pneumatically-actuated switch (18 kA/pole) to connect the TF power supply to the TF bus during AIMS operation. New controls must coordinate operation with existing C-Mod systems.
III. ANALYSES RELATED TO THE POWER SUPPLY SYSTEM
After the preliminary layout of the busbars and corresponding support structures was done, relevant analyses were performed to either confirm the design is feasible or make suggestions on the modification of the relevant parts. The analyses are presented in the following order.
Joule heating of the busbar
Electromagnetic analysis of the busbar
Structural analysis of busbar support structures
Resistive heating of one varistor disc
Electromagnetic analysis of one varistor disc III.A. Joule Heating of the Busbar
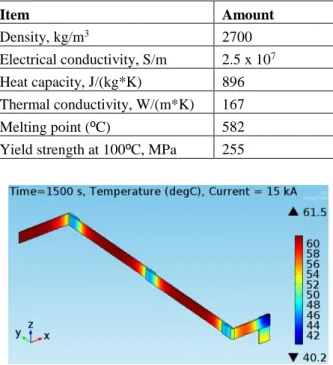
A FEA model of the new busbar is created. The current running through the busbar is 15 kA for 25 minutes. Initial temperature is 25 ºC. The material properties of the aluminum alloy are listed in TABLE I.7
As shown in Fig. 4, maximum temperature after 25 min. is 61.5ºC, which is below the permissible level (65 ºC).
Joule heating analysis has also been performed for a fault condition (400 kA for 1 second), the maximum temperature is 75 ºC, which is below the allowable (200 ºC).
TABLE I. Material Properties of Aluminum 6061 T6511
Item Amount Density, kg/m3 2700 Electrical conductivity, S/m 2.5 x 10⁷ Heat capacity, J/(kg*K) 896 Thermal conductivity, W/(m*K) 167 Melting point (ºC) 582 Yield strength at 100ºC, MPa 255
Fig. 4. Temperature distribution in busbar. Continuous operation, current 15 kA for 25 minutes.
III.B. Electromagnetic Analysis of the Busbar
When two busbars are placed parallel to each other with current of opposite direction, there will be a load trying to push the two parallel busbars apart called the spreading load.
A 2D FEA model is created to estimate this spreading load and resulting stress. The length out of the 2D plane is the length of new busbar (one way direction) 11.35 m.
The calculated spreading load is about 1,338 N. The von Mises stress in busbar is shown in Fig. 5. The deformation is exaggerated (scaled by 5 x 10⁵) to show
the tendency to push the two parallel busbars apart. The stress in the busbar is about 11.9 kPA, which is well below the allowable 170 MPa (two thirds of the yield strength of the material).
Fig. 5. von Mises stress in busbar from electromagnetic analysis of the busbar. For viewing purposes, the deformation is exaggerated by scale 5 x 10⁵.
III.C. Structural Analysis of the Busbar Support Structure
The weight of the new busbars is estimated by the following equation where density is 2700
3
m kg
, total length l is 22.7 m, widthwis 304.8 mm and thickness t is 38.1 mm. Thus, the total weight is 711.0 kg.
) ( 0 . 711 kg t w l Wg
(3)The weight needs to be carried by the support structure. Material properties of G10 are density 1800
3
m kg
, Young’s modulus 18.6 GPa and Poisson’s ratio 0.15. Maximum stress in the structure is benign, as shown in Fig. 6, which is within the allowable (Aluminum alloy 170 MPa, G10 175 MPa, stainless steel 304 143 MPa). 5,8
As the electromagnetic stress is much less (order of 104 Pa rather than 106 Pa), it can be ignored.
Fig. 6. Stress in busbar supports.
III.D. Resistive Heating Analysis of One Varistor Disc
Initial temperature is 25 ºC, so the temperature rise for one disc is 12 ºC with input energy of 8.75 kJ. Regarding cooling, free air convection is applied and the convection coefficient is 15
K m
W
2 . It takes about 1.5~2
hours to cool down to the initial temperature from peak temperature. Both temperature and cooling time are in agreement with vendor information.
To confirm the FEA simulation, an analytical calculation of the temperature rise is also done.
The mass of one disc can be calculated as follows where D is disc outer diameter (0.152 m),d is disc inner diameter (0.012 m), L is disc thickness (0.02 m) andis disc density (2,350 3 m kg ). ) ( 85 . 0 ) ( 4 2 2 kg L d D m
(4)The heat gain calculation is based on the following equation where q is the energy gained (J),Cp is the specific heat (
K kg
J
), m is the mass (kg), and T is the
change in temperature (C).9 ) ( 3 . 12 85 . 0 840 10 75 . 8 3 C m C q T p (5)
In reality, part of the energy is stored in the components other than the silicon carbide disc. The disc temperature change is smaller than the number estimated here since the calculation is conservative.
Calculated thermal stress is based on this equation:10 ) ( 40 . 0 ) ( T L MPa E
(6)where
is the thermal stress due to thermal expansion (Pa), E is the Young’s modulus (410 GPa),
is the strain (no unit),
is the coefficient of thermal expansion ( C m m 1064 ), T is the change in temperature (12.3 C
) and L is disc thickness (0.02 m). The disc is fixed as shown in Fig. 7.
This stress is along the axial direction. Similarly, in the radial direction, since the outer diameter is 0.152 m and the radius is 0.076 m, the stress is 1.52 MPa. The stress is based on temperature from Eq. 5 (12.3 ºC). If the temperature used is lower, the max. stress is even smaller.
III.E. Electromagnetic Analysis of One Varistor Disc The current flow path for one varistor unit is analyzed and shown in Fig. 7. Furthermore, stress analysis due to the electromagnetic force is simulated, and maximum stress in each disc is 112 MPa, which is within the allowable (207 MPa for SiC).
Fig. 7. Current flow path in each varistor unit. The terminals are rotated and projected to paper.
IV. CONCLUSIONS
A new magnet power supply system is proposed for purpose of enlarging the spatial measurement range of Accelerator-based In-situ Material Surveillance in Alcator C-Mod from 35 cm to 124 cm poloidally and to 40 degree toroidally. Busbars, corresponding support structure, power supply footprint, and varistor protection assembly are designed. Multi-physics analyses indicate the design meets all requirements. All component drawings have been completed and the system is ready for fabrication. Final installation of the system will be initiated when the power supply is procured and in place.
ACKNOWLEDGMENTS
This work is using the Alcator C-Mod tokamak, a US DOE Office of Science user facility.
REFERENCES
1. (2014, Nov. 30). Z.S. HARTWIG, H.S. BARNARD, R.C. LANZA, B.N. SORBOM, P.W. STAHLE and D.G. WHYTE, “An In Situ Accelerator-based Diagnostic for Plasma-Material Interactions Science on Magnetic Fusion Devices,” Review of Scientific
Instruments,84,123503(2013).
http://scitation.aip.org/content/aip/journal/rsi/84/12/10. 1063/1.4832420.
2. (2014, Nov. 30). H.S. BARNARD, et al., “In-situ Erosion and Deposition Measurement of Plasma-facing Surfaces in Alcator C-Mod,” 56th Annual
Meeting of the APS Division of Plasma Physics, New
Orleans, LA, USA,Oct.27-31,2014,
http://www.psfc.mit.edu/research/alcator/pubs/APS/A
PS2014/Barnard_APS-invited_2014.pdf.
3. (2014, Nov. 30). “Carrying power through metal-enclosed bus systems” in book “Electrical Power
Engineering Reference & Application Handbook”,
page 999, http://www.electricalengineering- book.com/carrying-power-through-metal-enclosed-bus-systems.html.
4. (2014, Nov. 30). Website of Unistrut.
http://www.unistrutsales.com/?gclid=CI6Wm82w0sA
CFScV7Aod4QMATA.
5. (2014, Nov. 30). Material property of G10 fiberglass epoxy laminate sheet.
http://www.matweb.com/search/DataSheet.aspx?MatG
UID=8337b2d050d44da1b8a9a5e61b0d5f85.
http://www.bnl.gov/magnets/staff/gupta/scmag-course/Materials%20ReferenceData.pdf.
6. (2014, Nov. 30). Metrosil, the varistor company.
http://www.metrosil.com/.
7. (2014, Nov. 30). Material property of Aluminum 6061 T6511,
http://www.matweb.com/search/DataSheet.aspx?MatG UID=1b8c06d0ca7c456694c7777d9e10be5b.
8. (2014, Nov. 30). Material property of stainless steel 304,
http://matweb.com/search/DataSheet.aspx?MatGUID=
abc4415b0f8b490387e3c922237098da.
9. (2014, Nov. 30). Equation to calculate heat gain.
http://www.isd622.org/cms/lib07/MN01001375/Centri city/Domain/166/Chapter%2016%20notes%20with%2
0highlighted%20answers.pdf.
10. (2014, Nov. 30). Equation to calculate thermal stress.