Characterizing and Predicting Enhancers in the Human Genome by
Megan Roytman
Submitted to the
Department of Electrical Engineering and Computer Science In Partial Fulfillment of the Requirements for the Degree of
C. r~ Ns 1"U1 E
fT
2
93
1.3RAR E
S
Master of Engineering in Electrical Engineering and Computer Science at the Massachusetts Institute of Technology
May 2013
Copyright 2013 Megan Roytman. All rights reserved.
The author hereby grants to M.I.T. permission to reproduce and to distribute publicly paper and electronic copies of this thesis document in whole and in part in any medium now known or hereafter created.
Author:
Department of Electrical Engineering and Computer Science May 22, 2013
Certified by:
Matthew L. Eaton, Thesis Supervisor
May 13
Z---Accepted by: _
V
Prof. Dennis M. Freeman, Chairman, Masters of Engineering Thesis Committee
Characterizing and Predicting Enhancers in the Human Genome by
Megan Roytman Submitted to the
Department of Electrical Engineering and Computer Science May 17, 2013
In Partial Fulfillment of the Requirements for the Degree of
Master of Engineering in Electrical Engineering and Computer Science
ABSTRACT
Characterizing the functions of sequences in the human genome is crucial for the study and treatment of human disease. Though it is known that approximately 5% of the human genome is conserved, about 40% of these sequences have yet to be characterized, many of which may be important players in human disease
pathways (1). Experimental and computational techniques have been developed which use histone modifications to segment the human genome into 25 different chromatin states, including states corresponding to various functional sequences like promoters and enhancers (4). However, the availability of this data is very limited, as these assays have been performed on a limited number of cell types, and the distribution of chromatin states varies across different cell types. We therefore took a computational rather than experimental approach to discovering
regulatory regions. We characterized the nucleotide contents, regulatory motif contents, conservation, gene distance, and human variation patterns of a subset of
these regulatory sequences. By training a generalized linear classifier on this data, we created a predictor for enhancer sequences that achieved 70% accuracy.
Table of Contents
Abstract
Table of Contents
1. Introduction
2. Methods
2.1. Datasets2.2. Positive and Negative Data for Classification 2.3. Feature Data
2.4. Classification Techniques
3. Results
3.1. Analysis of Individual Features 3.2. Overall Classification Performance
3.3. Classification Power of Individual Features
3.4. Classification of Common vs. Cell Type Specific Enhancers
4. Discussion
5. Conclusions
6. Acknowledgements
7. Bibliography
2
4
5
8
8 8 9 1112
12 17 22 2426
28
30
31
1. INTRODUCTION
A fundamental challenge when looking at the human genome is trying to tease out the important sequences from the meaningless ones. A very useful technique that points us to functional genome regions is the study of conservation patterns over different species; if a particular sequence in the genome is conserved over many organisms it is likely to have functional importance.
Comparison of the human genome with mouse, rat, and dog genomes has demonstrated that approximately 5% of all nucleotides in the genome are
conserved (1). However, only 1.5% of the sequences are actually known to code for functional proteins (1). This leaves 3.5% consisting of non-coding sequences, whose functions are likely to be regulatory in nature. To fully understand the workings of the human genome and all of its disease-causing elements, it is
necessary to identify the functions of the non-coding sequences as well as the coding ones.
These non-coding sequences frequently serve as transcription factor bindings sites, whose roles are to regulate the expression of downstream genes. Experimental and computational techniques have been developed which use histone modifications to segment the human genome into 25 different chromatin states, including states corresponding to various types of promoters, strong and weak enhancers, insulators, transcribed regions, and repressed or inactive regions
Chromatin state data has been collected for the human genome across approximately 90 different cell types. However, regulatory processes change across different cell types and there are over 200 cell types in the human body, as well as a wealth of derived experimental cell lines. Thus, a thorough analysis of
histone modifications and chromatin state annotations would include assays on all cell types. Unfortunately, performing all these assays would be a very difficult and costly task. In light of this obstacle, we sought to characterize DNA sequence patterns in different chromatin states using a computational rather than experimental approach, using classification methods.
A classifier that could predict the functionality of a DNA sequence would have very interesting applications. For example, one common method for understanding the genetic contributions to complex diseases is to study single nucleotide
polymorphisms (SNPs), often associated with specific types of cancer. To
understand whether a given SNP is functionally associated with a disease, it would be very helpful to assess whether or not it lies in a functional regulatory region. A classifier could potentially provide a score for the likelihood that any given SNP is worth pursuing as a potential contributor to disease.
To train such a classifier, the pattems we looked for included sequence-based metrics such as k-mer frequencies, regulatory motif instances, as well as
mammalian conservation and distance to the nearest gene. In order to supplement the data on mammalian conservation, we also incorporated data on human
variation, including features for SNP density and allele frequencies. These features can, to a certain extent, indicate regions of human constraint - sequences that have evolved human-specific functions, but are not conserved across mammals. In fact, studies have shown that an additional 4% of the human genome is subject to lineage-specific constraint and therefore possibly functional only in humans (3).
Here we examine the signatures of enhancers with respect to each of these
sequence- and population-based metrics. We then ultimately assess the aggregate performance of these features in predicting the enhancer chromatin states for 90 cell types that have already been profiled.
2. METHODS
2.1. Datasets
We obtained the hgl 9 chromosome 1 sequence as well as the gene annotations from ENCODE on the UCSC genome browser. A list of conserved elements in the human genome and previously identified regulatory motif data can be found in (1). Chromatin state data was obtained for a total of 90 human cell types. Data on human constraint was obtained from (3).
2.2. Positive and Negative Data for Classification
Each cell type's DNA sequence was bucketed into 200 base pair fragments, which corresponded to the bucketing in the chromatin state annotations. A fragment was considered an enhancer if it was annotated as any of the seven enhancer states
(two states each representing enhancer-like genic regions, weak enhancers, and active enhancers, as well as one poised enhancer state). In addition,
non-intergenic elements including repeats, transposons, coding regions, and 3'UTR sites were eventually filtered from the data-set in order to avoid training on already-annotated regions or regions unlikely to have regulatory importance, as described
below in Results.
When performing an aggregate analysis on the enhancers (that is, pooling designated enhancer regions from all 90 cell types), we attempted to use several different criteria for labeling a fragment as enhancer or not in a generic sense. In
our first analysis, a fragment was considered an enhancer if it was labeled as such in at least one of the cell types. However, in order to avoid training on false positive data, we performed the same analysis but excluded enhancer signals that
appeared in only one of the cell types. In addition, we performed a third analysis requiring that the enhancers appeared in at least half the cell types. In all cases, a fragment was used as a negative sample only if it did not exist as an enhancer in
any of the 90 cell types.
Due to scarce computational resources, we analyzed only chromosome 1 of the human genome in our analyses. For the purposes of classification specifically, we looked at only 10% of chromosome 1. We chose training data by randomly picking 75% of the 200bp sequences in this -30 million base pair region. The remaining 25% of the sequences were set aside for testing the classifier after building the model.
2.3. Feature Data
K-mer Counts
We characterized the DNA content of each 200bp sequence by enumerating its k-mer counts. We specifically looked at 1-k-mers, 2-k-mers, and 3-k-mers. This produced a total of 84 features, consisting of the counts of occurrences of every unique nucleotide sub-sequence. In addition, we assembled a collection of the most prevalent mers in enhancers across all cell types collectively. We filtered for
6-mers that were also found to be prevalent in the background sequences, in order to incude only features that are uniquely common in enhancers.
Omega and Pi Conservation
We characterized the extent of conservation of each 200bp sequence by looking at its omega and pi conservation patterns. For each sequence, we recorded the percent of its nucleotides that were reported as conserved, the maximum
conservation score that appeared in the segment, as well as the weighted average of the scores over all nucleotides. This created a total of six features.
Regulatory Motif Instances
We also characterized each sequence by the number of regulatory motif instances that overlapped with the region. We obtained regulatory motif data from the
Supplementary data-set information in (1). For each 200bp sequence in chromosome 1, we simply counted the number of motif instances with which it overlapped to any extent.
Distance to the Nearest Gene
We obtained gene locations from the refGene dataset in the UCSC genome browser. Each 200bp segment's location was characterized by the location of its midpoint. Distances were calculated from the midpoint of each 200bp sequence to the location of the nearest gene transcription start or end site.
SNP Density and Allele Frequency
Human variation data was obtained through (3). The SNP density feature was established by counting the number of known SNPs that could be found within each 200-bp region. On top of this measure, the average derived allele frequency for the known SNPs in the bucket was taken.
2.4. Classification Techniques
For creating our classifier, we used R, a suite of tools for statistical computing. We ended up using a total of 95 features, which are named in the above section; notably, we used many k-mer counts (84 of the 95 features for 1-mers, 2-mers, and 3-mers). From these features, we tried various classifier types from the R class libraries, including SVM classification, decision-tree classification, and linear models. From these attempts, we determined that the generalized linear model was the best option for our particular enhancer dataset. We trained the generalized
linear model on 100,000 200-bp buckets from chromosome 1, using the features detailed above.
3. RESULTS
3.1. Analysis of Individual Features
K-mer Counts
To characterize the nucleotide content of the enhancer sequences, we considered the prevalence of each unique 1 -mer, 2-mer, and 3-mer in our positive and
negative datasets. Most notably, these metrics were meant to account for the elevated GC content of enhancers versus background. This can be represented solely by the 1-mer counts. We included 2-mers and 3-mers in order to capture any additional dependencies that may exist between nucleotide positions.
We found that, on average, enhancers were composed of 47% GC, compared to 41 % for background sequences. There was, as expected, very little variation in GC
content of background sequences between cell types. However, the GC contents of enhancer sequences from different cell types varied quite a bit, ranging from average GC contents of 43% to 55%, with a fairly even distribution within this range.
In addition, we assembled a collection of the most prevalent 6-mers in enhancers across all cell types collectively. These 6-mers were intended to capture longer sequence motifs that may exist among enhancers. We filtered for 6-mers that were also found to be prevalent in the background sequences, in order to include only features that are uniquely common in enhancers. We found that approximately half
of the top 100 6-mers were also common in background sites. After filtering for these, we produced a list of 50 prevalent, enhancer-specific 6-mers. We found that the most common sequences were found in approximately 17% of enhancers, and most of the top 50 sequences could be found in close to 14% of enhancers. Below is a ranked graph depicting the prevalence of these 6-mers among the enhancer sites across all 90 cell types.
Prevalence of Most Common 6-mers in Enhancers
0.18 C 0.16 -c 0.14 LU et0.12 Ln U 0.10 L- 0.08 :3 Uo
0.02 4--0 E02 0.000 10 20 30 40 5Most Common 6-mers
Figure 1: Prevalence of common 6-mers across all cell types. Each bar indicates the fraction of enhancers in which a particular 6-mer was found - in other words, the average number of occurrences per enhancer.
As there were no 6-mers with particularly outstanding frequencies in enhancers, we simply decided to include the top 50 sequences as features in our classifier.
Omega and Pi Conservation
Each 200bp sequence was characterized by its omega and pi conservation patterns. These included the percent of its nucleotides that were reported as
conserved, the maximum conservation score that appeared in the segment, as well as the weighted average of the conservation scores over all nucleotides.
As expected, we found that enhancer sequences were significantly more conserved across mammals than background sequences, across all metrics. Below is a comparative summary of these statistics for each conservation measure we used:
Mammalian Conservation for Enhancers vs. Background
Omega Pi
Weighted Fraction Max Weighted Fraction Max
Enhancers 0.85 0.11 2.73 1.27 0.19 3.52
Background 0.44 0.06 1.49 0.69 0.11 1.91
Table 1: Average conservation patterns across all 90 cell types, recorded for both the omega and pi metrics. The weighted column indicates the fraction of
nucleotides reported as conserved, weighted by the conservation score reported at each nucleotide. The fraction column indicates the simple fraction of nucleotides that were reported as conserved, to any extent. The max column indicates the
maximum conservation score reported in the 200bp sequence. All values have been averaged over all enhancer sites, in all 90 cell types.
The statistics reported across all measures are very similar, on average indicating that enhancers show evidence of being approximately twice as conserved as background sites, according to these metrics.
We included all six of these conservation features in our original classifier. However, they were eventually combined into a single binary identifier for
conservation, which we reported as positive if 5% or more of the nucleotides in the 200bp sequence were reported as conserved by either the omega or pi
conservation metrics. These two methods proved to have comparable performance in the classification stages.
Regulatory Motif Instances
We report similar findings for the prevalence of regulatory motifs in enhancer sequences. We found that enhancers included around twice as many regulatory motifs as did background sequences. On average, these motifs could be found in approximately 60% of enhancer bins, while only 30% of background sequences contained a regulatory motif.
Distance to the Nearest Gene
Enhancers were, as expected, much closer to genes than background sequences. On average, enhancers were located approximately 20,000 nucleotides from the nearest gene. Background sequences, on the other hand, were on average located
1 million nucleotides away from the nearest gene. However, as averages in this case are not the most useful metric in understanding this distribution, we produced a histogram of enhancer distances from genes, as shown below in Figure 2. The equivalent distribution for background sequences is fairly uniform.
0.10 Distribution of Enhancer Distances from Gene
0.08 L, L-ai U - 0.06 LU 0 C 0.04 0. U 0.02 0.000 2 4 6 8
Distance from Gene (in thousands)
10
Figure 2: Histogram of enhancer distances from genes across all cell types. Each bar indicates the fraction of enhancers that were located at each distance. Most enhancers occur very close to genes - within several thousand nucleotides.
SNP Density and Allele Frequency
SNP density was slightly higher, by approximately 25%, in enhancer sequences than in background sequences. On average, enhancers had 2.5 SNPs per bucket, while background fragments contained around 2 SNPs. The difference in average allele frequency was not significant.
3.2. Overall Classification Performance
All sequences were characterized according to all the above metrics: k-mer counts, extent of conservation, occurrence of regulatory motif instances, distance to the nearest gene, SNP density and allele frequency. We performed several analyses with this data in addition to assessing the performance of the overall classifier. As detailed below, we compare the classifier's performance when varying the
stringency of our criteria for choosing enhancers (based upon the number of cell types in which the fragment was labeled as an enhancer). We found that requiring an enhancer to be present across more cell types drastically improves
classification accuracy. We also compare the classification power of each feature category individually, in order to gain an understanding of their relative usefulness in enhancer classification. We report that basic k-mer counts were the most useful feature in distinguishing enhancers from background sequences, with distance from the nearest gene and conservation also exhibiting a decent amount of
prediction power. The regulatory motif and human variation features were less useful. Finally, we assess the performance of our classifier in being able to
and negative data correspond to common and rare enhancers, rather than enhancers versus background.
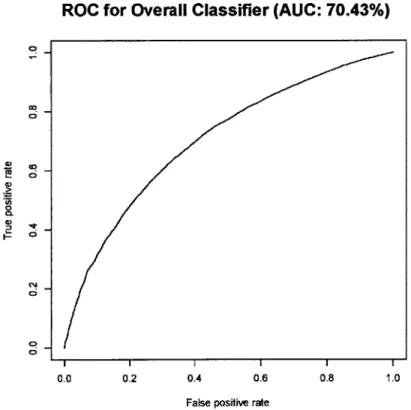
Initial Classifier Performance
The original classifier managed to correctly identify 70.43% of the testing data, leaving 29.57% of instances incorrectly classified. In this iteration, a fragment was considered an enhancer (and therefore labeled positive) if it was designated a2s such in at least one of the 90 cell types. Negative sequences consisted of any fragment that was not labeled an enhancer in any of the cell types. Below is the
ROC for this first iteration of the classifier.
ROC for Overall Classifier (AUC: 70.43%) q _ a) a) a) 0 0. 0) (DJ 0i I I I I 0.0 0.2 0.4 0.6
False positive rate
. 1
0.8 1.0
Figure 4: The ROC be 0.70.
Reducing Dimensionality of the Feature Data
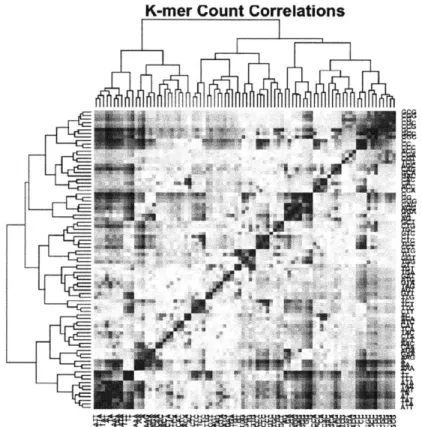
In order to improve our classifier's performance, we decided to reduce the
dimensionality of the feature set by performing a principal component analysis on the k-mer count data. There are naturally many redundancies in the 1-mer, 2-mer, and 3-mer counts we initially provided (see Figure 3), so many of the features were correlated and could be captured more succinctly.
K-mer Count Correlations
Figure 5: Correlations between the 84 1-mer, 2-mer, and 3-mer counts. Many of
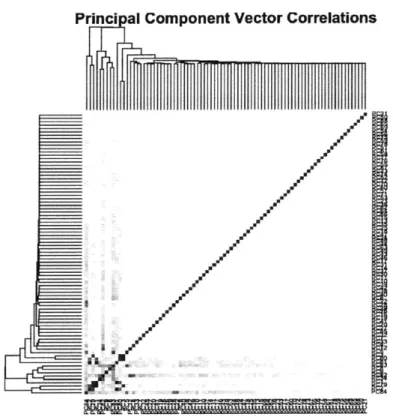
We performed principal component analysis on the k-mer matrix and produced the following correlations.
Princi al Component Vector Correlations
URI
UU
Figure 6: Correlations between the 84 principal components. Most of the correlations have been eliminated.
We chose the top five orthogonal principal components and created a classifier that took five new features - the dot products of the normalized k-mer counts with the principal component weightings. These five features replaced the 84 k-mer counts, greatly reducing the dimensionality of the feature set. However, the performance of the resulting classifier did not significantly improve.
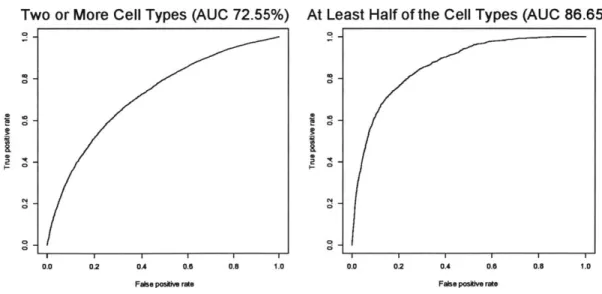
Comparing Classification Power with Different Enhancer Criteria
Here we compare the classifier's performance when varying the stringency of our criteria for choosing enhancers. This stringency was based upon the number of cell types in which the fragment was labeled as an enhancer. In our first analysis, a fragment was considered an enhancer if it was labeled as such in at least one of the cell types. However, in order to avoid training on false positive data, we
performed the same analysis but excluded enhancer signals that appeared in only one of the cell types. In addition, we performed a third analysis requiring that the enhancers appeared in at least half the cell types. The figures below depict the resulting performances of the classifier.
Two or More Cell Types (AUC 72.55%) At Least Half of the Cell Types (AUC 86.65%)
q- q ,
IR
I
2 42
O C!
0.0 0.2 0A 0.6 0.8 1.0 0.0 0.2 04 0.6 0.8 1.0
False posve rate False posve rate
Figure 7: Comparison of classification power of when criterion for identifying a segment as an enhancer becomes more stringent. As the figures show, requiring an enhancer to be present across more cell types drastically improves
As shown in the figure above, the accuracy of the classifier improves dramatically when requiring enhancers to be present in more and more cell types. The original classifier required enhancers to be present in only one cell type and achieved 70% accuracy. However, requiring enhancers to be present in at least half of the cell types resulted in an impressive classification accuracy of 87%. This indicates that the enhancer signatures across the feature set strengthen greatly for enhancers that are more common across cell types.
3.3. Classification Power of Individual Features
In order to gain an understanding of their relative usefulness in enhancer
classification, we also compare the classification power of each feature category individually. We found that k-mers had the most significant predicting power (64% accuracy), followed by distance from the nearest gene (61.93%), mammalian conservation (58.58%), regulatory motifs (54.55%), prevalence of top fifty 6-mers (51.87%), and human variation data on SNP density and allele frequency
K-mers (AUC 64.17%)
0.0 0.2 0A 0.8 0.8 1.0
False posMive rate
Conservation (AUC 58.58%)
0.0 0.2 0.4 0.8 0.8 1.0
False positve rate
Top Fifty 6-mers (AUC 51.87%)
0.0 0.2
I
S 8
I
Distance from Gene (AUC 61.93%)
C;
0.0 0.2 OA 0.8 0.8 1.0
False po051 rate
Motifs (AUC 54.55%)
C-
.-0.0 0.2 0.4 0.6 0.8 1.0 False posYe rote
Human Variation (AUC 50.91%)
-I U I a I-0.4 0.8 0.8 1.0 0.0 02 0.4 0.6 0.8
False posve rate False positive rate
1.0
I
3.4. Classification of Common vs. Cell Type Specific Enhancers
In order to understand whether common enhancers have a distinctly different signature from cell-type specific enhancers, we tested our feature set on its ability to distinguish between the two. In this framework, our positive sequences included all enhancers that could be found in at least 80 of the 90 cell types. The negative sequences consisted of enhancers that occurred in 1-10 cell types. The classifier achieved 77% accuracy, as shown below
Common vs. Cell Type Specific Enhancers (AUC: 77.63%)
II I I
0.0 0.2 0.4 0.6
False positive rate
0.8 1.0
Figure 9: Classification of common versus cell-type specific enhancers. Common enhancers occurred in 80-90 of the cell types, while the enhancers that occurred in 1-10 cell types were designated as cell-type specific.
0 _ 0 0D 6 CD 0 2 C..J 0) 0)
The classifier did fairly well at distinguishing between the two categories of enhancers. However, this may not be due to cell-type specific enhancers having their own unique signature - rather, it could simply be because common
enhancers have a much stronger signal of the same nature. In other words, cell-type specific enhancers may, to the classifier, look very much like background sequences in this context.
4. DISCUSSION
The features that turned out to be most informative for enhancer classification were k-mer counts, distance to the nearest gene, and mammalian conservation. We hoped that the SNP density and allele frequency features would contribute additionally to the classifier's accuracy, as they are meant to capture evidence of
human constraint. However, despite the correlation of SNP density and allele frequency measures with enhancer positions, these features alone may not
produce a strong enough signal, within each individual 200-bp fragment, to be useful for a classifier. Better data on human constraint may still be very helpful, as it should capture signatures that indicate functional importance outside the scope of mammalian conservation. Additionally, it is possible that a classifier
incorporating other features, like substitution frequencies, periodicity, proximity to other identified regulatory regions, or just more k-mer counts would be able to better capture some of the patterns to be discovered in enhancers.
The accuracy of the classifier did increase by an impressive amount (70% to 87%) once we considered only those enhancers that appeared in a large number of cell types. In general, there may be an issue with training on more cell-type specific enhancers. In this framework, we are essentially asking the classifier to group together sequences that may function as enhancers in one cell type, but not at all in another cell type. This may have contributed to our classifier finding it very difficult to form a comprehensive idea of what cell-type specific enhancers look like. This is intuitive, as perhaps the notion of a cell-type specific enhancer implies
that there are distinguishing processes going on in different cell types that may not be captured by sequence data alone.
Another way to improve upon our work would be to attempt to classify into more categories. Our current classifier tries only to separate instances into enhancer and
not enhancer. It would be interesting to see whether a classifier could distinguish
between three categories: common enhancer, cell-type specific enhancer, and
background site. This could give an idea of whether the signatures for common
versus cell-type specific enhancers are actually different, or if cell-type specific enhancers just exhibit a weaker version of the same signature.
5. CONCLUSIONS
We establish here that enhancers can be predicted with up to 70% accuracy using classification techniques and a basic set of sequence-based features. Though this is a modest result, it should be expected that classification based on sequence alone is unlikely to achieve very high levels of accuracy, given the variation of enhancer distributions between cell types. Instead, perhaps with improvements in accuracy, these techniques can be used to create predictions for whether a given fragment of DNA is likely to have functional importance. If, for example, we wish to understand whether a given SNP is functionally associated with a disease, a classifier could provide a score for the likelihood that this SNP is worth pursuing as a potential contributor to disease.
Moreover, we show that enhancers that are common across all cell types can be predicted with up to 87% accuracy. The prediction of common enhancers may seem like an unhelpful concept, as presumably these enhancers have already been discovered in the cell types that have been assayed for chromatin
modifications. However, it is possible that a classifier trained on strong enhancer data (enhancers identified to be present across many cell types) may even pick up enhancer signals that have not been received through analysis of histone
modifications.
As discussed previously, improvements to enhancer classification have yet to be made. Future directions in this topic might explore additional features useful for
enhancer classification and the differing signatures between common and cell-type specific enhancers. In addition, once more accurate ways of detecting human
constraint are developed, these may prove to be incredibly useful as additional features for classification, as there are likely many human-specific enhancers whose conservation signatures cannot be detected through comparison across
6. ACKNOWLEDGEMENTS
This project was completed under the guidance of Matthew L. Eaton and Lucas D. Ward, postdoctoral associates at the MIT Computational Biology group. Thanks to
Matt for helping to formulate a research problem, helping determine features for classification, and advising on the required datasets and appropriate classification techniques. Thanks to Luke for his help with capturing human variation features. Thanks also to Manolis Kellis, the head of the MIT Computational Biology group, for his guidance throughout the initial stages of the project, and for being
8. BIBLIOGRAPHY
1. Lindblad-Toh K, Garber M, Zuk 0, Lin MF, Parker BJ, et al. A high-resolution
map of human evolutionary constraint using 29 mammals, Nature (2011).
2. Ernst J, Kheradpour P, Mikkelsen TS, Shoresh N, Ward LD, et al., Systematic
analysis of chromatic state dynamics in nine human cell types, Nature (2011).
3. Lucas D. Ward, Manolis Kellis, Evidence of Abundant Purifying Selection in
Humans for Recently Acquired Regulatory Functions, Science (2012).
4. Hoffman, M. M., Ernst, J., Wilder, S. P., Kundaje, A., Harris, R. S., Libbrecht, M., Giardine, B., Ellenbogen, P. M., Bilmes, J. A., Bimey, E., et al. 2013. Integrative annotation of chromatin elements from ENCODE data. Nucleic Acids Res. 41: 827-841.