Publisher’s version / Version de l'éditeur:
Vous avez des questions? Nous pouvons vous aider. Pour communiquer directement avec un auteur, consultez la première page de la revue dans laquelle son article a été publié afin de trouver ses coordonnées. Si vous n’arrivez pas à les repérer, communiquez avec nous à PublicationsArchive-ArchivesPublications@nrc-cnrc.gc.ca.
Questions? Contact the NRC Publications Archive team at
PublicationsArchive-ArchivesPublications@nrc-cnrc.gc.ca. If you wish to email the authors directly, please see the first page of the publication for their contact information.
https://publications-cnrc.canada.ca/fra/droits
L’accès à ce site Web et l’utilisation de son contenu sont assujettis aux conditions présentées dans le site
LISEZ CES CONDITIONS ATTENTIVEMENT AVANT D’UTILISER CE SITE WEB.
Research Report (National Research Council of Canada. Institute for Research in Construction), 2011-08-01
READ THESE TERMS AND CONDITIONS CAREFULLY BEFORE USING THIS WEBSITE.
https://nrc-publications.canada.ca/eng/copyright
NRC Publications Archive Record / Notice des Archives des publications du CNRC : https://nrc-publications.canada.ca/eng/view/object/?id=5b099132-1935-4feb-aed3-bf2f7fd42d86 https://publications-cnrc.canada.ca/fra/voir/objet/?id=5b099132-1935-4feb-aed3-bf2f7fd42d86
NRC Publications Archive
Archives des publications du CNRC
For the publisher’s version, please access the DOI link below./ Pour consulter la version de l’éditeur, utilisez le lien DOI ci-dessous.
https://doi.org/10.4224/20374660
Access and use of this website and the material on it are subject to the Terms and Conditions set forth at
Evaluating the Effects of Two Energy Retrofit Strategies for Housing on the Wetting and Drying Potential of Wall Assemblies: Summary Report for Year 2007-08 Phase of the Study
Maref, W.; Rousseau, M. Z.; Armstrong, M. M.; Lee, W.; Leroux, M.; Nicholls, M.
Eva lua t ing t he Effe c t s of T w o Ene rgy Re t rofit St ra t e gie s for H ousing on t he We t t ing a nd Drying Pot e nt ia l of Wa ll Asse m blie s: Sum m a ry Re port for Y e a r 2 0 0 7 -0 8 Pha se of t he St udy
R R - 3 1 5
M a r e f , W . ; R o u s s e a u , M . Z . ; A r m s t r o n g , M . M . ; L e e , W . ; L e r o u x , M . ; N i c h o l l s , M .A u g u s t 2 0 1 1
http://www.nrc-cnrc.gc.ca/ircThe material in this document is covered by the provisions of the Copyright Act, by Canadian laws, policies, regulations and international agreements. Such provisions serve to identify the information source and, in specific instances, to prohibit reproduction of materials without
written permission. For more information visit http://laws.justice.gc.ca/en/showtdm/cs/C-42
Les renseignements dans ce document sont protégés par la Loi sur le droit d'auteur, par les lois, les politiques et les règlements du Canada et des accords internationaux. Ces dispositions permettent d'identifier la source de l'information et, dans certains cas, d'interdire la copie de
2
ACKNOWLEDGEMENTS
The authors wish to thank Natural Resources Canada (NRCan) and Canada Mortgage and Housing Corporation (CMHC) for contributing funding for this project. Funding from NRC has enabled NRC-IRC to build, operate and maintain a state-of-the-art Field Exposure of Walls facility.
Our thanks are also extended to NRC-IRC colleagues Robert Berzins, Khaled Abdulghani, Tim Aubin and Ganapathy Gnanamurugan for their precious technical contribution.
3
EXECUTIVE SUMMARY
In 2007 NRC-IRC initiated the project “Evaluating the effects of two strategies of energy
retrofit for housing on the wetting and drying potential of the wall assemblies-2007-08”.
Partnership and funding from NRCan (Housing and Buildings /Sustainable Building and Communities CANMET / Group) and CMHC (Sustainable Housing Policy and Research Group) was obtained.
The scope of work included the design of the experiments, the installation of test specimens, the commissioning of the instrumentation, the operation of the test facility, the monitoring, data collection and analysis and reporting in a project conducted at
NRC-IRC Building Envelope and Structure’s Field Exposure of Walls Facility.
Three wall test specimens were installed side-by-side into test bays; Natural weathering took place on the exterior side, while temperature, relative humidity, and pressure conditions on the interior side were varied. The impact of energy retrofit strategies on the energy performance and the durability of the exterior walls were studied. Two exterior insulation retrofit strategies were investigated; one consisted of installing a low air and vapour permeance insulation board (R10), while the second involved a high air and vapour permeance insulation (R10). These insulation materials were added to the exterior of existing RSI 3.52 (R20) 38 mm by 140 mm (2X6) traditional construction test specimens. During the course of the winter of 2007/2008 the facility was commissioned. The two retrofitted specimens were challenged with high indoor relative humidity and air pressure levels while construction deficiencies providing a path for air leakage were introduced. Data were collected to examine the hygrothermal response of the test specimens at critical locations within the test assembly, over the Fall 2007, Winter and Spring 2008. The two retrofitted test specimens were compared to one another and to a reference test specimen of traditional RSI 3.52 (R20) 38 mm by 140 mm (2X6) construction with no controlled air leakage path.
The results of this study showed that adding some thermal insulation on the exterior of an insulated stud cavity can contribute to reducing the duration of the potential for interstitial condensation but events of condensation can still take place during the coldest period of winter in a climate such as Ottawa (when other essential contributing factors are in place). The results are presented and analyzed in this report.
The study showed that necessary conditions for condensation are: cold exterior temperatures resulting in an interstitial surface temperature below the dew point of room air, an air leakage path through the wall assemblies, air pressure indoor higher than outdoor (air exfiltration drive) and indoor moisture load.
The study provided data indicating that the air and vapour permeance properties of the insulation material positioned on the exterior of the stud cavity had some effect on the moisture transport and distribution across the wall assemblies. The gradient in the air absolute moisture content across the exterior XPS foam board of Wall 2 (W2) was higher
4
than the gradient across the exterior mineral fibre insulation of Wall 3 (W3). The XPS foam exhibits lower vapour and air permeance than the mineral fibre insulation and this difference in hygric properties can explain the lower rate of moisture transmission through the XPS foam to the outdoors. As expected changing the heat, air, and moisture transfer properties of the exterior layers had an effect on the hygrothermal regime of the wall. Higher vapour pressure or absolute humidity differences were observed across layers with low air and vapour permeance.
Both wall assemblies with external thermal insulation experienced short-term wintertime condensation wetting in the stud cavity when air exfiltration was present during sufficiently cold weather conditions however both wall assemblies dried out without any apparent stains or damage to the stud cavity materials.
The research team recommends that further study of the hygrothermal response of different exterior energy retrofit of walls continue in the following manner:
1. The low permeance test specimen (Wall 2) should be monitored for another year (i.e. 2008-09)
2. Wall 2 should be compared with two reference wall assemblies, one with a poly air/vapour barrier and one without such element.
3. All three test walls should be subject to the same indoor conditions 4. All three-test walls should include an air leakage path
5. A simplified wintertime test protocol should be used. To merge with another initiative in the FEWF, in springtime, the test walls will be subjected to controlled experiments consisting of injecting water into the stud cavity to simulate rainwater leakage into the walls, and monitoring the comparative drying of the test specimens, and their resiliency to construction flaws.
5
TABLE OF CONTENTS
1 BACKGROUND ___________________________________________________ 15 2 INTRODUCTION _________________________________________________ 16 3 OBJECTIVE _____________________________________________________ 16 4 METHODOLOGY _________________________________________________ 18 4.1 General Approach ______________________________________________ 184.2 Description of Test Specimens ____________________________________ 19
4.3 Testing Protocol _______________________________________________ 25
4.3.1 Phase 1 ____________________________________________________ 26
4.3.2 Phase 2 ____________________________________________________ 26
4.3.3 Phase 3 ____________________________________________________ 27
4.4 Instrumentation ________________________________________________ 28
5 RESULTS AND DISCUSSION ______________________________________ 30
5.1 Phase 1: No challenging indoor RH and P and no deficiency in the ABS of test
specimens __________________________________________________________ 30
5.2 Phase 2: Challenging Indoor RH and P and a deficiency in the Air Barrier
Systems (ABS) of W2 and W3 test specimens ______________________________ 33
5.2.1 Configuration A2: Constant 30% Humidity, No pressure applied, A
deficiency in the ABS _______________________________________________ 35
5.2.2 Configuration B2: 50% indoor relative humidity, no induced air pressure
applied and a deficiency in the ABS ____________________________________ 40
5.2.3 Configuration C2: 30% indoor relative humidity, 5 Pa air pressure applied
and a deficiency in the ABS __________________________________________ 46
5.2.4 Configuration D2: 50% indoor relative humidity, 5 Pa air pressure applied
and a deficiency in the ABS __________________________________________ 50
5.2.5 Configuration E2: 50% Humidity, 10 Pa Chamber Pressure and a deficiency
in the ABS ________________________________________________________ 55
5.2.6 Configuration F2: Constant 50% Humidity, No pressure applied and a
deficiency in the ABS _______________________________________________ 67 5.3 Phase 3: Constant 50% Humidity, then chamber removed (room controlled at 40%), no pressure applied and a deficiency in the ABS _____________________ 74 5.3 Opening up the Test Walls- Visual Observations _________________________ 81
6 SUMMARY_______________________________________________________ 83
7 CONCLUSIONS __________________________________________________ 86
7.1 Performance of the test walls _____________________________________ 86
7.2 Instrumentation ___________________________________________________ 88
6
8 RECOMMENDATION FOR FUTURE WORK _________________________ 89
9 BIBLIOGRAPHY__________________________________________________ 90
Appendix A INSTRUMENTATION _____________________________________ 92
A.1 Types of sensors deployed _______________________________________ 92
A.1.1 RHT Sensors ______________________________________________ 92
A.1.2 Rain Gauges ______________________________________________ 93
A.1.3 Moisture Pins _____________________________________________ 94
A.1.4 Differential Pressure Transducers ______________________________ 95
A.1.5 Thermocouples ____________________________________________ 96
A.1.6 Moisture Detection Tape_____________________________________ 97
A.1.7 Heat Flux Transducers ______________________________________ 98
A.2 Deployment of sensors __________________________________________ 99
A.2.1 Wall 1 ___________________________________________________ 99
A.2.2 Wall 2 __________________________________________________ 102
A.2.3 Wall 3 __________________________________________________ 106
A.2.4 Instrumentation Common to W1, W2 and W3 ___________________ 111
7
LIST OF TABLES
Table 1: Composition of test specimens _____________________________________ 22 Table 2: Description of the 3 phases of the test protocol ________________________ 25 Table 3. Summary of test trial conditions and general observations _______________ 83
8
LIST OF FIGURES
Figure 1: Schematic diagram showing the three main components of research on building envelope performance _______________________________________________ 17 Figure 2: Location of the Test Bay on the West Façade of the NRC-IRC Ventilation and
Walls Research house _______________________________________________ 17 Figure 3: Schematic diagram of the different tasks in the project _________________ 18 Figure 4: Field Exposure of Walls facility and exterior view of the three test specimens 20 Figure 5: Elevation view from indoors of the 3 test specimens and the separating chases
_________________________________________________________________ 21 Figure 6: Vertical cross-section of the three wall specimens _____________________ 21 Figure 7: Horizontal cross section of the three wall specimens (see periphery details in
Appendix B) ______________________________________________________ 22
Figure 8: Test specimen construction – Stud cavity and air/vapour barrier __________ 23
Figure 9: Test specimen construction – Perimeter seal and drywall _______________ 23
Figure 10: Test specimen construction – Exterior sheathing membrane ____________ 24
Figure 11: Test specimen construction – Exterior insulation _____________________ 24
Figure 12: Test specimen construction - Cladding _____________________________ 25 Figure 13: Air leakage path_______________________________________________ 27 Figure 14: Leakage path and indoor climatic chamber __________________________ 27 Figure 15: Photos of instrumentation _______________________________________ 29 Figure 16: Example of the diagram showing the layout of the instrumentation at the
exterior surface of wood-based sheathing, along with the photograph of the wall specimen _________________________________________________________ 29 Figure 17: Indoor relative humidity and temperature, as well as outdoor temperature
prevailing during Phase 1.____________________________________________ 31 Figure 18: Location of the liquid detection tape on the interior surface of the sheathing
board. The colour coding for each strip of detection tape will be used in the graphs showing some wetting_______________________________________________ 31 Figure 19: Phase 1 - Sample readings from liquid detection tape on the interior face of
the wood-based sheathing ____________________________________________ 32 Figure 20: The six steps of the Phase 2 test program with corresponding indoor chamber
RH and P (above indoors) and outdoor temperature _______________________ 33 Figure 21: The six steps of the Phase 2 test program with corresponding indoor room and chamber temperature ________________________________________________ 34 Figure 22: The six steps of the Phase 2 test program with corresponding indoor room and chamber relative humidity ___________________________________________ 34
9
Figure 23: Configuration A2: Indoor climatic chamber air pressure difference, relative humidity and temperature, as well as room and outdoor temperature prevailing during test period. __________________________________________________ 35 Figure 24: Configuration A2: Snapshot of Wall 1 cross-section (coldest outdoor
temperature) ______________________________________________________ 37 Figure 25: Configuration A2: Snapshot of Wall 2 cross-section (coldest outdoor
temperature) ______________________________________________________ 37 Figure 26: Configuration A2: Snapshot of Wall 3 cross-section (coldest outdoor
temperature) ______________________________________________________ 37 Figure 27: Configuration A2: Wall 2 pressure measurements and wind data ________ 38 Figure 28: Configuration A2: Average temperature profile for the full configuration time
period ___________________________________________________________ 38 Figure 29: Configuration A2 - Temperature profile for 7:00 29-Feb-08 (the coldest
temperature for Phase 2) _____________________________________________ 39 Figure 30: Configuration A2: Average humidity ratio profile for the full configuration
time period _______________________________________________________ 39 Figure 31: Configuration B2: Indoor climatic chamber air pressure difference, relative
humidity and temperature, as well as room and outdoor temperature prevailing during test period. __________________________________________________ 40 Figure 32: Configuration B2: air pressure difference across layers of W1 (reference is
room space) and wind speed and direction. Most of the time, the test specimens were under air infiltration mode, but some short periods of air exfiltration took place. ____________________________________________________________ 41 Figure 33: Configuration B2: Average temperature gradient for the B2 test period.
Because the test specimens were under air infiltration, moisture was not entering the stud cavity of W2 and W3, and no condensation was detected on surfaces below the dew point of indoor air. ______________________________________________ 42 Figure 34: Configuration B2: Average humidity ratio gradient for the B2 test period _ 42 Figure 35: Configuration B2: humidity ratios at each layer of Wall 2 (with XPS insulating
sheathing) ________________________________________________________ 43 Figure 36: Configuration B2: humidity ratios at each layer of Wall 3 (with mineral fibre
insulating sheathing) ________________________________________________ 43
Figure 37: Configuration B2 – Humidity ratio gradient for March 8th, 08 at 21:00 (time of
peak stud cavity humidity) ___________________________________________ 44
Figure 38: Configuration B2: Snapshot of Wall 2 measurements on March 8th, 08 at 21:00
(time of peak stud cavity humidity) ____________________________________ 45
Figure 39: Configuration B2: Snapshot of Wall 3 measurements on March 8th, 08 at 21:00
10
Figure 40: Configuration C2: Indoor climatic chamber air pressure difference, relative humidity and temperature, as well as room and outdoor temperature prevailing during test period. __________________________________________________ 46 Figure 42: Configuration C2: Average temperature profile for the full configuration time
period ___________________________________________________________ 48 Figure 43: Configuration C2: Wall 2 (XPS) humidity ratios _____________________ 48 Figure 44: Configuration C2: Wall 3 (Mineral Fibre) humidity ratios ______________ 49 Figure 45: Configuration C2: Average humidity ratio profile for the full configuration
time period _______________________________________________________ 49 Figure 46: Configuration D2: Indoor climatic chamber air pressure difference, relative
humidity and temperature, as well as room and outdoor temperature prevailing during test period. __________________________________________________ 50 Figure 47: Configuration D2: Wall 2 pressure measurements and wind data (similar
pressure measurements were recorded in Wall 3) _________________________ 51 Figure 48: Configuration D2: humidity ratios at each layer of Wall 2 (with XPS
insulating sheathing) ________________________________________________ 52 Figure 49: Configuration D2: humidity ratios at each layer of Wall 3 (with mineral fibre
insulating sheathing) ________________________________________________ 52 Figure 50: Configuration D2: Average temperature gradient profile for the full
configuration time period ____________________________________________ 53 Figure 51: Configuration D2: Average humidity ratio gradient for the full configuration
time period _______________________________________________________ 53 Figure 52: Configuration D2: Relative humidity at the exterior surface of the sheathing
board ____________________________________________________________ 54 Figure 53: Configuration D2: Difference in humidity ratio across the retrofit insulation 55 Figure 54: Configuration E2: Indoor climatic chamber air pressure difference, relative
humidity and temperature, as well as room and outdoor temperature prevailing during test period. __________________________________________________ 56 Figure 55: Configuration E2: Wall 2 pressure measurements and wind direction and
speed data (similar pressure measurements were seen in Wall 3) _____________ 56 Figure 56: Configuration E2: Wall 3 (with mineral fibre) Liquid detection recorded at
two locations on the interior face of the wood-based sheathing, using liquid
detection tape strips_________________________________________________ 58 Figure 57: Configuration E2: Wall 2 (XPS) Liquid detection recorded at three locations
on the interior face of the wood-based sheathing, using liquid detection tape strips 58 Figure 58: Configuration E2: Snapshot of Wall 2 cross-section __________________ 59 Figure 59: Configuration E2: Snapshot of Wall 3 cross-section (one time period when
11
Figure 60: Location of liquid detection tape in the stud cavity (in green frame) ______ 60 Figure 61: Configuration E2: Wall 3 (Mineral Fibre) Liquid detection recorded in the
stud cavity, using strips of liquid detection tape ___________________________ 60 Figure 62: Configuration E2: Snapshot of Wall 3 cross-section (Exfiltration prevailed
when the wood-based sheathing surface was below dew point temperature of indoor air) ______________________________________________________________ 61 Figure 63: Location of strips of liquid detection tape on the exterior face of the mineral
fibre insulation (Wall 3) _____________________________________________ 61 Figure 64: Configuration E2: Wall 3 (Mineral Fibre) Liquid detection recorded on the
exterior face of the mineral fibre, near the top of the test specimen (in red) _____ 62 Figure 65: Wall 3 measurements of relative humidity, in exterior air and at the interface
between the mineral fibre insulation and the exterior sheathing membrane _____ 62 Figure 66: Configuration E2: Snapshot of Wall 3 top cross-section (one time period when
moisture was detected on the exterior surface of the mineral fibre insulation) ___ 63 Figure 67: Configuration E2: Snapshot of Wall 2 top cross-section _______________ 63 Figure 68: Configuration E2: Average temperature profile for the full configuration time
period ___________________________________________________________ 64 Figure 69: Configuration E2: Average humidity ratio profile for the full configuration
time period _______________________________________________________ 65 Figure 70: Configuration E2: Humidity ratio profile for 8:00 29-Mar-08 (one time when
moisture was detected on the surface of the OSB for both walls W2 & W3) ____ 65 Figure 71: Configuration E2: Relative humidity at the exterior surface of the sheathing
board ____________________________________________________________ 66 Figure 72: Configuration E2: Difference in humidity ratio across the retrofit insulation
during Condition E2 ________________________________________________ 66 Figure 73: Configuration F2: Indoor climatic chamber air pressure difference, relative
humidity and temperature, as well as room and outdoor temperature prevailing during test period. __________________________________________________ 67 Figure 75: Configuration F2: Average temperature profile for the full configuration time period, and dew point temperatures ____________________________________ 68 Figure 76: Configuration F2: Snapshot of Wall 2 cross-section (during a period of air
exfiltration) _______________________________________________________ 69 Figure 77: Configuration F2: Snapshot of Wall 3 cross-section (during a period of air
exfiltration) _______________________________________________________ 69 Figure 78: Configuration F2: Average humidity ratio profile for the full configuration
time period _______________________________________________________ 70 Figure 81: Configuration F2: Wall 2 (XPS) humidity ratios _____________________ 73 Figure 82: Configuration F2: Wall 3 (Mineral Fibre) humidity ratios ______________ 73
12
Figure 83: Phase 3: Indoor climatic chamber air pressure difference, relative humidity and temperature, as well as room and outdoor temperature prevailing during test period. ___________________________________________________________ 74 Figure 84: Phase 3: Wall 2 (XPS) temperatures _______________________________ 75 Figure 85: Phase 3: Wall 3 (Mineral Fibre) temperatures _______________________ 75 Figure 86: Phase 3: Wall 2 (XPS) humidity ratios _____________________________ 76 Figure 87: Phase 3: Wall 3 (Mineral Fibre) humidity ratios ______________________ 76 Figure 88: Phase 3: Snapshot of W1 cross-section (similar indoor and outdoor
temperatures, high outdoor humidity)___________________________________ 77 Figure 89: Phase 3: Snapshot of W2 cross-section (similar indoor and outdoor
temperatures, high outdoor humidity)___________________________________ 77 Figure 90: Phase 3: Snapshot of Wall 3 cross-section (similar indoor and outdoor
temperatures, high outdoor humidity)___________________________________ 78 Figure 91: Phase 3: Wall 2 (XPS) Liquid detection tape on the exterior face of the XPS 79 Figure 92: Phase 3: Relative humidity at the exterior surface of the sheathing board __ 80 Figure 93: Phase 3: Difference in Humidity Ratio across the retrofit insulation ______ 80 Figure 94: A-B: Water stains on the bottom plate of the stud cavity of W2 test specimen
A) Before the experiment, 16-Oct-07 and B) After the experiment, 4-Jul-08 ____ 81 Figure 95: A-B: Water stains on the bottom plate of the stud cavity of W3 test specimen
A) Before the experiment, 16-Oct-07 and B) After the experiment, 4-Jul-08 ____ 81 Figure 96: Bottom plate and base of wood-based sheathing board of W1 test specimen
was found without any sign of moisture damage __________________________ 82 Figure 97 - Relative Humidity at the exterior surface of the sheathing board during the
full experiment ____________________________________________________ 87 Figure 98 - Difference in Humidity Ratio across the retrofit insulation _____________ 87
Figure A-1: A- RHT Connection, B- Wireless RH&T and RH&T, C- Wires ________ 92 Figure A-2: A- Simple Rain Gauge, B-C-Completed rain Gauge _________________ 93 Figure A-3: A- Moisture pins fabrication, B-Moisture pins being mounted on a wall _ 94 Figure A-4: A- Pressure transducer boxes panel (Front), B-D: Copper pipes, E: Pressure
transducer boxes (rear) ______________________________________________ 95 Figure A-5: A-Thermocouple Alpha Node in junction box, B&D Thermocouples
preparation, C- Thermocouple connects to the junction box, E-Connector ______ 96 Figure A-6: A-DETECT moisture detection tape on mineral Fibre insulation, B-
DETECT moisture detection tape installed in a stud cavity (moisture pins are placed near by on the bottom plate ___________________________________________ 97
13
Figure A-7: A &D-Three HFT are lined up into W2 stud cavity that will be filled with glass fibre insulation B-: HFT, C- Final connection Protection, E- Connection Wires _________________________________________________________________ 98 Figure A-8: Wall #3, Layer 1, vinyl siding (Measurement units on the diagram are in
inches) ___________________________________________________________ 99 Figure A-9: Wall #3, Layer 2, exterior face of the sheathing membrane (Measurement
units on the diagram are in inches) ____________________________________ 100 Figure A-10: Wall #2, Layer 1, vinyl siding (Measurement units on the diagram are in
inches) __________________________________________________________ 102 Figure A-11: Exterior face of insulation (Measurement units on the diagram are in
inches) __________________________________________________________ 103 Figure A-12: A- RH&T, B-Thermocouple, DETECT tape and RH&T, C-RH&T sensor
________________________________________________________________ 103 Figure A-13: location of sensors on that layer (Measurement units on the diagram are in
inches) __________________________________________________________ 104 Figure A-14: Exterior face of wood-based sheathing board and layout of sensors on its
exterior surface (Measurement units on the diagram are in inches) ___________ 105 Figure A-15: Wall 3, Exterior face of vinyl siding (Measurement units on the diagram are
in inches) ________________________________________________________ 106 Figure A-16: Exterior face of sheathing membrane No. 2 (The wireless sensor not shown on the photograph (Measurement units on the diagram are in inches) _________ 107 Figure A-17: Exterior face of semi-rigid mineral fibre insulation (Measurement units on
the diagram are in inches) ___________________________________________ 108 Figure A-18: A-RH&T sensor, B-DETEC tape, C- Pressure tap for exterior pressure
measurement _____________________________________________________ 108 Figure A-19: Exterior face of sheathing membrane. (Measurement units on the diagram
are in inches) _____________________________________________________ 109 Figure A-20: Instrumentation on the exterior face of wood-based sheathing board
(Measurement units on the diagram are in inches) ________________________ 110 Figure A-21: Layout of instrumentation on Wall 2, layer 4, interior face of OSB
(Measurement units on the diagram are in inches) ________________________ 111 Figure A-22: A-Moisture Pin Sensor, B- Heat Flux Transducers C- RH&T and wireless
RHT Sensor (in white pouch), _______________________________________ 111 Figure A-23: A-Orientation of the moisture detection strips and moisture pins in the stud
cavity, B-Moisture Pins #2 & #3 and moisture detection strips (W-2) (Measurement units on the diagram are in inches) ____________________________________ 112 Figure A-24: Wall 2, layer 6, interior face of insulation & stud cavity (Measurement units
14
Figure A-25: A-RH&T and Pressure Sensors, B-RH&T and wireless sensors (in white pouch) __________________________________________________________ 113 Figure A-26: Wall 2, layer 7, interior face of drywall. (T_19 for W1 is located on the
exterior side of Wall #2 (as T_20)) ____________________________________ 114 Figure A-27: Wall 1 cross-section with instrumentation in plan view. ____________ 115 Figure A-28: Wall 2 cross-section with instrumentation in plan view. ____________ 115 Figure A-29: Cross-section of the wall specimens showing the location of
instrumentation ___________________________________________________ 115 Figure B-1: Wall Periphery details ________________________________________ 117 Figure B-2: Junction detail between W1 and separation section _________________ 118 Figure B-3: Junction detail between W2 specimen and separation section _________ 118 Figure B-4: Junction detail between separation section and regular wall of the research
15
1 OBJECTIVE
The objectives of the study are:
1) To demonstrate that the properties of the thermal insulation installed on the exterior of the wood-frame wall cavity will affect the temperature, vapour and air pressure gradients, and will consequently affect the wetting and drying potential of the assembly
2) To demonstrate that air leakage through an assembly is a potent factor in transporting moisture to and from enclosed cavities
3) To demonstrate that increases in indoor relative humidity levels can result in higher potential for wetting of stud wall cavity elements
4) To test the hypothesis that walls with exterior insulation are less prone to interstitial condensation than similar walls without such exterior thermal lining.
2 BACKGROUND
In 2006 NRC-IRC proceeded to conduct a major upgrade of research test hut No. 3 located on NRC campus on Montreal road in Ottawa Ontario, aiming to investigate building envelope performance and durability as well as indoor environment characteristics and performance in a context of naturally occurring weathering processes. Adding this field monitoring element to existing NRC-IRC laboratory and field facilities, and modelling tools was considered an asset for conducting research on the building
envelope (Figure 1). The new Ventilation and Walls Research house1 is now equipped
with a wall test rig (The Field Exposure of Walls Facility –FEWF) on the west façade
which allows the exposure of multiple wall test specimens to naturally occurring exterior weather conditions on the outside, and controlled environmental exposure on the interior side (Figure 2 and Figure 14). A sophisticated system of instrumentation and data acquisition allows researchers to capture data on the hygrothermal response of each critical layer and multiple locations within the test specimens on a continuous basis. Several projects were initiated at the research test hut in Fall 2006. Researchers in the Building Envelope and Structure Program designed an experiment to compare the hygrothermal response of three essentially identical wall test specimens with the primary goal of assessing whether the positioning of the test specimens within the test rig would make a difference in their hygrothermal response of the test specimens, having plans in coming years to compare different types of wall construction in a fair manner irrespective of the relative positioning within the test rig. Results showed that the test specimens were not significantly affected by their positioning within the test frame. Building on the first year experiment, and in the context of the importance of reducing the carbon footprint of buildings through better energy efficiency, the team then moved on to design a study about moisture-related durability issues regarding energy retrofitted exterior walls. The second year study aims at comparing the wetting and drying response of wood-frame exterior walls that have been energy retrofitted on the exterior in different ways.
1
16
3 INTRODUCTION
In 2007 NRC-IRC initiated the project “Evaluating the effects of two strategies of energy
retrofit for housing on the wetting and drying potential of the wall assemblies-2007-08”.
NRCan (Housing and Buildings /Sustainable Building and Communities CANMET / Group) and CMHC (Sustainable Housing Policy and Research Group) were partners in the project and provided some funding.
As energy costs and demands for environmental sustainability increase, the building industry is seeking effective and durable strategies for improving the energy performance of the building envelope. For existing construction, options for building envelope improvement are limited based on cost effectiveness, more so than in new construction. Adding thermal insulation on the exterior of the existing shell of the building is a viable retrofit option with a few advantages including: minimal disruption to the occupants and their living spaces; and the ability to minimize costs, particularly if the energy retrofit measures are coordinated with other façade rehabilitation work. Adding thermal insulation on the exterior of the existing shell can increase the overall R-value and the airtightness of the wall assembly, as well as reduce thermal bridging due to structural elements. This results in higher energy efficiency and thermal comfort, and lower operation costs.
A variety of thermal insulation materials can be used on the exterior of existing shells, and their hygrothermal properties vary: some exhibit low vapour and air permeance, while others have higher air and vapour permeance. However, the effect of the heat, air and vapour flow control properties of the selected thermal insulation on the moisture accumulation into the wood-frame cavity due to wintertime condensation can be of concern. These properties can affect the ability of the wall assemblies to get wet by condensation (in wintertime) and to dry out (in spring and summertime), hence having the potential to affect negatively the durability of the assembly. Research to compare the hygrothermal response of such energy retrofitted wall assemblies can yield valuable information about critical elements of wall assembly design for satisfactory performance and service life.
4 OBJECTIVE
The objective of the study is based on the hypotheses that 1) the properties of the thermal insulation installed on the exterior of the wood-frame wall cavity will affect the
temperature, vapour and air pressure gradients, and will consequently affect the wetting and drying potential of the assembly 2) air leakage through an assembly is a potent factor in transporting moisture to and from enclosed cavities 3) increases in indoor relative humidity levels can result in higher potential for wetting of stud wall cavity elements 4) walls with exterior insulation are less prone to interstitial condensation than similar walls without such exterior thermal lining.
17
MODELING IRC HAM tools: hygIRC 1D &2D,
Weather Smart hygIRC-C
LABORATORY
Dynamic Wall Test Facility and Envelope (DWTF) Environmental Exposure Envelope Facility (EEEF)
Guarded Hot Box
FIELD IRC Research Houses
and Canadian Centre for Housing Technologies CCHT Issues: -Moisture accumulation -Condensation potential -Mould growth -Energy efficiency -Thermal comfort and temperature distribution -Mass transport (air &particulates) -Rain penetration
Figure 1: Schematic diagram showing the three main components of research on building envelope performance 4.88m 1.73m Test frame designed to provide the largest possible free bay for placement of several test specimens
Figure 2: Location of the Test Bay on the West Façade of the NRC-IRC Ventilation and Walls Research house
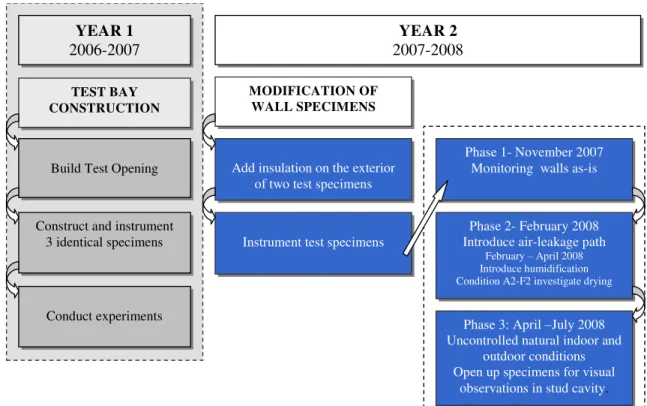
18 YEAR 1
2006-2007
YEAR 2
2007-2008
Build Test Opening
Construct and instrument 3 identical specimens
Phase 1- November 2007 Monitoring walls as-is
Phase 2- February 2008 Introduce air-leakage path
February – April 2008 Introduce humidification Condition A2-F2 investigate drying
Phase 3: April –July 2008
Uncontrolled natural indoor and outdoor conditions Open up specimens for visual
observations in stud cavity.
TEST BAY CONSTRUCTION
MODIFICATION OF WALL SPECIMENS
Add insulation on the exterior of two test specimens
Instrument test specimens
Conduct experiments
Figure 3: Schematic diagram of the different tasks in the project
5 METHODOLOGY
5.1 General Approach
During the winter of 2007-2008, NRC-IRC researchers investigated the effects of exterior energy retrofit strategies on moisture accumulation, and temperature and air pressure distribution in typical housing construction (38 X 140 mm wood studs with glass fibre batt insulation and poly air/vapour barrier for air, heat and moisture control). The study was designed to compare the heat, air and moisture response of two exterior insulated retrofitted wood-frame walls with different air and vapour permeance properties, when subjected to air leakage under naturally occurring outdoor conditions, and controlled indoor conditions. A test protocol was developed to challenge two wall assemblies with steps of increased indoor relative humidity and air exfiltration levels. A traditional R20 2X6 wall assembly acted as reference. Details of the wall construction can be found in Figure 4 and Table 1.
To gather data to verify the research hypotheses, three wall assemblies (W1, W2 & W3) of different composition were placed side-by-side in the test bay of the FEWF.
W1 – Reference Wall: Test specimen W1 consisted of a conventional glass fibre batt
insulated stud cavity 38 X 140 mm (2X6) wood frame construction with no exterior thermal insulation retrofit, and served as the reference.
19
W2 and W3 test specimens: The retrofitted wall specimens comprised the same stud cavity construction as W1 but also included a layer of rigid or semi-rigid thermal insulation on the exterior of the wood-based sheathing and sheathing membrane. W2 included an external layer of 50 mm XPS foam board (low air and vapour permeance), while W3 included an external layer of 62,5 mm semi-rigid mineral fibre insulation (higher air and vapour permeance). Other small variations between specimens are described in section 5.2.
The test walls were instrumented during construction to collect data on the temperature (T), relative humidity (RH), air pressure (P) at most layers in the assemblies, as well as water deposition on surfaces and moisture content of wood-based materials in critical layers. The 3 wall test specimens were installed side-by-side in the test bay of NRC-IRC Field Exposure of Walls facility. The walls were monitored from Fall 2007 until Summer 2008. Two of the three test specimens were subjected to challenging indoor conditions of moisture and air pressure from February to April 2008, while an air leakage path was in place, in order to investigate the effect of the exfiltration/infiltration on the wintertime wetting and Spring drying potential of these assemblies.
W1 test specimen was exposed to naturally occurring weather conditions outdoors and the uncontrolled indoor conditions of the adjacent room (about 20% RH- dry wintertime level). No deficiency in the air/vapour barrier polyethylene membrane was introduced in W1 during the test period.
The W2 and W3 test specimens were subjected to naturally occurring weather conditions outside, and to a variety of indoor relative humidity (30-50%) and air pressure inside (up to 10 Pa) as introduced in an indoor climatic chamber built for that purpose to control The temperature, Relative Humidity and Pressure. In wintertime, from February to April 2008, indoor relative humidity levels in the indoor climatic chamber were controlled to represent low, average and high indoor RH conditions, while remaining within the range of nominal conditions. Indoor air pressure levels resulted in a low level of pressurization under calm wind conditions. The two energy retrofitted test specimens were subjected to air leakage (infiltration or exfiltration depending on wind pressure) when a path for airflow was introduced at the poly air/vapour barrier and drywall indoors, and at the wood-based sheathing board (a 6 mm gap at mid-height of the test specimen, simulating an open joint between two boards installed horizontally was in place). The interior conditions protocol is described in Table 2.
5.2 Description of Test Specimens
In previous study in fall 2006 and winter 2007 for the first year study, three essentially identical test wall assemblies (W1, W2 & W3) each measuring 1727 mm x 1219 mm (5 ft 8in x 4 ft) were built and tested side-by-side in the FEWF (Figure 4). These wall assemblies were conventional glass fiber batt insulated 2X6 stud cavity wood-frame construction. The polyethylene plastic membrane behind the interior finish was intended to act as the air/vapour barrier.
20
For the second year of operation and the project described herein, the exterior layers of two of the three original test specimens (W2 and W3) were modified: thermal insulation was added on the exterior to replicate an exterior energy retrofit. The W1 specimen was used as the reference wall, and was not altered.
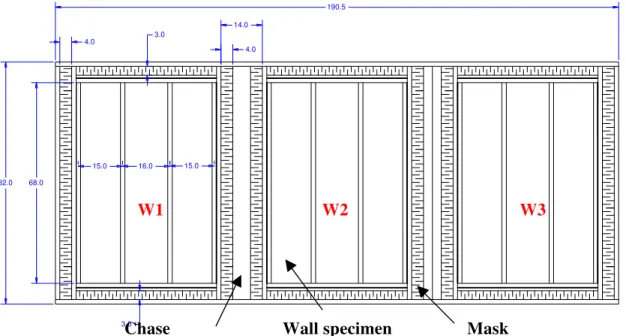
W2 included one layer of a low vapour and air permeance insulation layer, a rigid extruded polystyrene (XPS) board 50 mm (2 in) thick (RSI 1,76 or R10), installed on the exterior of the existing wood-based board and sheathing membrane. Three pieces of XPS boards were installed horizontally and the joints (square edges) were not sealed. W3 test specimen included three pieces of a higher air and vapour permeance insulation, a semi-rigid mineral fibre insulation totalling 63.5 mm (2 ½ in) in thickness (RSI 1,76 or R10), placed on the exterior of the existing wood-based sheathing and sheathing membrane. To provide adequate support for the attachment of the vinyl lap siding the construction of W2 and W3 differed. For W2, the siding was attached to the wood studs directly through the 50 mm XPS rigid insulation; no sheathing membrane was placed on the exterior of the XPS foam board. For W3, a sheathing membrane was placed over the semi-rigid mineral fibre insulation. Due to the flexibility and thickness of the mineral fibre insulation, furring strips were installed to facilitate the fastening of the vinyl siding. Vertical furring strips were installed vis-à-vis the wood studs, with the first 38 mm (1½ in) thick layer of the insulation placed between the stud and furring strip in order to reduce thermal bridging. Figure 5, Figure 6 and Figure 7, as well as Table 1 describe the layout and composition of the test specimens.
21 82.0 190.5 4.0 3.0 68.0 16.0 15.0 15.0 3.0 4.0 14.0 W1 W2 W3
Chase Wall specimen Mask
Figure 5: Elevation view from indoors of the 3 test specimens and the separating chases All dimensions are in inches.
Exterior
Interior
W1
W2
W3
22
Interior Exterior
Detail B (Fig.B-3)
Detail A (Fig B-2) Detail C (Fig.B-4)
Wall 1 Wall 2 Wall 3
Figure 7: Horizontal cross section of the three wall specimens (see periphery details in A) Table 1: Composition of test specimens
W1
38mm X 140mm insulated wood-frame with no exterior insulating sheathing
W2
Lower Air & Vapour Permeance Insulating Sheathing
W3
Higher Air & Vapour Permeance Insulating Sheathing
Vinyl siding
Sheathing membrane (spun-bonded olefin) 11 mm OSB wood-sheathing (with a 6 mm horizontal gap at mid-height) 38 mmx140 mm (2X6) nominal stud cavity with RSI3,5 (R20) glass fiber insulation batts
Plastic air/vapour barrier Painted drywall
Vinyl siding
50 mm (2 in.) XPS rigid foam insulation, 609 mm (24 in.) wide sections installed horizontally, square edge
Sheathing membrane (spun bonded olefin) 11 mm OSB wood-sheathing (with a 6 mm horizontal gap at mid-height) 38 mmx140 mm (2X6) nominal stud cavity with RSI3,5 (R20) glass fiber insulation batts
Plastic air/vapour barrier Painted drywall
Vinyl siding
Sheathing membrane (spun-bonded olefin) 19 mm x 38 mm (¾ x 1½ in.) vertical strapping @ 400 mm (15¾ in.) o.c. mounted on blocks
63.5 mm (2½in) semi-rigid mineral fibre insulation boards installed horizontally Sheathing membrane (spun-bonded olefin) 11 mm OSB wood-sheathing (with a 6 mm horizontal gap at mid-height) 38 mmx140 mm (2X6) nominal stud cavity with RSI3,5 glass fiber insulation batts
Plastic air/vapour barrier Painted drywall
23
The siding from the original W2 and W3 test specimens were removed and the necessary changes to accommodate 50 to 63.5 mm of additional thermal insulation on the exterior of the existing sheathing membrane were made. As construction and retrofit work took place, the instrumentation was laid at their specified locations layer by layer. Figure 8 through Figure 12 show the critical steps of constructing the test specimens.
A B
Figure 8: Test specimen construction – Stud cavity and air/vapour barrier
A- Each test specimen features three stud cavities. The middle stud cavity was the primary focus of instrumentation and monitoring. The space between the specimens was used as a chase for
instrumentation wiring. The chases were insulated and made airtight to minimize the lateral flow of heat and air. A 6 mm gap in the wood-based sheathing was intentionally made at mid-height in the middle stud cavity.
B- The RSI 3.5 (R20) glass fiber insulation was placed in the stud cavities. A polyethylene air/vapour barrier was then installed on the interior. The air/vapour barrier was sealed at the perimeter using a self-adhered membrane and acoustical caulking. (Photos taken in Summer 2006).
A B
Figure 9: Test specimen construction – Perimeter seal and drywall
A-Detail of the self-adhered flashing membrane, sealing the perimeter of the test specimen
B-Drywall with opening at the bottom of each middle stud cavity, in preparation for the introduction of a gap in the poly of W2 and W3. The drywall was later painted. (Photos taken in 2006)
24 B A B W3 W2 W1
Figure 10: Test specimen construction – Exterior sheathing membrane
A-The sheathing membrane was installed on the three wall specimens and taped in place. A metal flashing was installed on the top and the bottom of the test bay to divert any water that could be draining down from above, away from the test specimens.
B- J-trim was installed around the perimeter of each specimen to permit vinyl siding installation. Horizontal vinyl siding was installed to complete W1. (Photos taken in 2006).
A B C
Figure 11: Test specimen construction – Exterior insulation
A and B-W3 test specimen: semi-rigid mineral fibre insulation (63.5 mm) was installed horizontally. Vertical furring strips (19mm x 38mm) were mounted on wood blocks (to reduce thermal bridging). Another layer of sheathing membrane was installed over the insulation;
C- W2 specimen: XPS rigid foam insulation with square edge (50mm) was installed horizontally. The joints were not sealed. No sheathing membrane was installed over the exterior face of the XPS insulation (Photos taken in Fall 2007).
25
A B
Figure 12: Test specimen construction - Cladding A- Vinyl siding was installed on and between specimens.
B- A bead of sealant was applied at the interfaces between segments. (Photos taken in Fall 2007)
5.3 Testing Protocol
One of the objectives of the study was to study the effect of changes in indoor RH and P levels on the wetting and drying of two energy retrofitted wall assemblies. The following interior test protocol was design to meet the objective. The experimental work was divided into 3 phases (Table 2):
In Phase 1 the three test specimens were exposed to uncontrolled - occurring conditions and did not include an air leakage path. This phase spanned the Fall 2007 and the start of Winter 2008.
In Phase 2 an air leakage path was introduced in W2 and W3. During a short period, uncontrolled indoor conditions prevailed. The indoor climatic chamber was then installed against the W2 and W3 test specimens, allowing researchers to induce and control indoor side RH and P levels independently from the rest of the research house (the indoor RH in the research house was low, ~20% that winter). The W2 and W3 specimens were then subjected to a series of 6 consecutive relative humidity and pressure.. This phase took place in February, March, and April 2008.
In Phase 3 the test specimens were subjected to uncontrolled natural indoor and
outdoor conditions again. This Phase started on April 30th and ended in July 2008,
when the test specimens were opened up to perform a visual examination of the bottom of the middle stud cavity.
Table 2: Description of the 3 phases of the test protocol
Air leakage openings, RH and pressure conditions described in the table apply to W2 and W3 only. W1 was exposed to uncontrolled interior conditions throughout all phases.
26
Phase Date Start Date Finish
Opening in Air Barrier (mm) Indoor RH (%) ∆P (Pa) (Indoor climatic chamber pressure – Indoor pressure) 1 November 2007 11-Jan-2008 0 Uncontrolled 0
2 11-Feb-2008 24-Feb-08 3 x 320 Uncontrolled
A2 24-Feb-08 00 :00 29-Feb-08 16 :00 3 x 320 30% 0 B2 29-Feb-08 16:00 18-Mar-08 12:00 3 x 320 50% 0 C2 18-Mar-08 12 :00 21-Mar-08 11 :30 3 x 320 30% 5 D2 21-Mar-08 11 :30 27-Mar-08 11 :30 3 x 320 50% 5 E2 27-Mar-08 11 :30 09-Apr-08 14 :30 3 x 320 50% 10 F2 09-Apr-08 14: 30 30-Apr-08 00 :00 3 x 320 50% 0
3 30-Apr-08 03-July-08 3 x 320 Uncontrolled 0
5.3.1 Phase 1
During this phase, the test specimens were left to acclimatize to naturally occurring environmental conditions. As the wall specimens did not include deficiencies into the air/vapour barrier, very little change in the moisture response within the wall specimens was expected.
5.3.2 Phase 2
The objective of Phase 2 was to challenge W2 and W3 test walls in several ways in order to increase the wintertime condensation potential in the wall cavities and layers of the assemblies, and to characterize the effects on the surface wetting and the moisture content of wood-based materials within the wall assemblies. Conditions for mild air exfiltration of indoor humid air through the test specimens W2 and W3 were induced. An opening was made into the interior poly air/vapour barrier and the drywall to create an air leakage path (there was also a similar opening into the wood-based exterior sheathing) (Figure 13). An indoor climatic chamber was constructed and installed against W2 and W3, which allowed for the control of indoor relative humidity and air pressure (Figure 14). W2 and W3 were subjected to conditions described in Table 2 while W1 remained unchanged, i.e. without opening in the air/vapour barrier, and was not exposed to challenging indoor conditions of relative humidity and pressure, as the existing indoor climatic chamber did not enclose it. In the wintertime, the relative humidity in the research house was uncontrolled and average approximately 20% RH.
27
320 mm
A B
Figure 13: Air leakage path
A - Horizontal opening in the polyethylene membrane of 320 x 3 mm. B- A 6 mm horizontal opening in the wood-based sheathing representing an open horizontal joint between panels
A B
Figure 14: Leakage path and indoor climatic chamber
A - Schematic showing an indoor view of the three test specimens. The figures show the air leakage path created via gaps in the air/vapour barrier and in the wood-sheathing board, in the middle test specimen
B- Indoor climatic chamber subjecting W2 and W3 test specimens to controlled temperature, relative humidity and air pressure. W1 did not have an opening in the air/vapour barrier, and was not connected to the indoor climatic chamber.
5.3.3 Phase 3
After Phase 2 was complete, the specimens were subjected to uncontrolled naturally occurring conditions indoors and outdoors, from the end of April until July 2008. The indoor and outdoor climates were expected to promote the drying of the specimens. In July the test specimens were opened up to observe the condition of the bottom of the stud cavity.
28
5.4 Instrumentation
Instrumentation was selected for the purpose of comparing the hygrothermal response of side-by-side wall test specimens, when exposed to environmental conditions conducive to interstitial condensation by air exfiltration. Instrumentation allowed the detection of conditions of wetting and drying remotely, without requiring deconstruction for visual observation. All three specimens were instrumented similarly, with additional instrumentation for W2 and W3, which included additional layers of building materials. Sensors used in each critical layer of the assemblies were as follows:
Thermocouples to measure air and surface temperature (Figure 15A) Relative humidity and temperature sensors (Figure 15B).
Pressure tubes to measure air pressure difference between two environments (Figure 15C). In this study the indoor room adjacent to the test specimen was set up as the reference.
Electrical resistance moisture pins to determine the moisture content at a given depth into a wood-based material (Figure 15D).
Liquid water detection and moisture content tape. This commercially available tape provides dual information. One series of electrical resistance wires are surface-mounted on the substrate and provide information on the wetting of the tape. Another series of wires are coupled with metal staples pinned into a substrate of interest and these provide information on the moisture content of the substrate (when applicable) (Figure 15E). The moisture content part of the tape was used for the wood-based materials, but not for sheathing membrane or insulation materials.
Heat flux transducers (HFT) are induced by a temperature gradient across the
sensor. The temperature difference is measured by a thermopile . This allows the calculation of the thermal conductance of the material, in this case the glass fibre insulation placed between studs of W2 (Figure 15F).
A rain gauge installed on the face of the exterior siding to determine the volume of rainwater incident on the vertical surface at that location (Figure 15G).
Figure 16 shows an example of the layout of the instrumentation on the exterior face of the wood-based sheathing board of the specimens. A complete description of the instrumentation for each layer of material of the test specimens is given in Appendix A. e
29
A B C
D E F
G
Figure 15: Photos of instrumentation
A- Thermocouple, B-RH&T and Wireless RH&T sensor, C- Copper pipe to be connected to pressure transducers, D- Moisture pins, E-Liquid and moisture content detection tape,
F- Heat flux transducers, G-Rain gauge
2.0 6.0 DETEC_4 DETEC_5 DETEC_7 DETEC_8 RHT_4 17.0 RHT_5 T_3 T_6 15.0 T_2 T_5
Figure 16: Example of the diagram showing the layout of the instrumentation at the exterior surface of wood-based sheathing, along with the photograph of the wall specimen
30
6 RESULTS AND DISCUSSION
The results of the field monitoring and the exposure of the test specimens are presented below in sequential order of the implementation of the test protocol (Table 2).
6.1 Phase 1: Uncontrolled indoor Relative Humidity and
Pressure without a deficiency in the Air Barrier System
(ABS) of the test specimens
The conditions of this pre-test period (Phase 1) are shown in Figure 17. The indoor temperature was held relatively constant, around 20°C, while indoor RH dropped to ~20% as cold dry outdoor conditions were prevalent from December onwards.
During Phase 1, there was no air leakage deficiency introduced in any of the three test assemblies, i.e., the interior air barrier remained intact. There was little moisture in the interior air and no pathway to promote air exfiltration into the assembly. Under these conditions, the wall assemblies remained dry throughout Phase 1, with no evidence of condensation or interstitial wetting. Figure 18 features a single week in December, for the liquid detection strips on the interior face of the sheathing board of Wall 2. A sample graph of liquid detection tape resistance readings during this phase is shown in Figure 19. Results were the same for all three walls at all measured locations throughout Phase 1. The resistance readings remained above the 100000-kOhm threshold required to indicate the presence of liquid.
31
Figure 17: Indoor relative humidity and temperature, as well as outdoor temperature prevailing during Phase 1.
Figure 18: Location of the liquid detection tape on the interior surface of the sheathing board. The colour coding for each strip of detection tape will be used in the graphs showing some wetting
Interior and Exterior Conditions
-30 -20 -10 0 10 20 30 40 50 60 21-O ct-07 28-O ct-07 4-N ov -07 11-N ov -07 18-N ov -07 25-N ov -07 2-D ec -07 9-D ec -07 16-D ec -07 23-D ec -07 30-D ec -07 6-J
an-0813-Jan-0820-Jan-0827-Jan-083-Feb-0810-Feb-0817-Feb-0824-Feb-08
Date and Time
R H ( %), T em p er a tu re ( °C ) Outdoor T Room RH Room T Pre Testing
32
Figure 19: Phase 1 - Sample readings from liquid detection tape on the interior face of the wood-based sheathing
FEWF Wall 2 - Interior of OSB - Layer 4 - Liquid
0 20000 40000 60000 80000 100000 120000 12/22/07 0:00 12/23/07 0:00 12/24/07 0:00 12/25/07 0:00 12/26/07 0:00 12/27/07 0:00 12/28/07 0:00 12/29/07 0:00 12/30/07 0:00 12/31/07 0:00
Date and Time
R e s is ta n c e ( k ) 209L 210L 211L 212L 213L 214L
33
6.2 Phase 2: Controlled Indoor Relative Humidity and
Pressure with a deficiency in the ABS of the W2 and W3
test specimens
Figure 20 summarizes the conditions prevailing in the indoor climatic chamber during this Phase of the testing program. Hourly mean outdoor temperature is also plotted in Figure 20 to give an indication of the prevailing outdoor climate during the test program. During the six steps of Phase 2 testing, the W1 test specimen was not subjected to any
intentional deficiency in the ABS – the polyethylene membrane behind the gypsum board
interior finish, or to any challenging indoor levels of RH and P. The W2 and W3 test specimens were intentionally altered by means of an opening measuring 3 mm by 320 mm in the bottom part of the polyethylene membrane and a larger opening in the gypsum interior finish vis-à-vis this gap in the polyethylene.
Throughout Phase 2, the indoor climatic chamber provided the interior conditions for W2 and W3, while W1 was exposed to room conditions. The room and chamber temperature and relative humidity are compared in Figure 21 and Figure 22 respectively. Generally, during Phase 2 the room temperature was cooler than the controlled temperature of the chamber. The room air was also quite dry, ~20% RH, as the Research House was not humidified during the heating season.
Figure 20: The six steps of the Phase 2 test program with corresponding indoor chamber RH and P (above indoors) and outdoor temperature
Chamber Pressure, RH and Outdoor T
-30 -20 -10 0 10 20 30 40 50 60 70 24 -Feb -08 2-M
ar-08 9-Mar-08 16-M
ar-08 23 -M ar-08 30 -M ar-08 6-A pr-08 13-A pr-08 20 -A pr-08 27 -A pr-08
Date and Time
R H ( % ), C h a m b e r P re s s u re ( P a ), O u td o o r T e m p e ra tu re ( °C ) RH P Outdoor T A2 B2 C2 D2 E2 F2
34
Figure 21: The six steps of the Phase 2 test program with corresponding indoor room and chamber temperature
Figure 22: The six steps of the Phase 2 test program with corresponding indoor room and chamber relative humidity
Room and Chamber Temperature
0 5 10 15 20 25 30 35 2 4 -F e b -0 8 2 -M a r-0 8 9 -M a r-0 8 1 6 -M a r-0 8 2 3 -M a r-0 8 3 0 -M a r-0 8 6 -A p r-0 8 1 3 -A p r-0 8 2 0 -A p r-0 8 2 7 -A p r-0 8 Te mpe ra ture , °C Room T Chamber T A2 B2 C2 D2 E2 F2
Room and Chamber Humidity
0 10 20 30 40 50 60 70 2 4 -F e b -0 8 2 -M a r-0 8 9 -M a r-0 8 1 6 -M a r-0 8 2 3 -M a r-0 8 3 0 -M a r-0 8 6 -A p r-0 8 1 3 -A p r-0 8 2 0 -A p r-0 8 2 7 -A p r-0 8 Re la ti v e Hum idi ty , % Room RH Chamber RH A2 B2 C2 D2 E2 F2
35
6.2.1 Configuration A2: Constant 30% relative humidity, no pressure applied, with a deficiency in the ABS
This configuration was selected to investigate the test specimen responses when exposed to an indoor RH level which can be considered average and when natural air infiltration/air exfiltration patterns take place. During this 5-day period, hourly mean
outdoor temperature fluctuated between 0ºC and –25ºC. The conditions in the indoor
climatic chamber were stable (Figure 23).
Figure 23: Configuration A2: Indoor climatic chamber air pressure difference, relative humidity and temperature, as well as room and outdoor temperature prevailing during test period.
Moisture Effects
Based on the moisture detection strips and the moisture pins readings, no condensation occurred in the test walls. The RH and T measurements taken at each interface of the test wall assemblies also supported this statement, as these measurements showed that the air at every interface was maintained at an RH level below saturation, even on the coldest
day of the whole test period recorded, Feb. 292008 (Figure 24, Figure 25 and Figure 26).
The absence of interstitial condensation in W2 and W3 can be explained by the observation that the test walls were almost always subjected to air infiltration (Figure 27). Even though there was a 3 mm by 320 mm opening through the air barrier system and drywall, and temperatures in the stud cavity dropped below the dew point of the indoor
Interior and Exterior Conditions
-30 -20 -10 0 10 20 30 40 50 60 70 24-F eb-08 0: 00 25-F eb-08 0: 00 26-F eb-08 0: 00 27-F eb-08 0: 00 28-F eb-08 0: 00 29-F eb-08 0: 00
Date and Time
R H ( %), C h am b er P re s s u re ( P a ), T e mpe ra tu re ( °C ) Chamber RH Chamber T Room T Chamber P Outdoor T Configuration A2
36
chamber air (Figure 28 and Figure 29), indoor moisture was not driven into the stud cavity for either W2 or W3 as shown in Figures 24, 25, 26, and Figure 30. The three test specimens showed similar response in terms of measured humidity ratios at the different layers within their assemblies (Figure 30). Considering that W1 did not have an air leakage opening and was not subjected to increased indoor RH, it could be inferred for W2 and W3 that there was very little air and moisture transfer taking place across these specimens as well.
Comparing the effect of the indoor RH on the dew point location within the test assemblies, Figure 28 and Figure 29 showed that at very low indoor RH (about 15%), in
mild winter conditions (-5ºC), the W2 and W3 test specimens maintained the wood-based
exterior sheathing above the dew point of room air, while W1 did not. At the higher chamber RH (30%), the exterior sheathing of W1, W2 and W3 were at or below dew
point. During the episode of extreme cold weather (-25ºC) (Figure 29), again W2 and W3
test specimens were at an advantage over W1 composition as their exterior wood-based sheathing was slightly above the dew point of room air. But as the chamber RH was increased to 30%, the dew point would be located within the glass fiber insulation in the stud cavity for W1, W2 and W3.
Temperature Effects
W2 and W3 test specimens exhibited similar temperature gradients across their assemblies, for average as well as extreme outdoor temperature exposure (Figure 28 and Figure 29). This is expected, as the RSI value of the two assemblies was very similar. W1, which did not include an exterior insulating sheathing, exhibited a different thermal profile and the single major temperature drop was across the glass fibre insulation in the stud cavity; the exterior sheathing was maintained at temperatures very close to outside temperatures at all times. In terms of dew point location, assuming an indoor RH of 30%, Figure 28 shows that on average for the 5 day period W2 and W3 dew point would be located at the inside face of the exterior wood-based sheathing.
As outdoor temperature became more extreme (Feb. 29th -Figure 29), the location of the
dew point of 30% RH indoor air in all three-test specimens was in the glass fibre insulation in the stud cavity. This indicates that in very cold weather the presence of the RSI 1.76 exterior insulating sheathing on the exterior of the RSI 3.5 stud cavity did not have much effect on the location of the dew point, compared to the test specimen W1 which had no exterior insulating sheathing. In the three test specimens, the wood-based sheathing could be susceptible to condensation formation when other required conditions are present (e.g. moisture entering the cavity). In the A2 test conditions, indoor moisture did not enter the stud cavity, and no condensation resulted, even though the cavity