Publisher’s version / Version de l'éditeur:
Vous avez des questions? Nous pouvons vous aider. Pour communiquer directement avec un auteur, consultez la première page de la revue dans laquelle son article a été publié afin de trouver ses coordonnées. Si vous n’arrivez pas à les repérer, communiquez avec nous à PublicationsArchive-ArchivesPublications@nrc-cnrc.gc.ca. Questions? Contact the NRC Publications Archive team at
PublicationsArchive-ArchivesPublications@nrc-cnrc.gc.ca. If you wish to email the authors directly, please see the first page of the publication for their contact information.
https://publications-cnrc.canada.ca/fra/droits
L’accès à ce site Web et l’utilisation de son contenu sont assujettis aux conditions présentées dans le site LISEZ CES CONDITIONS ATTENTIVEMENT AVANT D’UTILISER CE SITE WEB.
International Workshop on Recording, Modeling and Visualization of Cultural
Heritage [Proceedings], 2005
READ THESE TERMS AND CONDITIONS CAREFULLY BEFORE USING THIS WEBSITE. https://nrc-publications.canada.ca/eng/copyright
NRC Publications Archive Record / Notice des Archives des publications du CNRC :
https://nrc-publications.canada.ca/eng/view/object/?id=1ce449f4-9840-4559-bfb0-54c4203c547a https://publications-cnrc.canada.ca/fra/voir/objet/?id=1ce449f4-9840-4559-bfb0-54c4203c547a
NRC Publications Archive
Archives des publications du CNRC
This publication could be one of several versions: author’s original, accepted manuscript or the publisher’s version. / La version de cette publication peut être l’une des suivantes : la version prépublication de l’auteur, la version acceptée du manuscrit ou la version de l’éditeur.
Access and use of this website and the material on it are subject to the Terms and Conditions set forth at
Virtual Reconstruction of Heritage Sites: Opportunities and
Challenges Created by 3D Technologies
Beraldin, Jean-Angelo; Picard, Michel; El-Hakim, Sabry; Godin, Guy;
Borgeat, Louis; Blais, François; Paquet, Eric; Rioux, Marc; Valzano, V.;
Bandiera, A.
National Research Council Canada Institute for Information Technology Conseil national de recherches Canada Institut de technologie de l'information
Virtual Reconstruction of Heritage Sites:
Opportunities and Challenges Created by 3D
Technologies *
Beraldin, J.-A., Picard, M., El-Hakim, S., Godin, G., Borgeat, L.,
Blais, F., Paquet, E., Rioux, M., Valzano, V., and Bandiera, A.
May 2005
* published at The International Workshop on Recording, Modeling and Visualization of Cultural Heritage. May 22-27, 2005. Ascona, Switzerland. NRC 48100.
Copyright 2005 by
National Research Council of Canada
Permission is granted to quote short excerpts and to reproduce figures and tables from this report, provided that the source of such material is fully acknowledged.
1 INTRODUCTION
In recent years, high-resolution recording of heritage sites and cultural artifacts has stimulated a lot of research in computer graphics and vision, and photogrammetry. If the only purpose is the generation of photo-realistic images for visualization, then purely image-based rendering tech-niques offer a general solution. However, if the goal is to analyze the cultural artifacts, to pre-serve and share a record of their geometry and appearance then explicit shape information must be acquired. As Godin et al. (2002) reported, a 3D model contains a wealth of information that can be analyzed and enhanced. Sites that must be closed for conservation reasons can still be studied and visited. Virtual restoration can be used to improve the understanding of a site with-out turning to interventions often traumatic for the original artifact. Elements that were added in a site over the years can be removed digitally and the 3D model of that site can then be viewed in the correct historical context. Multimedia product about the history of a particular site can benefit from the use of spatial information instead of the usual 2D images. The core of the ap-proach presented here is based upon high-resolution photo-realistic texture mapping onto 3D models generated from range images.
Spatial sampling and range measurement uncertainty considerations are addressed by summa-rizing the limits of the different 3D laser scanner measurement techniques currently in use and by giving the results of selected tests on different laser scanners. This paper underpins the im-portance of knowing the measurement limits and understanding the intended application in or-der to take full advantage of the opportunities offered by 3D technologies. Section 2 proposes a survey of the most common 3D laser scanners techniques with an emphasis on spatial resolution limits. Section 3 addresses the use of the 3D data from the point of view of a practitioner where the traditional description of the steps involved in the 3D modeling processing pipeline is aban-doned to concentrate instead on concerns resulting from typical applications. The two cultural heritage projects described in Section 4 use the work presented in those sections to deliver real-istic reconstructions. The paper ends with a discussion and some concluding remarks.
Virtual reconstruction of heritage sites: opportunities &
challenges created by 3D technologies
J.-A. Beraldin, M. Picard, S.F. El-Hakim, G. Godin, L. Borgeat, F. Blais, E. Paquet & M. Rioux
Institute for Information Technology, National Research Council Canada, Ottawa, Canada
V. Valzano & A. Bandiera
SIBA Coordination, University of Lecce, Lecce, Italy
ABSTRACT: This paper looks at the opportunities and challenges created by new 3D technolo-gies introduced recently in the context of virtual reconstruction of cultural heritage sites for preservation and entertainment. A number of projects carried out by the authors in the last four years support the conclusions made in this paper. The projects presented include a 6th century bronze sculpture, metopes/architectural elements of a Greek temple, and, a Byzantine Crypt. Results on CDROM, DVD, 3D theatres, holograms and, video animations have been prepared for these projects. The 3D modeling work that was accomplished in preparing these rich-media products is based mainly upon high-quality photo-realistic texture mapping onto high-resolution 3D models generated from range images. This procedure is enhanced with the integration of both photogrammetric and CAD modeling techniques.
2 OPTICAL SENSORS FOR SHAPE ACQUISITION
When describing and explaining the history of a heritage site, the use of spatial information fa-cilitates the understanding of that particular site. Laser scanners represent an effective way to create high-resolution 3D models of the existing condition of a heritage site or a cultural artifact. Two main classes of laser scanners are reviewed with a particular attention to the fundamental measurement limits. The goal is not to survey all commercial 3D vision systems. Instead, some basic theory about 3D sensing is presented and is accompanied by selected results that should give some pointers in order to become more critical when choosing a 3D solution.
2.1 Range uncertainty of laser scanners for 3D imaging applications
Active 3D imaging sensors can be divided using different taxonomies (Jähne et al. 1999). The main classes are
− Triangulation:
Single spot (1D), profile measurement (2D) coupled to mechanical motion devices, position trackers, mirror-based scanning,
Area measurement (3D really 2.5D) based on multi-point and line projection diffraction gratings, fringe pattern projection, Moiré effect,
− Time delay systems:
Single spot with mirror-based scanning based on pulses, AM or FM modulation, Full field (scannerless) using micro-channel plates or custom build silicon chips, Triangulation fringe projection systems are not considered here. For close range 3D applica-tions, they offer interesting characteristics (Jähne et al. 1999).
2.1.1 Triangulation
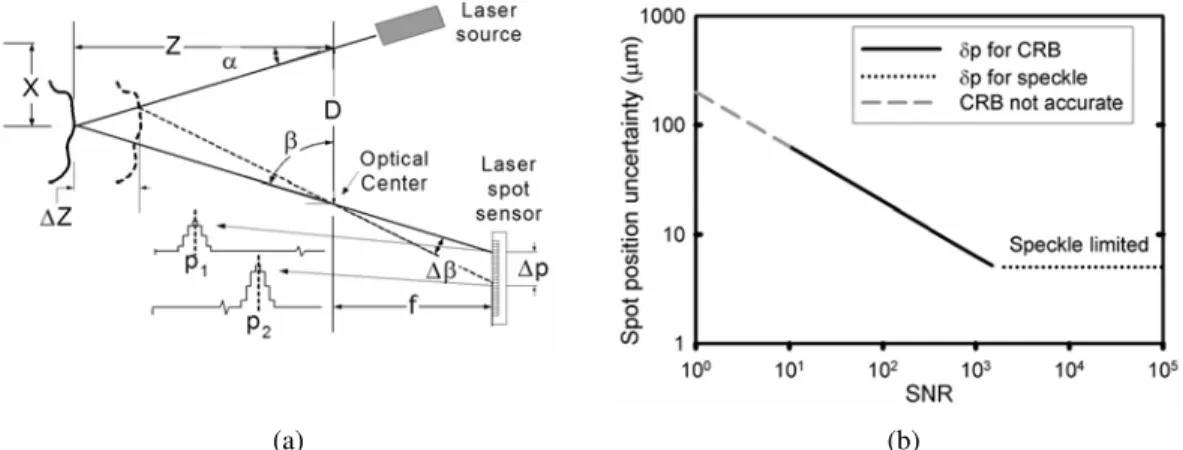
The basic geometrical principle of optical triangulation is shown in Figure 1a. The measurement of range operates as follows. A light source projects a beam on a surface of interest. The scat-tered light from that surface is collected from a vantage point distinct from the projected light beam (distance D). This light is focused onto a position sensitive detector (herein called spot sensor). The knowledge of both projection and collection angles (α and β) relative to a baseline (D) determines the dimensions of a triangle. The complete range equations are derived in Blais (2004). For an incremental change of distance, ΔZ, one measures the incremental angle shift Δβ. This laser spot sensor is in fact an angle sensor. The angular shift Δβ caused by a displacement of the surface is observed through a longitudinal shift in laser spot position Δp = (p1 – p2). For
practical matters, the errors with a triangulation-based laser scanner come mainly from the esti-mate of p, through δp. Error propagation gives the uncertainty in Z as:
p z D f Z δ δ ≈ 2 (1)
where f = effective position of laser spot sensor (effective focal length); D = triangulation base-line; δp = uncertainty in laser spot position; and Z = distance to the surface. The value of δp
de-pends on the type of laser spot sensor used, the peak detector algorithm, the signal-to noise ratio (SNR: power ratio of signal over noise) and the imaged laser spot shape. Each method will per-form differently (Blais & Rioux 1986). In the case of discrete response laser spot sensors, as-suming a high SNR and a centroid-based method for peak detection, the limiting factor will be speckle noise (Baribeau & Rioux 1991, Dorsch et al. 1994) which is approximately given by:
fn p λ π δ 2 1 ≈ (2)
where fn = receiving lens f-number; and λ = laser wavelength. Substitution of (2) back into (1) shows that δz does not depend on the effective focal length, f. The fact that the amount of light
collected decreases with the distance squared and typical surfaces have varying surface reflec-tance both contribute to a deterioration of the SNR. To find the effect of the SNR, one can use the result obtained from a well-known problem in statistical parameter estimation theory that is
the estimation of the arrival time of a pulse in additive band-limited Gaussian noise (Poor 1994). For a laser spot sensor and for SNR>10, the uncertainty is given by:
BW SNR p 1 ≈ δ (3)
where BW = root-mean-square signal bandwidth or normalized second moment of the power spectral density of the signal (in units of spatial frequencies). This result is also known as the theoretical Cramér–Rao bound (CRB) on the variance. To lower the uncertainty, one has to in-crease the effective signal bandwidth which agrees with intuition since a large bandwidth corre-sponds to a signal pulse with sharp edges and hence betters discrimination against background noise. The graph on Figure 1b shows a typical behavior of the spot position uncertainty as a function of SNR. A detailed analysis can show that the error distribution in (X, Y, Z) is skewed and oriented with the line of sight. This is represented schematically on Figure 2a. Figure 2b presents the range uncertainty of triangulation-based systems for typical design values i.e. λ=0.633 μm, D/Z=0.35.
(a) (b)
Figure 1. (a) Laser-based optical triangulation (single spot), (b) spot position uncertainty as a function of SNR and speckle for a triangulation-based laser scanner.
(a) (b)
Figure 2. (a) Schematic diagram of the typical spatial error distribution for a range scanner, (b) depth un-certainty amongst different range scanners (SNR >> and the sampling rate > 100-3D points per second).
2.1.2 Time delay systems
In a given medium, light waves travel with a finite and constant velocity. Thus, the measure-ment of a time delay created by light traveling from a source to a reflective target surface and back to the source (round trip, τ) offers a very convenient way to evaluate distance, Z=c×τ/2.
The current accepted value for the speed of light in a vacuum is exactly c = 299,792,458 m/sec. Let us assume that the speed of light is 3×10⁸ m/sec. Different strategies have been devised to exploit this measurement principle: Time-Of-Flight (TOF) with pulsed lasers, Amplitude Modu-lation (AM), Frequency ModuModu-lation (FM) systems (Amann et al. 2001). Long-range sensors (range exceeding 10 m) are usually based on the time-of-flight (TOF) technology (aka ladar or lidar). The range uncertainty for a single pulse is approximately given by:
SNR T c r p r 2 ≈ − δ (4)
where Tr = laser pulse rise time. Assuming SNR=100 and Tr=1 nanosecond, the range
uncer-tainty is about 15 mm. Most high-speed commercial systems (>1000 3D points per second) based on TOF provide a range uncertainty in the range 5 mm to 50 mm as long as a high SNR is maintained (Figure 2b). The collected signal power depends mainly on source power, distance and reflectance properties of material. Averaging N measurements will reduce δr-p by a factor
proportional to square root of N. Equation (4) is similar to the result obtained for the estimation of the arrival time in the case of the radar ranging problem i.e. Equation (3) multiplied by c/2. Finally, typical TOF systems for terrestrial applications have an ambiguity interval (time spac-ing between consecutive pulses) which can be several kilometers.
Continuous wave (CW) modulation gets around the measurement of short pulses by modulat-ing the power or the wavelength of the laser beam. For AM, the intensity of the laser beam is amplitude modulated. The projected and collected beams are compared and the phase difference between the two waveforms yields the time delay. The range uncertainty is approximately given by: SNR m AM r λ π δ 4 1 ≈ − (5)
where λm= wavelength of the amplitude modulation (or c/fm). A low frequency fm, makes the
phase detection less reliable. Because the returned wave cannot be associated with a specific part of the original signal, it is not possible to derive the absolute distance information. This is known as the ambiguity interval and is given by λm/2. To get around the range ambiguity
inter-val (several meters), one can use multiple frequency waveforms. For instance, assuming a two-tone AM system (10 MHz and 150 MHz) and a SNR=1000, the range uncertainty is about 5 mm and the ambiguity, 15 m. Typical commercial systems can scan a scene at rates ranging from 10 kHz to about 500 kHz. Some optimized AM systems can achieve sub-100 μm uncertainty val-ues but over very shallow depth of fields (see Figure 2b).
The second most popular CW system covered in this section is based on frequency modulated (FM) with either coherent or direct detection. In one implementation, the frequency (wave-length) of the laser beam is linearly modulated either directly at the laser diode or with an acousto-optic modulator. The linear modulation is usually shaped as a triangular or saw-tooth wave (chirp). The important aspects of this method are determined by the coherent detection taking place on the optical detector and the fact that the beat frequency resulting from this opti-cal mixing encodes the round trip time delay. For this technique, the range uncertainty is ap-proximately given by:
t FM r f c Δ ≈ − 4 δ (6)
where Δft = tuning range or frequency excursion. With coherent detection, the system can
achieve for a tuning range of 250 GHz and at a low enough data rate (1 to 2-3D points per sec-ond), a measurement uncertainty of about 10 μm. Because of the coherent detection, the dy-namic range is typically 109. Some commercial systems provide a measurement uncertainty of about 30 μm at a data rate of 40 points/sec and 300 μm at about 250 points/sec (Guidi et al. 2005). Interesting enough, for range between 2 m and 10 m, there are very few laser scanners available commercially. In fact, this range of distances represents a transition between triangula-tion and time delay-based systems (Figure 2b).
(a) (b) Figure 3. a) Dashed line: diffraction-limited X-Y spatial resolution as a function of measured volume,
Solid line: Z uncertainty for triangulation-based laser scanners, b) Visual acuity of the human eye: 1 min-ute of arc and 6 minmin-utes of arc (left vertical axis); Depth-Of-Field (DOF) for f=24 mm and Blur=8 μm. 2.2 Spatial image resolution
2.2.1 Laser propagation
Optical laser scanners resolution is limited by the diffraction of the laser beam. Even in the best emitting conditions, the laser beam does not maintain collimation with distance. Using the Gaussian beam propagation formula and the Rayleigh criterion, the depth of focus “range” is
λ ω π 2 2 o f D = (7)
where ωo = laser beam radius (at best focus distance defined at e-2). The laser beam radius which
depends on the numerical aperture (NA) of the focusing laser lens defines the spatial sampling in the scene. Figure 3a gives, for λ = 0.633 μm, the spot radius as a function of the focus range (Rioux et al. 1987). Equation (7) applies to both triangulation and time delay laser scanners. 2.2.2 Resolution of 2D cameras and the visual acuity of the human eye
Diffraction also limits other imaging systems e.g. 2D cameras. The Rayleigh Criterion allows for the computation of the smallest resolvable feature “circle of least confusion” for a circular aperture:
fn
d≈1.22λ (8)
This last equation applies to the case where the sensor resolution is not limited by the RGB color filter on the image sensor and by optical aberrations which set a more stringent limit on the resolving power. The computation of the Modulation Transfer Function (MTF) gives a more complete view of an imaging system. An example of interest is in a display application where it is critical to consider the visual acuity of the eye. Many factors like field luminance, contrast ob-ject-background, scene complexity and angular subtence affect the ability to detect and recog-nize features in an image. The eye can resolve close to 1 arc-min (Smith & Atchinson 1997). Or, with a pupil diameter of about 2 mm (bright room) and f=20 mm, resolution on the retina is about 5.8 μm (eye receptors size). Actually, in order to recognize a feature in a complex field, about 6 minutes of arc are required; both conditions are shown on Figure 3b. Finally, when ac-quiring 2D images at close range (e.g. texture mapping) of objects that are inherently 3D, one must use the proper DOF in order to limit blur to an acceptable level:
Blur f Z DOF Φ ≈2 2 (9)
where Z = distance lens-to-object; Blur = blur spot (circle of least confusion); and Φ = aperture diameter. For example, at Z=2.5 m, f=24 mm, Blur spot ≈ 8 μm and Φ=6 mm (fn=4), than the depth of field is about 700 mm (Figure 3b).
2.3 Objects material and surface texture effects
One must be aware that not all 3D information acquired by optical means is reliable (Buzinski et al. 1992, Hebert & Krotkov 1992). The underlying hypothesis of active optical geometric meas-urements is that the imaged surface is opaque, diffusely reflecting and uniform. Hence, not all materials can be measured accurately like a vapor-blasted aluminum (VB-Al) surface. Dorsch et al. 1994 discuss and analyze technical surfaces (machined metals) that show a deterministic structure like macroscopic scratches with locally varying surface properties. An interesting ma-terial i.e. marble used in heritage applications is studied by Godin et al. (2001). Marble departs from this hypothesis, and exhibits two important optical properties in this context: translucency, and non-homogeneity at the scale of the measurement process. This structure generates two key effects on the geometric measurement: a bias in the distance measurement, as well as an in-crease in noise level (uncertainty) that varies with the laser spot size. For instance, in an experi-ment, flat pieces of VB-Al and marble were measured using both a FMCW system and a close range triangulation laser scanner. In both cases, a plane equation was fitted using the same algo-rithm. The FMCW system gave 14 μm on VB-Al and on marble, 87.6 μm. The laser triangula-tion system gave 30 μm on VB-Al and on marble, 49 μm. Indeed, the FMCW behaved in a sur-prising way! Finally, the type of feature being measured is an important factor affecting the accuracy of a vision system. The accuracy drops when measurements are performed on objects with sharp discontinuities such as edges, holes, and targets (Buzinski et al. 1992). Therefore, in selecting a vision system for a particular application, one must take into account the ability of the system to measure the features of interest with the required accuracy.
3 3D MODELLING AND THE OPERATOR
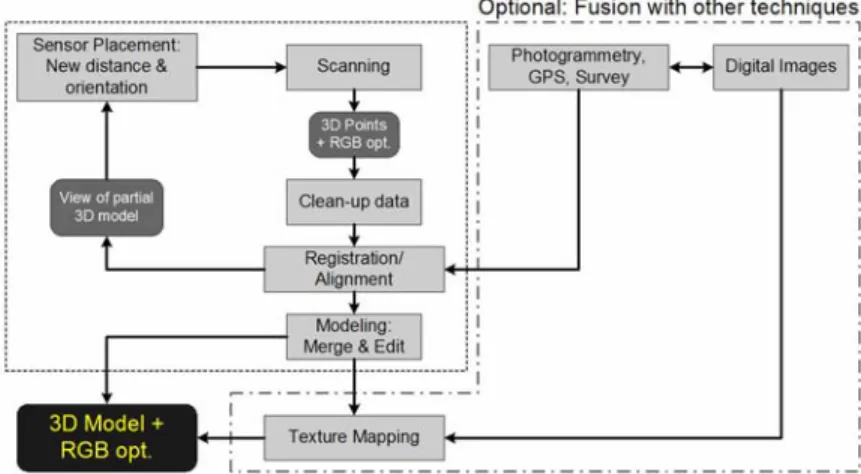
In this section, some of the steps found in the processing pipeline are summarized. We restrict our discussion to a few examples that highlight some concerns linked to 3D modeling from range data. Figure 5 sketches the steps involved in creating a 3D model. Optional technology can complement 3D scanning (e.g. photogrammetry).
3.1 Scanner acquisition and interface
From Section 2, one can conclude that dense high-resolution 3D images can be acquired. But to generate a high resolution model, one must take into account the data that is not reliable. This data is not necessarily flagged by the scanner interface software. As an example, two scans were performed on a bronze surface; one taken at a standoff distance to avoid saturation but yielded a low resolution (Figure 6a) and one at closer range but with a saturation zone (Figure 6b). The saturation zone is clearly visible in the upper right corner of the image. In the majority of cases, the operator is left with the time consuming task of deciding to proceed with a low-resolution 3D scan or keep the high-resolution data but remove manually the saturated zone. Operator in-tervention becomes critical in order to achieve the quality goals expected by cultural heritage projects. If not detected and corrected, saturations can increase systematic errors. These artifacts must be singled-out and removed (at least reduced) from the rest of the processing pipeline oth-erwise unwanted pattern can occur in the final model (Figure 7a). Artifacts might be the product of creative editing though advanced functions found in 3D modeling. Systematic errors are pre-sent in all 3D systems to different degrees and for different reasons like poor calibration or ma-terial properties (see Section 2.3). For instance, waves in the raw 3D images are produced when the range camera or the object being scanned moves (Figure 6c). The waves can be removed by proper sensor choice (faster scanner), reducing motion or filtering the raw 3D images. Unfortu-nately, filtering can alter the X-Y spatial resolution. Best performance is achieved when the X-Y spatial resolution remains unaltered. A number of tests were conducted to determine the best system to measure the surface of a bronze statue. Figure 7 shows qualitatively using synthetic shading the level of spatial resolution and uncertainty for two systems (raw data without filter-ing).
3.2 The operator
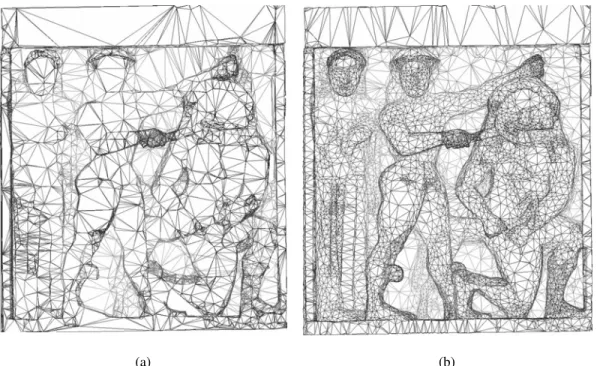
Expertise is hard to acquire, three-dimensional acquisition and modeling and certainly, 3D in-spection do not escape from this fact. From our experience, we separate operators into three main classes: novice, skilled and expert. Figure 4 shows an example where a metope was scanned and the 3D modeling was performed by two different operators, i.e. skilled and expert. Figure 4a shows the result after alignment, merging and compression in the case of the skilled operator. This mesh contains about 36 000 polygons. The expert operator produced the result shown in Figure 4b starting from the same 3D images (Minolta 900) and the same 3D modeling software package (Polyworks ModelerTM). This mesh contains only 20 000 polygons. From this experience, one might be tempted to conclude that the scanner could be of low resolution or the modeling software is of poor quality (or both). The difference between these models comes from the fact that the skilled operator did not remove the 3D artifacts originating from abrupt shape variations. The removal of these from the processing pipeline allowed for a better redis-tribution of polygons where they were needed most (see Figure 4b). It is only through a proper understanding of the complete measuring and processing chain (operator included) that one can take full advantage of seemingly different but complementary technologies.
(a) (b) Figure 4. 3D modeling and compression as a function of operator skills. Same data and modeling
soft-ware, a) 36 000-polygon model prepared by a skilled operator, b) 20 000-polygon model prepared by an expert operator (the images are not inverted!).
4 APPLICATIONS: FUSION OF 3D INFORMATION FOR COMPLEX SITE MODELING The current trend in cultural heritage applications requires modeling complex sites that are also composed of several objects with various characteristics. It is therefore imperative to combine data from different sensors and information from different sources (El-Hakim et al. 2004). There is no single approach that works for all types of environment/objects, is fully automated and satisfies the requirements of every application. A general approach combines models cre-ated from multiple sources. In particular, two types of approaches have been used in cultural heritage applications: information augmentation and uncertainty management. Information augmentation refers to a situation where each sensor provides a unique piece of information to an application and fusion extends, for example, the system's spatial/temporal coverage. Uncer-tainty management covers situations where different sensors measure the same object/site from
different locations or times. In order to deliver the best description of the object/site with the lowest uncertainty, one must manage the uncertainties linked to the sensing devices, the envi-ronment and a priori information. The objectives of the data fusion are to minimize the impact of those uncertainties and to get the most out of the multi-sensor platform. The two applications presented here are aimed at the general public and to a certain degree to the expert. To achieve these goals, 3D modeling was performed by the complementary use of both photogrammet-ric/CAD techniques with 3D laser scanner data (both are information augmentation cases). 4.1 Virtualizing the Byzantine Crypt of Santa Cristina in Carpignano Salentino, Italy 4.1.1 Modeling techniques
The application required to model the Byzantine Crypt with a high spatial resolution where in-scriptions (∼ 1 mm) would be readable and the details of the chisel marks (∼ 2 mm), visible in a virtual visit of the site using stereoscopic equipment (viewing at 1-2 m). Furthermore, during the course of history, a Baroque altar was added along with three pillars that replaced one that col-lapsed. These elements had to be removed in the 3D model so the site could be viewed in the correct historical context. The outside of the Crypt was modeled with photogrammetry using ShapeCaptureTM and the inside that measures about 16.5 m × 10 m × 2.5 m, using dense 3D la-ser scanner information combined with high-resolution color images for texture. Irregularly shaped walls covered with a number of frescoes are a perfect match for this technology. The de-tails are described in Beraldin (2002). As discussed in Section 2, for these kinds of environ-ments, only a handful of range cameras on the market can provide the desired level of spatial resolution and measurement uncertainty. A Mensi SOISIC-2000 scanner with a baseline of 750 mm was used to create a dense 3D model of the Crypt. This triangulation-based laser scanner acquires 3D images at a minimal distance of 0.8 m and at up to 10 m. The range uncertainty on the Crypt’s wall surface at 2.5 m is about 0.8 mm (1 sigma) and the data rate is 100-3D points per second. Though the spatial sampling X-Y achievable with this scanner is about 0.25 mm at a distance of 2.5 m, it was decided to use a coarser sampling step on the mesh (5 mm) to make the scanning time manageable (part of the ceiling and floor are at a step of 15 mm). This level of resolution was deemed adequate though not optimal. Texture mapping was prepared with an image perspective technique (IPT) using TexCaptureTM and a uniform illumination. The resolu-tion and color quality of the images provided by the internal video camera of the scanner were not acceptable for our application. Hence, an SLR 6-Megapixel digital camera was used for the texture acquisition (Nikon D1X). The X-Y resolution of the 2D images was between 0.75 mm and 1 mm which met our target resolution. Using the visual acuity of the human eye, a virtual tour or presentation of the information could be done at a minimum equivalent observation dis-tance of 1 m (see Figure 3b). But because of the spatial resolution and range uncertainty (syn-thetic shadings tend to increase the apparent range noise), the visit for the general public is usu-ally performed at an equivalent distance of 2 m.
Realistic estimates of the time to acquire range images and build 3D models are very critical for such projects. With an average scan time of 80 minutes per 3D image, a total of 92 hours were spent in the Crypt. The 3D model was created over a period of one month. The acquisition of the texture took three days and the actual mapping was done in four days. A large amount of time was dedicated to the actual scans, i.e. 50%. The second largest slice of time was dedicated to finding the next best view (moving the equipment, pre-scanning an area in order to control surface coverage). It is interesting to note that for the case of the Crypt, a faster scanner would have permitted for the same total scan time, an X-Y spatial resolution 10 times better (per axis) than what was imposed by time constraints i.e. from 5 mm to 0.5 mm. Three versions of the fi-nal model were adapted for the different multimedia products: one 4.6 million-polygofi-nal un-textured model (10 mm resolution) of the complete Crypt, a 12.8 million-polygon fully un-textured model (5 mm resolution) of one half of the Crypt (contains the two apses), and, a lighter tex-tured model with 0.4 million polygons. A number of derived results were made and used for di-verse purposes: visualization of the 3D model through the ground, floor plan, large format holo-grams, discovery of the probable location of the pillar that collapsed in the 18th century etc. Figure 8a shows an ortho-photo that was generated from the 3D textured model that is syntheti-cally illuminated with a light that approaches the sun’s spectrum. Figure 8b highlights a section that wall.
4.1.2 CDROM, video animation, interactive visit
Ortho-photos, cross-sections and smaller 3D models are used to navigate through the informa-tion on a CDROM. A movie called "Carpiniana" showing a fly through of the Byzantine Crypt was also prepared (3D Studio Max). Snapshots of the CDROM and Video animation are shown on Figure 9 and Figure 10 respectively. For the movie, the model contained 400 000 polygons, 1/5 of the maximum texture resolution, 13 lights, 5000 frames at a 720 × 576 resolution. When the animation was realized in 2002, the computing power was not sufficient to deal with the high-resolution model. Today, the full resolution (shape & texture) can be used along with a more complex lighting arrangement. Finally, the presentation of the Byzantine Crypt is now available through a virtual reality theatre that can display the full resolution model and allows for a real-time navigation inside the Crypt for further study.
4.2 Virtual reconstruction of Temple C of Selinunte, Sicily, Italy
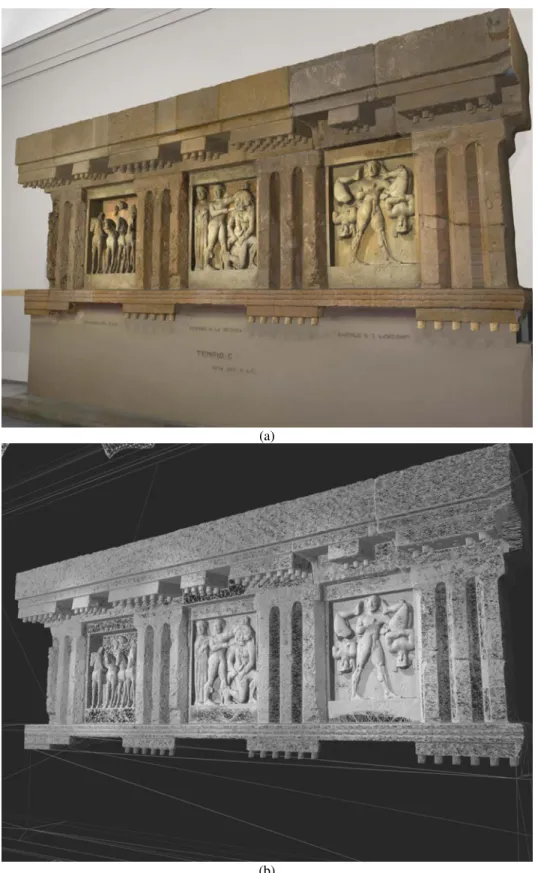
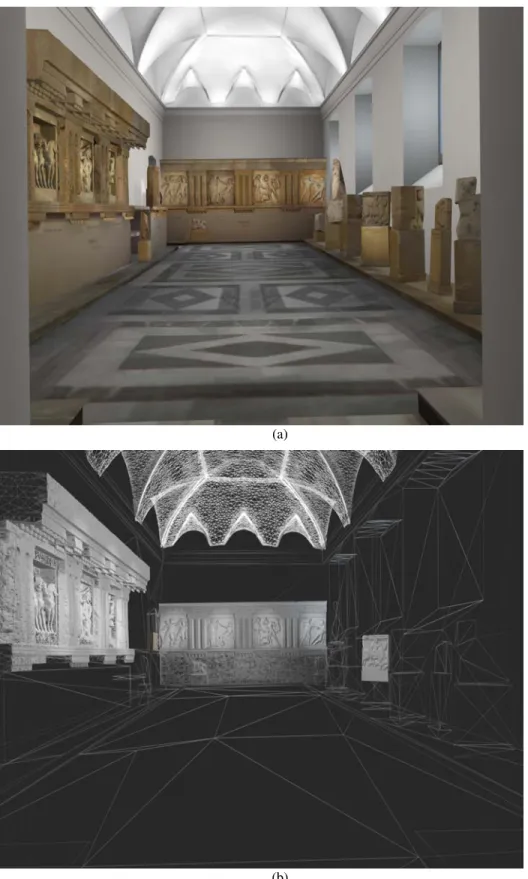
The goal of this project is to recreate an environment that no longer exits except for some tem-ple remains. The project is divided into two broad steps, the first step saw the modeling of the frieze of temple C of Selinunte using 3D laser scanning and the second on-going step will see the reconstruction of temple C of the Acropolis of Selinunte (see Figure 11a) using photogram-metry and CAD tools, and, historical information. One of the main concerns was the determina-tion of the required spatial resoludetermina-tion and the technical difficulties the team might encounter in modeling those remains. The spatial resolution depends on the level of details required by the project but here it was limited by the equipment available and the site (see Figure 11a and Figure 11b). Figure 12 shows the results of the modeling of a metope known as "Perseo and Medusa". Both 3D laser scanning and texture mapping were used to create this model in a man-ner similar to the project Carpiniana described earlier. The same technique was applied on the other two metopes associated to temple C. The average size of each metope is 1 m × 1 m × 0.4 m and the number of 3D images required to cover most of the surface is in the order or 175 to 200 images depending on the complexity of the metope. The spatial X-Y resolution is about 0.5 mm. Again, high quality textures were realized using high quality flash lamps, MacBeth charts and Photoshop. The gray scale available of that chart was used to correct the gamma of the camera and the different levels of illumination. A five-point correction method was used. The 3D model of the frieze from Temple C including the three metopes is shown on Figure 13. We continued the laser scanning work using both the Minolta and Mensi laser scanners on different sections inside the museum room (Figure 11b). The first scanner was used to acquire details in the order of 0.5 mm to 2 mm while the second scanner captured details in the range of 2-10 mm. The rest of the 3D model of the room was created using photogrammetry-based modeling tech-niques and some simple CAD modeling. Figure 14 shows a rendering of the complete museum room dedicated to Selinunte. From that complete model, a video animation was realized with 3D Studio Max. The compressed model used for this animation contains 5 million polygons, the maximum texture resolution available. A total of 64 lights and 6700 frames at a resolution of 720 X 576 were rendered. This represents an important improvement in terms of resolution compared to the animation Carpiniana that was realized two years earlier.
5 CONCLUSIONS
The potential of 3D modeling in cultural heritage applications opens-up many possibilities. If the goal of these applications is to analyze the works, to preserve and share a record of their ge-ometry and appearance then a digital surrogate must be acquired. For instance, sites that must be closed for conservation reasons can still be studied and visited and virtual restoration can be used to improve the understanding of a site. Multimedia products can benefit from the use of spatial information instead of the traditional approaches. The core of the approach presented here is based upon high-resolution photo-realistic texture mapping onto 3D models generated using laser range scanners. The spatial sampling and range measurement uncertainty limits were addressed for the different 3D laser scanner measurement techniques currently in use on the market. A number of results on different laser scanners were presented and described from a practitioner’s point of view. These were used to underpin the importance of knowing the
meas-urement limits. Two cultural heritage projects were presented i.e. a Byzantine Crypt of the IXth century AD and a Greek temple VIth century BC. These applications benefited from the use of 3D modeling to enhance the understanding of those heritage sites. Diverse multimedia results were created to fulfill that scope (CDROM, DVD, virtual 3D theatre, holograms, and, video an-imations). As demonstrated, a high degree of realism can be attained by those techniques. More research and development is required to stream line the acquisition and modeling processes. These steps currently require relatively large amounts of time which have an impact on market acceptance. Though laser scanners for 3D measurements were emphasized, they are only part of the whole solution for cultural heritage applications.
ACKNOWLEDGEMENT
The work on the Byzantine Crypt of Santa Cristina was realized within initiative I18 of the "Pi-ano Coordinato Catania-Lecce" co-financed by the EU (FESR) and on temple C of Selinunte, Activity 4 of the project LandLab, co-financed by the EU (PON 2000-2006). We would like to thank G. Guidi, A. Spinetti A. Brogi, E. Whiting, M. Zannoni, C. Loschi, S. Nuccio and P. Pulli through their great dedication made important contributions to these projects. Special thanks go to L. Cournoyer and J. Taylor for their advice on many aspects linked to the applications of 3D. REFERENCES
Amann, M-C, Bosch, T., Lescure, M., Myllylä, R. & Rioux, M. 2001. Laser ranging: a critical review of usual techniques for distance measurement. Optical Engineering 40(1): 10-19.
Baribeau, R. & Rioux, M. 1991. Influence of Speckle on Laser Range Finders. Applied Optics 30: 2873-2878.
Beraldin, J.-A., Picard, M., El-Hakim, S.F., Godin, G., Valzano, V., Bandiera, A., Latouche, C. 2002. Virtualizing a Byzantine Crypt by Combining High-resolution Textures with Laser Scanner 3D Data.
Proc. of VSMM 2002, Gyeongju, Korea, 25-27 Sept.: 3-14.
Blais, F. & Rioux, M. 1986. Real-time numerical peak detector. Signal Processing 11(2): 145-155. Blais, F. 2004. A review of 20 years of range sensor development. Journal of Electronic Imaging 13(1):
231-243.
Buzinski, M., Levine, A., Stevenson, W.H. 1992. Performance characteristics of range sensors utilizing optical triangulation. In Proc. of IEEE 1992 National Aerospace and Electronics Conference, Dayton,
OH, USA, 18-22 May: 1230-1236.
Dorsch, R.G., Hausler, G., Herrmann, J.M. 1994. Laser triangulation: fundamental uncertainty in distance measurement. Applied Optics 33: 1306–1314
El-Hakim, S. F., Beraldin, J.-A., Picard, M., Godin, G. 2004. Detailed 3D Reconstruction of Large-Scale Heritage Sites with Integrated Techniques. IEEE Computer Graphics and Applications 24(3): 21-29. Godin, G., Rioux, M., Beraldin, J.-A., Levoy, M., Cournoyer, L., Blais, F. 2001. An assessment of laser
range measurement on marble surfaces. In: 5th Conference on Optical 3D Measurement Techniques, Wien, Austria, Wichmann Verlag, Heidelberg., 1-4 October 2001: 49-56.
Godin, G., Beraldin, J.-A, Taylor, J., Cournoyer, L., Rioux, M., El-Hakim, S.F., Baribeau, R., Blais, F., Boulanger, P., Picard, M., Domey J. 2002. Active Optical 3D Imaging for Heritage Applications. IEEE
Computer Graphics and Applications 22(5): 24-36.
Guidi, G., Frischer B., De Simone, M., Cioci, A., Spinetti, A., Carosso, L., Micoli, L.L., Russo, M., Gras-so, T. 2005. Virtualizing ancient Rome: 3D acquisition and modeling of a large plaster-of-Paris model of imperial Rome. In Proc. of the SPIE Videometrics VIII. Vol. 5665, San Jose, USA, 18-20 Jan.: 119-133.
Hebert, M. & Krotkov, E. 1992. 3-D Measurements from Imaging Laser Radars: How Good Are They?
International Journal of Image and Vision Computing 10(3): 170-178.
Jähne, B., Haußecker, H., Geißler, P. 1999. Handbook of Computer Vision and Applications. San Diego: Academic Press.
Poor, H.V. 1994. An introduction to signal detection and estimation. 2nd Ed., NY: Springer-Verlag. Chap VII. p. 331.
Rioux, M., Bechthold, G., Taylor, D., Duggan, M. 1987. Design of a large depth of view three-dimensional camera for robot vision. Opical Engineering 26(12): 1245–1250.
Smith, G., & Atchinson, D.A. 1997. The Eye and Visual Optical Instruments. Cambridge, Cambridge University Press.
Figure 5. General procedure for range–based 3D modeling. “to be reproduced in color”
(a) (b) (c)
Figure 6. 3D acquisition in difficult situations: (a) scan performed at 30 cm standoff, (b) scan performed at a closer distance, 15 cm, showing better spatial resolution but with a saturation zone (upper right corner on thigh), (c) wave phenomenon created by the motion of the 3D camera with respect to the object. “to be reproduced in color”
(a) (b) (c) Figure 7. 3D Artifacts and resolution: (a) shaded view showing junction lines due to the alignment of data
containing artifacts, (b) shaded view created from 3D data acquired with a Minolta 900 (tele-lens) scan-ner, (c) shaded view created from 3D data acquired with a ShapeGrabberTM SG-102 (same object sur-face). “to be reproduced in color”
(a) (b) Figure 8. (a) Ortho-photo generated from the textured 3D model, top image: illuminated with synthetic
lighting, bottom image: lighting simulating the sun illumination (width of about 8250 mm), (b) Close-up view showing the level of resolution of the model with texture images necessary to read the inscriptions. “to be reproduced in color”
(a) (b) Figure 9. Some screen snapshots of the CDROM ‘CARPINIANA’: (a) entrance page, (b) use of
ortho-photos generated from the 3D model to navigate through the frescoes. “to be reproduced in color”
(a) (b) Figure 10. Still images taken from the movie included on the DVD: (a) view of crypt without texture, (b)
(a)
(b)
Figure 11. Photographs of site: (a) ruins of temple C of the Acropolis of Selinunte, Sicily, (b) Room dedi-cated to Selinunte lodedi-cated at the “Museo Archeologico Regionale” of Palermo, Sicily. “to be reproduced in color”
(a) (b) Figure 12. Model of the metope "Perseo and Medusa", (a) texture-mapped 3D model, (b) shaded view.
(a)
(b)
Figure 13. (a) Three-dimensional model of a section of the frieze of Temple C of Selinunte, texture-mapped 3D model, (b) wire-mesh of the 3D model showing the level of details. “to be reproduced in color”
(a)
(b)
Figure 14. Virtualized Museum room, (a) Rendering of the complete 3D model of the museum room dedicated to Selinunte, (b) wire-mesh showing the multi-resolution 3D model. “to be reproduced in color”