HAL Id: hal-02738067
https://hal.inrae.fr/hal-02738067
Submitted on 2 Jun 2020HAL is a multi-disciplinary open access
archive for the deposit and dissemination of sci-entific research documents, whether they are pub-lished or not. The documents may come from teaching and research institutions in France or abroad, or from public or private research centers.
L’archive ouverte pluridisciplinaire HAL, est destinée au dépôt et à la diffusion de documents scientifiques de niveau recherche, publiés ou non, émanant des établissements d’enseignement et de recherche français ou étrangers, des laboratoires publics ou privés.
Which incentives for direct selling? An analysis of
French farms
Geoffroy Enjolras, Magali Aubert
To cite this version:
Geoffroy Enjolras, Magali Aubert. Which incentives for direct selling? An analysis of French farms. 15. EAAE Congress ’Towards Sustainable Agri-food Systems: Balancing Between Markets and Society’, European Association of Agricultural Economists (EAAE). The Hague, INT., Aug 2017, Parme, Italy. �hal-02738067�
Which incentives for direct selling? An analysis of French farms
Enjolras, Geoffroy* ; Aubert, Magali**
* UGA, Université Grenoble Alpes, CERAG, Grenoble, France** INRA, UMR 1110 MOISA, F-34398 Montpellier, France
Contribution presented at the XV EAAE Congress ‘Towards Sustainable
Agri-Food Systems : Balancing Between Markets and Society’
August, 29
th– September 1
st, 2017
Parma, Italy
Which incentives for direct selling? An analysis of French farms
Abstract
This article focuses on factors which incite farmers to sell their production at the retail level, a marketing channel that is currently enjoying renewed interest. Based on data from the Farm Accountancy Data Network 2006-2014, we establish the contrasting profiles of farms that sell their production directly to consumers: they are smaller, permanent-labor-intensive and propose an increase range of produces compared to other kinds of farms. While we highlight sectorial differences, the common point of these farms is to use fewer pesticides, which is consistent with the quality signal sent to consumers. Implications in terms of public policy are suggested.
Keywords:
Direct selling, FADN, France1
Introduction
In recent years, short food supply chains (SFSCs) have enjoyed renewed interest, both from a practical and a theoretical perspective (Kneafsey et al., 2013). Their development fundamentally responds to a need for information which has become all the more important in the wake of food scandals that have weakened consumer confidence. Within SFSCs, any exchange should involve at most one clearly-identified intermediary. When no intermediary is present, the sale is said to be ‘direct’, while it becomes ‘indirect’ as soon as an intermediary is involved.
SFSCs, and among them direct selling, are usually attributed several virtues closely associated with the three pillars (social, environmental and economic) of sustainable development. At the social level, short food supply chains promote close relationships between producers and consumers that induce confidence. SFSCs are also associated to a lesser use of phytosanitary products (Aubert and Enjolras, 2016). Finally, in economic terms, both parties are supposed to find a mutual interest. The producer retains much of his added value thanks to the absence or limited number of intermediaries while the consumer is supposed to benefit from better-quality products sold at prices not too dissimilar from prices charged through long food supply chains (Martinez et al., 2010).
The development of SFSCs has been encouraged in most developed countries. At the European level, the second pillar of the Common Agricultural Policy encourages the development of SFSCs as a means of fostering rural development (Goodman et al., 2012). At the domestic level in France, the Ministry of Agriculture initiated an action in June 2009 aimed at developing direct sales. This effort was embodied in article 230-1 of Act No. 2010-874 dated July 27, 2010 relating to the modernization of agriculture and fishing. This law encourages actions related to the “development of short food supply chains and […] geographical proximity between producers and processors”. France is the largest European producer of agricultural commodities in terms of acreage and production value (Eurostat, 2015). The country also plays the leading role with regard to the development of direct selling. In 2010, nearly 84,000 farmers (about one fifth) sold all or part of their production through short food supply chains (Agreste Primeur, 2012). However, the study of the French context reveals large regional and sectorial disparities (DRAAF Limousin, 2012). It also shows the existence of size and specialization effects.
Because of the interest shown in them, SFSCs have been the subject of many empirical contributions but very little attention has been paid to producers and the choices they make in favour of alternative food networks, and especially farm retailing (Martinez et al., 2010). The few studies on this subject are qualitative for small data volumes (Chiffoleau et al., 2013; Verhaegen and Van Huylenbroeck, 2001) or quantitative when a survey of agricultural farms can be used (Detre et al., 2011). The common point between these studies is that they restrict their analyses to
the individual and structural parameters of farms incorporated within SFSCs. Consequently, several crucial points such as the performance or the sustainability of farms involved in short supply chains are not studied in sufficient detail (Blanquart et al., 2010).
In order to complement the existing literature on SFSCs and direct selling, the contribution provided by this paper is threefold. First, we propose an innovative analysis concerning the factors leading farmers to adopt direct selling as a marketing channel. The aim of this research is to demonstrate the existence of a typical profile of farmers, both on a global scale and with regard to agricultural specialization. Second, this analysis takes specific account of financial and economic parameters in addition to structural ones. These aspects are likely to explain the level of farmers’ commitment to direct selling, because of the risks they take and the profitability they gain. Third, we use data from the French Farm Accountancy Data Network (FADN) for years 2006-2014 because they provide a representative overview of professional French farms, particularly in terms of productive orientation, as well as individual, structural and financial aspects of farms. They make it possible to differentiate producers who are involved in direct selling.
Our article is organized as follows. In the first part, we present the specific theoretical framework of our analysis, focusing on the determinants of direct selling as well as the resulting assumptions. In the second part, we illustrate the empirical framework including the database used and the models estimated while in the third part, we highlight some descriptive statistics and the econometric results in order to determine the parameters leading to the practice of direct selling. In the fourth part, we conclude by presenting a summary of the factors encouraging farms to sell their products at the retail level and suggest further avenues to be explored in relation to this study.
2
Theoretical framework: the determinants of direct selling
In this section, we develop the theoretical approach used in our study to determine factors that lead farmers to adopt direct selling practices. The resources and skills available within a farm are a key to understanding the practice of direct selling (Penrose, 1959). The general assumption is that the more resources and skills the farmer has, the more he is able to diversify his marketing channels. This strategy thus aims to provide an additional valorisation of agricultural activity (Feenstra et al., 2003). To this end, direct selling relies on the farm level of activity, skills available within the farm, stocks of assets held by the farmer and risk management practices adopted. The literature provides an overview of these different keys to understanding the diversification of marketing channels.
2.1 Level of activity of the farm
The activity of the farm indicates its production level and thereby its ability to adopt different marketing channels (Blanquart et al., 2010). The value of sales represents both a direct measure of the economic activity of the farm and an indicator of the physical dimension of the farm: the larger the farm, the higher its sales for a specific production. The positive influence of farm size has been emphasized in works highlighting the ability of large farms to diversify their marketing channels (Aubert and Perrier-Cornet, 2012). A high value of sales also motivates the farmer to sell at the retail level because he can retain most of the added value from his production (Chiffoleau et al., 2013). Moreover, coupled or decoupled operating subsidies, which increase total farm revenues, provide the farm with larger financial resources, thus enabling it to diversify marketing channels (Enjolras et al., 2014).
2.2 Skills available on the farm
Beyond the level of activity, individual skills within the farm are key factors in explaining the diversification of marketing channels. More educated and experienced farmers seem more able to sell their own production because they can manage the different aspects of short food supply chains, including the production, transformation and commercialization processes (Aubert and
Perrier-Cornet, 2012; Chiffoleau et al., 2013). The diversification of marketing channels, including the adoption of direct selling, requires more labour (Lanciano and Saleilles, 2010) and more specifically a waged and qualified workforce (Aubert and Perrier-Cornet, 2012).
2.3 Financial assets of the farm
Insofar as direct selling is deemed complementary to traditional channels, only a farm with sufficient financial assets (Chiffoleau et al., 2013) and revenue (Aubert and Perrier-Cornet, 2009) can afford to diversify its marketing channels. The stock of financial assets includes fixed and current assets, which are the counterpart to the invested capital (equity and debt). Working capital is a structural indicator computed as the difference between current assets and current liabilities. Working capital requirement is more a seasonal indicator, which characterizes the money needed by the farmer to finance delayed customer invoices and stocks. A farm having adopted direct selling practices receives cash directly from the sale which, all things being equal, should result in a working capital (requirement) lower than other farms. However, this effect may be counterbalanced by the amount of stock the farm must set aside to satisfy its customers’ needs.
2.4 Profitability and financial risk of the farm
One of the basic aims of a farm is to maximize the value of sales and thereby its profitability and SFSCs may contribute to this objective (Ahearn and Sterns, 2013). A profitable farm has the ability to diversify its marketing channels even if there is not necessarily any incentive to do so. Conversely, farmers adopting traditional marketing channels and observing low or negative profitability of their business may be incited to change their marketing channels, thus adopting direct selling (Conner et al., 2010; Praly, 2010). Adopting this marketing channel can also be examined through the financial risk of the farm, i.e. the risk associated with its indebtedness (Ahearn and Sterns, 2013). Through the leverage effect, the farm’s owner multiplies the profitability of his invested capital as long as the return on the capital employed exceeds the cost of invested capital. To limit the financial risk associated with debt, the farm can nevertheless raise internal financing or cash. Cash flow corresponds to all the underlying credits a farm can invest without having to borrow. Following the above rationale, the more the farm has this capability, the less it will be willing to diversify its marketing channels by selling its production at the retail level.
2.5 Farm risk management
The increased variety of marketing channels responds to consumers’ demands for alternative agricultural products (Lanciano and Saleilles, 2010). Consequently, this strategy offers the farmer an opportunity to diversify the number of customers compared to standard food supply chains in which the farmer trades with a small number of partners. In return, the farmer faces uncertainty in terms of the volume sold. We can therefore assume that the farmers concerned are looking for ways to protect their production against the risks which traditionally affect crops (e.g. diseases, adverse climate). Several means are available, such as crop insurance policies that help to secure economic yields. Phytosanitary products (fertilizers or pesticides) are used as a direct means of preserving crop yield. However, excessive use would be at odds with the quality image conveyed by short food supply chains (Illberry and Maye, 2005; Verhaegen and Van Huylenbroeck, 2001). Farmers may also choose to diversify, particularly by exercising several activities within the farm such as mixed crop and livestock production. Diversification is then measured through the number of different types of production on the farm.
3
Empirical framework
In this section, we present the specific database used and its importance in understanding farmers’ motivations. We also illustrate the econometric model to be estimated.
3.1 Database
In order to examine the producers’ strategy of diversifying marketing channels more closely by considering their structural and individual characteristics, we use data from the European Farm Accountancy Data Network (FADN) for the period 2006-2014. These data are both the most precise available at the individual level and the most complete and recent that we have. The FADN database lets consider the adoption of direct selling at the farm level.
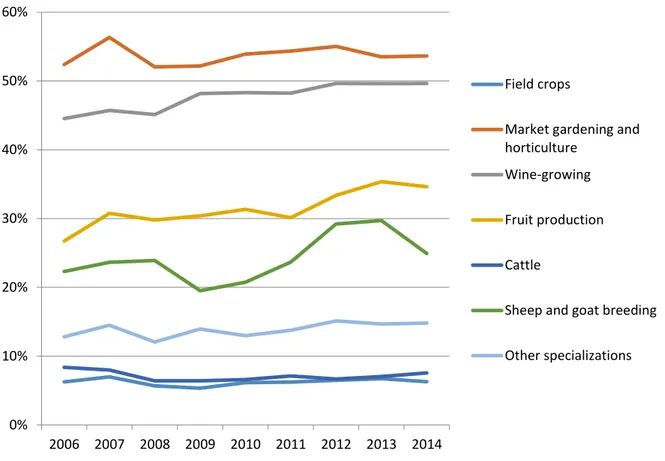
Our analysis considers the determinants of direct selling at the global level for all professional farms regardless of their activities and for the main farms specializations. Some of them (market gardening, wine growing, fruit production, sheep and goat breeding) demonstrate the greatest tendency to adopt short supply chains, making them a relevant field for our analysis. For these specializations and whatever the period considered, from one to three farmers in five sell through this marketing channel while they are less than one in ten for the other specializations (Figure 1).
Figure 1. Dynamics of direct selling according to the economic and technical orientation
The distribution of farms adopting direct selling shows the importance of wine growing involved in this marketing channel (Figure 2). An explanation can be found in the specific characteristics of the concerned productions. Winemaking requires a high level of investments (e.g. cellars, maceration vats and presses) which are often shared within cooperatives, leading to higher integration of marketing channels (Traversac et al., 2011). Although perishable, the other specializations such as fruits, market gardening and cattle breeding face the same financial challenges but these sectors experience difficulties related to volatile weather conditions or drop in prices.
Figure 2. Distribution of farms which adopted direct selling in 2014
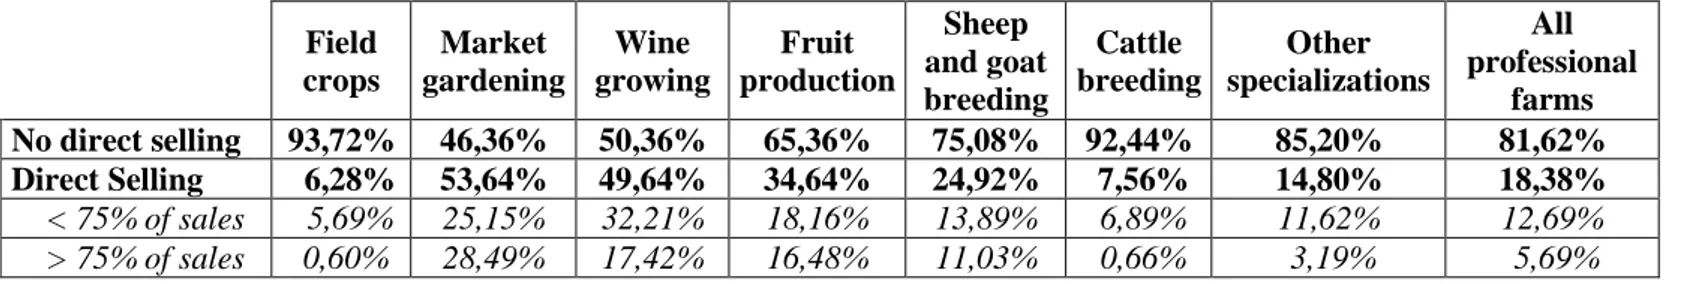
Finally, one of the major advantages of our database is to identify the intensity of direct selling using a ternary variable. This variable distinguishes farms that do not sell through direct selling from farms that adopt such a practice. The latter are differentiated according to whether this marketing channel represents more or less than 75% of the value of sales (Table 1). In general, farms involved in direct selling do not consider this marketing strategy as an exclusive channel.
Table 1. Distribution of farms according to the marketing channel in 2014
3.2 Econometric models
To take into account the individual and temporal dimensions associated to direct selling, we estimate a multinomial logit model. This cross-section model allows to appreciate the intensity of the adoption of direct selling. The model is specified with clusters in order to underline that a same farmer can be present from one year to the next. Such approach is more suitable than a panel data analysis given the fact that farms adopting direct selling stay involved in this marketing channel overtime (Figure 1).
Formally, the model considered can be defined as follows:
Direct selling = ∝ + β*Activity+ γ*Skills+ δ*Financial assets + θ*Profitability and risks + ξ*Risk management + ρ*ETO + τ*Year + ε (1)
Where α represents the constant, β, γ, δ, θ, ξ, ρ and τ the coefficients associated with each group of variables and ε the residuals.
We summarize the model (1) as follows:
Y=X' ρ+μ (2)
Where Y corresponds to the practice of direct selling detailed above. The decision to sell at the retail level is a ternary variable, which takes the value 0 if the farmer does not sell at the retail level, 1 if this activity represents less than 75 % of its sales and 2 otherwise. This choice is conditioned by a continuous effect that is not observed.
This decision is modelled as shown below: Y=0 if Y*< ξ
Y=1 if ξ<Y*< ζ (3)
Y=2 if Y*> ζ
Where Y* is the latent variable that conditions the decision to adopt direct selling (Y).
As stated previously, farms specializing in field crops, market gardening, wine-growing, fruit production, sheep and goat breeding as well as cattle breeding are those which are most likely to adopt the practice of direct selling. Thus, we consider seven different models: the first is general and encompasses all French professional farms, while the other models consider each specialization separately. It should be noted that, to avoid endogeneity problems, financial variables are lagged by one year. Similarly, potential size effects are neutralized for financial variables, e.g. the amounts in euros are divided by total farm sales.
4
Results
In this section, we present the results of the descriptive statistics and the econometric model which enable us to understand the choice of direct selling. We therefore distinguish farms committed to direct selling from other concerns according to their specialization.
4.1 Descriptive statistics
Farms adopting direct selling are different in terms of physical size since their usable agricultural area is, on average, smaller than farms that do no adopt such marketing strategy. We also observe that the higher the degree of implication on direct selling and the smaller the physical size of the farm (Table 2).
Table 2. Farm characteristics according to the marketing channel
Farmers who sold at the retail level in 2014 declared a higher value of sales than other farms. The explanation may lie in the fact that farmers involved in short food supply chains have the ability to determine selling prices by themselves. Moreover, farmers who sold at the retail level receive significantly fewer subsidies than those who sell their entire production through another channel. Beyond the level of activity of the farm, the literature points to skills as a key element. We note that farmers who sold at the retail level are younger and benefit from a higher level of education, both in terms of agricultural and general education. These elements support the literature, which asserts that younger and better-educated farmers are more likely to diversify their marketing channels.
A key factor motivating farmers to sell all or part of their produce at the retail level is the workforce present on the farm. In fact, direct selling requires additional labour because of the various skills needed at the different stages of the productive process, e.g. production, processing and marketing. Consequently, the global need for skilled labour is higher and this workforce must be more skilled regarding the higher level of wage costs on farms that sell at the retail level.
Direct selling requires fewer investments, but this is compensated with higher current assets. Moreover, concerned farmers need to provide a larger product range, which results in increased stocks to meet demand. Consequently, the working capital requirement of their farm is significantly higher. This last indicator is quite doubled compared to farms that did not practice direct selling. Such a stock level requires consistent financing, which is not offset by the fact that customers paid for their purchases in cash.
We notice actually a significantly higher return on capital employed, which is a sign of profitability. Moreover, farms adopting direct selling benefit from slightly higher working capital, self-financing and cash-flow levels compared to farms not involved in this marketing channel. These results seem to indicate that financial profitability may be a source of motivation to adopt direct selling. Retailing farms do not get more indebted compared to other farms and they paid for the same amount of interests on average. Direct selling is therefore not associated to a higher financial risk. Because they are associated with higher investment, products sold at the retail level have to be covered upstream at the time of production. However, the profile of retailing farmers denotes an orientation towards risk. Firstly, they seem to decrease their insurance. Secondly, they use a significantly smaller quantity of fertilizers and pesticides. These are in line with the image of quality associated with direct selling.
Finally, farmers who sold at the retail level demonstrate a lower degree of produce diversification within their main production. Nevertheless, they can provide a range of products to consumers. Because the FADN database focuses only on farm entities considered as profit centres, we were not able to consider multi-activity in this analysis.
4.2 Econometric models
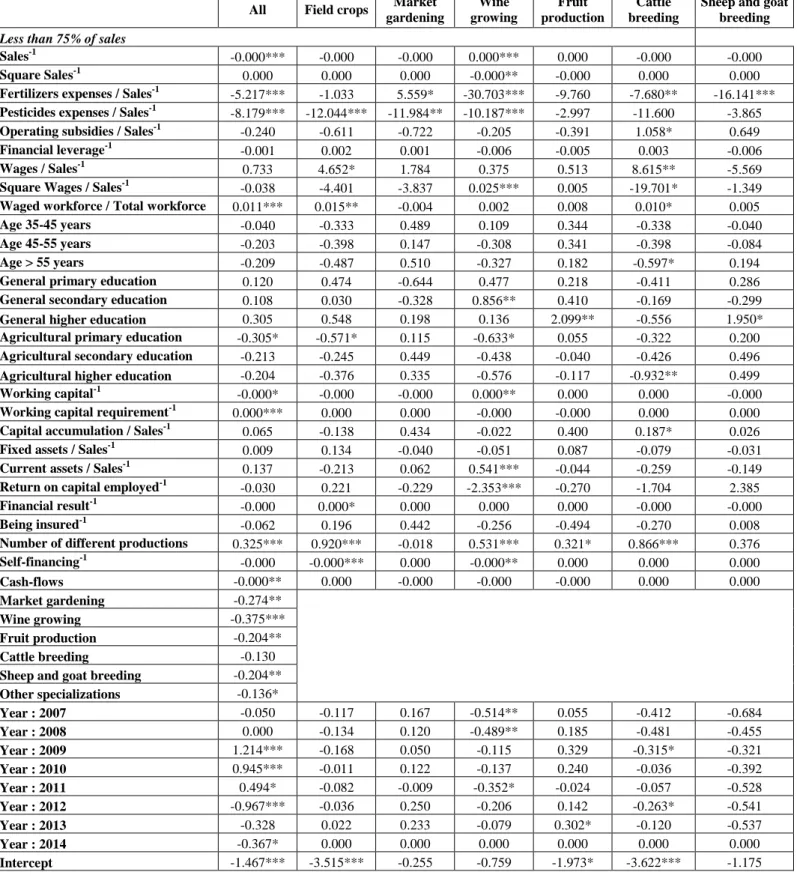
We complement these descriptive statistics by econometric models that explain the adoption of direct selling practices considering the main kinds of variables exposed earlier. The results are presented in Table 3.
Before considering the main specializations, the global model highlights two main results. The first one is the existence of some specificity among specializations in terms of marketing strategy. The probability of selling at the retail level is greater for farms specializing in market gardening, wine-growing and fruit production, while lesser for farms specializing on cattle breeding, compared to farms specializing on field crops (the reference). The second one is that the degree of involvement in direct selling (percentage of sales) does not fundamentally change the nature and the extent of the results. Once adopted, direct selling leads to the adoption of a specific pattern.
Table 3. Econometric models explaining direct selling
In terms of the level of activity, it appears that the value of sales is an important decisive factor for the adoption of direct selling. For small wine-growing farms, an increase in sales influences positively the choice of retailing, while this opposite is true for the whole population of farms and some specializations. However, for the latter, larger farms are more incited to adopt direct selling. Furthermore, we find that direct selling is negatively conditioned by the level of operating subsidies for the whole population of farms. These subsidies help producers to intensify their production to the detriment of the diversification of their marketing channels. Such financial incentives therefore appear insufficient to justify the adoption of direct selling.
The study of the farmers’ skills reveals that their age is generally not decisive in the choice to sell any part of their production at the retail level. The level of agricultural and general education does not seem to be relevant either. The relative weight of the waged workforce in the total workforce has a contrasted influence on the decision to sell at the retail level.
The study of the financial situation of farms shows that, for all professional farms, the working capital and the working capital requirement respectively play a significant negative and positive role in the adoption of direct selling. For some specializations, capital accumulation leads to increased likelihood to adopt direct selling. This result suggests that farms which reinforce their productive activity diversify at the same time their marketing channels. Finally, we note that fixed assets do not determine the adoption of direct selling. In summary, retailing farmers seem to have to find short term resources to carry out their marketing and sales activities.
Except for farms specializing in field crops and wine-growing, the model highlights that the return on capital employed has no impact on retailing. This result demonstrates that farmers that adopt direct selling are not specially motivated by a higher level of returns. Except for field crops, the indebtedness level and interest paid do not influence the choice of a marketing channel. Self-financing, however, has a negative influence on retailing within field crops and wine-growing sectors, and a positive influence for sheep and goat breeding. The ability to use internal resources provides farmers a disincentive to diversify their marketing channels for the former while is the opposite for the latter.
Our analysis ends with the study of the means used by farmers to cover their operational risk. Irrespective of the production, subscribing crop insurance policies has generally no impact on the farmer’s marketing strategy. Conversely, most models highlight the fact that a more intensive use of pesticides and fertilizers leads to a lower probability of selling at the retail level. This very significant result confirms the image of quality associated with products sold using short food supply chains. Retailing producers are more diversified than farmers who sell through traditional channels because they have to meet consumer demand in terms of the variety of products.
5
Conclusion
In this article, we have proposed a study of economic and financial factors encouraging farmers to sell their production at the retail level. This analysis is intended to complement a literature that traditionally focuses on the analysis of the individual or structural determinants leading farms to practice direct selling. Moreover, with FADN data we considered the main sectors in which farmers are most commonly engaged in direct selling.
One salient result of this study is to highlight key features of French farms and farmers practicing direct selling, despite differences in production. In general, these farmers appear to operate on smaller farms, and this small size is an incentive to adopt such marketing channel. Retailing implies the mobilization of a set of human (labour) and financial resources (working capital requirement and current assets) in order to face the short-term challenges of this marketing channel. These farms are then able to offer an increased variety of products to meet the consumers' expectations. Such diversification is indeed a strong prerequisite to direct selling. By contrast, retailing farms do not need a large amount of fixed assets to operate, which results is a lightweight financial and operating structure.
This comprehensive knowledge of direct selling allows us to discuss the implications in terms of public policy. Our analysis underlines that farmers practicing direct selling are more respectful of the environment, which results in reduced consumption of chemical inputs (fertilizers and pesticides) for almost all the productions considered. It therefore appears relevant for a farmer to adopt direct selling with an ecological objective, and vice versa.
Future research should confirm these results by studying in more detail the dynamics of direct selling. We could notice that many farms belonging to our database have adopted direct selling for years. Given the aspects, an interesting question would be to understand if this adoption is temporary or permanent, and in all cases which kinds of producing patterns are adopted.
6
References
Agreste Primeur (2012). Un agriculteur sur cinq vend en circuit court, 276.
Ahearn, M. and Sterns, J. (2013). Direct-to-Consumer Sales of Farm Products: Producers and Supply Chains in the Southeast. Journal of Agricultural and Applied Economics, 45: 497-508.
Aubert, M. and Enjolras, G. (2016). Do short food supply chains go hand in hand with environment-friendly practices? An analysis of French farms. International Journal of Agricultural Resources, Governance and
Ecology, 12 (2): 189-213.
Aubert, M. and Perrier-Cornet, P. (2012). La diversification des activités dans les exploitations viticoles françaises? Economies & Sociétés, 10-11: 1969-1996.
Blanquart, C., Gonçalves, A., Kebir, L., Petit, C., Traversac, J.-B. and Vandenbossche, L. (2010). The
Logistic leverages of short food supply chains performance in terms of sustainability. Paper presented at the
12th WCTR Conference, July 11–15, Lisbon, Portugal.
Chiffoleau, Y., Gauche, A. and Ollivier, D. (2013). Impacts sociaux des circuits courts alimentaires sur les
exploitations agricoles. Centre d’Etudes et de Ressources sur la Diversification.
Conner, D., Colasanti, K., Ross, R.B. and Smalley, S.B. (2010). Locally Grown Foods and Farmers Markets: Consumer Attitudes and Behaviors. Sustainability, 2 (3): 742-756.
Detre, J.T., Mark, B., Mishra, A.K. and Adhikari, A. (2011). Linkage between Direct Marketing and Farm Income: Double Hurdle Approach. Agribusiness: an International Journal, 27 (1): 19-23.
DRAAF Limousin (2012). Légumes: la vente en circuit court peut encore se développer. Agreste Limousin, 77
Enjolras, G., and Sentis, P. (2011). Crop insurance policies and purchases in France. Agricultural
Economics, 42 (4): 475-486.
Enjolras, G., Capitanio, F., Aubert, M. and Adinolfi, F. (2014). Direct payments, crop insurance and the volatility of farm income. Some evidence in France and in Italy. New Medit, 13 (1): 31-40.
Eurostat (2015), Agriculture, forestry and fishery statistics, 2014 edition. Available at: http://ec.europa.eu/eurostat/web/ess/-/agriculture-forestry-and-fishery-statistics-2014-edition
Feenstra, G.W., Lewis, C.C., Hinrichs, C.C., Gillespie Jr., G.W. and Hilchey, D. (2003). Entrepreneurial outcomes and enterprise size in U.S. retail farmers markets. American Journal of Alternative Agriculture, 18: 46-55.
Goodman, D., DuPuis, E.M. and Goodman, M.K. (2012). Alternative food networks: knowledge, practice
and politics. Abingdon: Routledge.
Kneafsey, M., Venn, L., Schmutz, U., Balázs, B., Trenchard, L., Eyden-Wood, T., Bos, E., Sutton, G. and Blackett, M. (2013). Short Food Supply Chains and Local Food Systems in the EU. A State of Play of their
Socio-Economic Characteristics. JRC Report 25911.
Lanciano, E. and Saleilles, S. (2010). Le développement des circuits courts alimentaires : un nouveau souffle
entrepreneurial dans l’agriculture ? Paper presented at the Congrès international francophone sur
l'entrepreneuriat et la PME, September 27, Bordeaux, France.
Martinez, S., Hand, M., Da Pra, M., Pollack, S., Ralston, K., Smith, T., Vogel, S., Clark, S., Lohr, L., Low, S. and Newman, C. (2010). Local Food Systems: Concepts, Impacts, and Issues. ERS Report Summary, U.S. Department of Agriculture.
Penrose, E. (1959). The Theory of Growth of the Firm. New York: John Wiley.
Praly, C. (2010). Nouvelles formes de valorisation territoriale en agriculture, le cas de l'arboriculture de la
Moyenne Vallée du Rhône. Phd Dissertation, University of Lyon 2.
Traversac, J., Rousset, S. and Perrier-Cornet, P. (2011). Farm resources, transaction costs and forward integration in agriculture: Evidence from French wine producers. Food Policy, 36: 839-847.
Verhaegen, I. and Van Huylenbroeck, G. (2001). Costs and benefits for farmers participating in innovative marketing channels for quality food products. Journal of Rural Studies, 17 (4): 443-456.
7
Appendix
Table 1. Distribution of farms according to the marketing channel in 2014
Field crops Market gardening Wine growing Fruit production Sheep and goat breeding Cattle breeding Other specializations All professional farms No direct selling 93,72% 46,36% 50,36% 65,36% 75,08% 92,44% 85,20% 81,62% Direct Selling 6,28% 53,64% 49,64% 34,64% 24,92% 7,56% 14,80% 18,38% < 75% of sales 5,69% 25,15% 32,21% 18,16% 13,89% 6,89% 11,62% 12,69% > 75% of sales 0,60% 28,49% 17,42% 16,48% 11,03% 0,66% 3,19% 5,69% Source: FADN 2014.
Table 2. Farm characteristics according to the marketing channel
Source: FADN 2006-2014.
Keys: The null hypothesis considers equality of means between the population and the reference “No direct selling”. Means are significantly different at the 10% (*), 5% (**) and 1% (***) thresholds.
No direct selling
Direct selling
Less than 75 % More than 75 %
Values Test of equality of means Values Test of equality of means
Usable Agricultural Area 97.10 63.85 *** 31.35 ***
Sales 197 864.00 241 478.00 *** 247 877.00 **
Operating subsidies / Sales 0.28 0.17 *** 0.11 ***
Wages / Sales 0.13 0.18 *** 0.22 ***
Waged workforce / Total workforce (%) 12.46 28.94 *** 35.77 ***
Total workforce 1.87 2.87 *** 3.50 ***
Financial leverage (%) 41.29 40.85 ns 44.65 ns
Working capital -1 391.96 1 064.74 ns 10 048.70 **
Working capital requirement 89 750.40 181 251.00 *** 193 275.00 ***
Capital accumulation -1735.31 2905.27 * 5854.66 *
Fixed assets 271389.20 2665680.10 ns 227730.10 **
Current assets 155407.70 265808.60 *** 306852.00 ***
Return on capital employed 0.11 0.13 ns 0.16 ***
Financial result -4 247.72 -4 839.07 * -4 390.06 ns
Self-financing 26 906.90 30 050.10 ns 32 730.40 ns
Cash-flows 67 471.20 75 664.60 ** 78 047.70 ns
Be insured 0.52 0.44 *** 0.34 ***
Fertilizer expenses / Sales 0.09 0.04 *** 0.02 ***
Pesticide expenses / Sales 0.07 0.04 *** 0.03 ***
Table 3. Econometric models explaining direct selling
All Field crops
Market gardening Wine growing Fruit production Cattle breeding
Sheep and goat breeding
Less than 75% of sales
Sales-1 -0.000*** -0.000 -0.000 0.000*** 0.000 -0.000 -0.000
Square Sales-1 0.000 0.000 0.000 -0.000** -0.000 0.000 0.000
Fertilizers expenses / Sales-1 -5.217*** -1.033 5.559* -30.703*** -9.760 -7.680** -16.141***
Pesticides expenses / Sales-1 -8.179*** -12.044*** -11.984** -10.187*** -2.997 -11.600 -3.865
Operating subsidies / Sales-1 -0.240 -0.611 -0.722 -0.205 -0.391 1.058* 0.649
Financial leverage-1 -0.001 0.002 0.001 -0.006 -0.005 0.003 -0.006
Wages / Sales-1 0.733 4.652* 1.784 0.375 0.513 8.615** -5.569
Square Wages / Sales-1 -0.038 -4.401 -3.837 0.025*** 0.005 -19.701* -1.349
Waged workforce / Total workforce 0.011*** 0.015** -0.004 0.002 0.008 0.010* 0.005
Age 35-45 years -0.040 -0.333 0.489 0.109 0.344 -0.338 -0.040
Age 45-55 years -0.203 -0.398 0.147 -0.308 0.341 -0.398 -0.084
Age > 55 years -0.209 -0.487 0.510 -0.327 0.182 -0.597* 0.194
General primary education 0.120 0.474 -0.644 0.477 0.218 -0.411 0.286
General secondary education 0.108 0.030 -0.328 0.856** 0.410 -0.169 -0.299
General higher education 0.305 0.548 0.198 0.136 2.099** -0.556 1.950*
Agricultural primary education -0.305* -0.571* 0.115 -0.633* 0.055 -0.322 0.200
Agricultural secondary education -0.213 -0.245 0.449 -0.438 -0.040 -0.426 0.496
Agricultural higher education -0.204 -0.376 0.335 -0.576 -0.117 -0.932** 0.499
Working capital-1
-0.000* -0.000 -0.000 0.000** 0.000 0.000 -0.000
Working capital requirement-1 0.000*** 0.000 0.000 -0.000 -0.000 0.000 0.000
Capital accumulation / Sales-1 0.065 -0.138 0.434 -0.022 0.400 0.187* 0.026
Fixed assets / Sales-1 0.009 0.134 -0.040 -0.051 0.087 -0.079 -0.031
Current assets / Sales-1
0.137 -0.213 0.062 0.541*** -0.044 -0.259 -0.149
Return on capital employed-1 -0.030 0.221 -0.229 -2.353*** -0.270 -1.704 2.385
Financial result-1 -0.000 0.000* 0.000 0.000 0.000 -0.000 -0.000
Being insured-1 -0.062 0.196 0.442 -0.256 -0.494 -0.270 0.008
Number of different productions 0.325*** 0.920*** -0.018 0.531*** 0.321* 0.866*** 0.376
Self-financing-1 -0.000 -0.000*** 0.000 -0.000** 0.000 0.000 0.000 Cash-flows -0.000** 0.000 -0.000 -0.000 -0.000 0.000 0.000 Market gardening -0.274** Wine growing -0.375*** Fruit production -0.204** Cattle breeding -0.130
Sheep and goat breeding -0.204**
Other specializations -0.136* Year : 2007 -0.050 -0.117 0.167 -0.514** 0.055 -0.412 -0.684 Year : 2008 0.000 -0.134 0.120 -0.489** 0.185 -0.481 -0.455 Year : 2009 1.214*** -0.168 0.050 -0.115 0.329 -0.315* -0.321 Year : 2010 0.945*** -0.011 0.122 -0.137 0.240 -0.036 -0.392 Year : 2011 0.494* -0.082 -0.009 -0.352* -0.024 -0.057 -0.528 Year : 2012 -0.967*** -0.036 0.250 -0.206 0.142 -0.263* -0.541 Year : 2013 -0.328 0.022 0.233 -0.079 0.302* -0.120 -0.537 Year : 2014 -0.367* 0.000 0.000 0.000 0.000 0.000 0.000 Intercept -1.467*** -3.515*** -0.255 -0.759 -1.973* -3.622*** -1.175 Source: FADN 2006-2014.
All Field crops Market gardening Wine growing Fruit production Cattle breeding Sheep and goat breeding
More than 75% of sales
Sales-1 -0.000** -0.000 -0.000 0.000*** -0.000 -0.000 -0.000*
Square Sales-1 0.000** 0.000 0.000 -0.000 0.000 0.000 0.000
Fertilizers expenses / Sales-1
-10.163** -1.905 7.692* -41.051*** -24.061*** -9.132 2.753
Pesticides expenses / Sales-1 -14.229** -15.173* -29.116*** -18.692*** -2.090 -12.563 -84.486*
Operating subsidies / Sales-1 -0.420 -0.651 -2.550 1.064 -2.012 1.509** -0.854
Financial leverage-1 -0.001 -0.021* -0.005 0.004 0.002 -0.025 -0.011
Wages / Sales-1 1.563 1.396 5.740 -1.671** -1.079 13.649* 18.795***
Square Wages / Sales-1 -0.078 -4.049 -7.763* 0.058*** 0.034 -21.566 -29.694***
Waged workforce / Total workforce 0.009* 0.023* -0.010 0.008 -0.004 0.004 0.035**
Age 35-45 years 0.164 -0.649 0.272 0.097 1.588* 0.255 1.518*
Age 45-55 years -0.004 -0.743 -0.156 -0.024 0.803 0.734 1.390
Age > 55 years 0.048 -1.509* 0.070 -0.106 0.936 0.528 1.576
General primary education 0.015 -0.058 0.654 0.455 1.132 -0.629 -1.140
General secondary education -0.206 -0.028 0.167 1.124** 1.376 -0.392 -2.895**
General higher education 0.342 0.133 0.748 1.080 0.861 -0.053 -0.604
Agricultural primary education 0.069 -0.116 0.506 -0.235 -0.885 0.592 0.564
Agricultural secondary education 0.602 0.198 0.753 0.109 -0.889 0.306 2.152**
Agricultural higher education 0.501 0.313 0.468 -0.399 0.948 0.622 2.314**
Working capital-1 -0.000*** 0.000** -0.000 0.000 -0.000 0.000 -0.000
Working capital requirement-1 0.000*** -0.000 -0.000 -0.000** 0.000 -0.000* 0.000
Capital accumulation-1 -0.114 0.563** 0.766* -0.076 -0.492 0.402** 0.171
Fixed assets / Sales-1 0.050 -0.167 -0.108 0.027 0.329 -0.203 -0.223
Current assets / Sales-1
0.028 -1.469** -0.447 0.829*** -0.432 -0.769 -2.161***
Return on capital employed-1 0.508 0.768* 0.082 -1.043 -0.730 -2.708 -1.136
Financial result-1 -0.000 0.000 -0.000 0.000 -0.000 -0.000 0.000
Being insured-1 -0.037 -0.202 0.545 -0.008 0.409 0.255 -1.979*
Number of different productions -0.013 0.666* -0.234 0.672*** 0.263 0.549 -0.321*
Self-financing-1 -0.000 -0.000* -0.000 -0.000** -0.000 0.000 0.000*** Cash-flows -0.000 -0.000 -0.000 -0.000 0.000 -0.000 0.000 Market gardening 0.046 Wine growing -0.091 Fruit production -0.076 Cattle breeding 0.013
Sheep and goat breeding -0.178*
Other specializations -0.127* Year : 2007 -0.158*** 1.113* -0.037 -0.326 -0.517 0.267 0.940 Year : 2008 0.000 0.083 0.054 -0.186 -0.813* 0.561 0.303 Year : 2009 1.661*** -0.332 -0.239 0.052 -0.506 0.469 -0.174 Year : 2010 1.207*** -0.341 0.081 0.265 -0.294 0.384 0.134 Year : 2011 0.889* -0.511 0.127 -0.121 -0.782** 0.000 -0.034 Year : 2012 -2.024*** -0.580* 0.124 -0.187 -0.423 -0.461 0.389 Year : 2013 0.824 -0.311 -0.024 -0.195* -0.220 -0.250 0.144 Year : 2014 -0.100 0.000 0.000 0.000 0.000 0.000 0.000 Intercept -2.211*** -0.754 -0.418 -3.149*** -1.664 -5.666*** -0.081 Source: FADN 2006-2014.
Figure 1. Dynamics of direct selling according to the economic and technical orientation
Source: FADN 2006-2014.
Figure 2. Distribution of farms which adopted direct selling in 2014
Source: FADN 2006-2014. 0% 10% 20% 30% 40% 50% 60% 2006 2007 2008 2009 2010 2011 2012 2013 2014 Field crops
Market gardening and horticulture
Wine-growing Fruit production Cattle
Sheep and goat breeding Other specializations Field crops 8% Market gardening 10% Wine growing 40% Fruit production 5% Sheep and goat
breeding 9% Cattle breeding 12% Other specializations 16%