HAL Id: hal-00825870
https://hal-mines-paristech.archives-ouvertes.fr/hal-00825870
Submitted on 24 May 2013HAL is a multi-disciplinary open access
archive for the deposit and dissemination of sci-entific research documents, whether they are pub-lished or not. The documents may come from teaching and research institutions in France or abroad, or from public or private research centers.
L’archive ouverte pluridisciplinaire HAL, est destinée au dépôt et à la diffusion de documents scientifiques de niveau recherche, publiés ou non, émanant des établissements d’enseignement et de recherche français ou étrangers, des laboratoires publics ou privés.
Carsten Hoyer-Klick, Mireille Lefèvre, Armel Oumbe, Marion Schroedter
Homscheidt, Lucien Wald
To cite this version:
Carsten Hoyer-Klick, Mireille Lefèvre, Armel Oumbe, Marion Schroedter Homscheidt, Lucien Wald. User’s Guide to the SoDa and SOLEMI Services. 2010. �hal-00825870�
Project MACC “monitoring atmosphere composition & climate”
Sub-project RAD “radiation”
Grant Agreement no. 218793
USER’S GUIDE TO THE SODA AND
SOLEMI SERVICES
Towards the “solar energy radiation resources
MACC-RAD Service”
Deliverables D_R-RAD_2.2_1 and _2, version V1.0
Authors: C. Hoyer-Klick, M. Lefèvre, A. Oumbe,
Version history
Version Date Authors Description of changes
Executive Summary
The European Earth observation programme GMES (Global Monitoring for Environment and Security) aims at providing environmental information to support policymakers, public authorities and both public and commercial users. A systematic monitoring and forecasting of the state of the Earth's subsystems is currently under development. Six thematic areas are developed: marine, land, atmosphere, emergency, security and climate change. A land monitoring service, a marine monitoring service and an atmosphere monitoring service will contribute directly to the monitoring of climate change and to the assessment of mitigation and adaptation policies. Additional GMES services will address respectively emergency response and security-related aspects.
The pre-operational atmosphere service of GMES is currently provided through the FP7 project MACC (Monitoring Atmospheric Composition and Climate). MACC combines state-of-the-art atmospheric modelling with Earth observation data to provide information services covering European Air Quality, Global Atmospheric Composition, Climate, and UV and Solar Energy.
Within the radiation subproject (MACC-RAD) existing historical and daily updated databases for monitoring incoming surface solar irradiance are further developed. The service will meet the needs of European and national policy development and the requirements of (commercial) downstream services (e.g. planning, monitoring, efficiency improvements, integration into energy supply grids). The SOLEMI service (operated by MACC partner DLR) and the SoDa service (operated by MACC partner ARMINES and its subsidiary Transvalor) have been specifically developed in several national, European and ESA projects to fulfil the requirements for long-term databases and NRT services.
On its transition process from the precursor services SoDa and SOLEMI the following User’s Guide intends to summarize existing knowledge, which has been published only in a scattered manner.
Part A ‘Users’ Expectations’ describes the communities of users, their expectations and gives an overview of the compliance of the MACC RAD service with those.
In Part B ‘Creating Databases’, the current databases HelioClim and SOLEMI as well as the methods used to convert satellite images into solar surface irradiance are presented. The quality of the retrieved irradiances is discussed. An overview of the operations and workflow is presented for the creation, updating and monitoring of these databases.
Part C ‘Delivering products’ is devoted to the supply of products. The core products are defined. The future MACC-RAD Service is described and a prototype is presented.
It is intended to update this User’s Guide regularly following the realisation of the MACC RAD service line.
Table of Contents
1. Introduction ... 9
1.1. Objectives of the document ... 10
1.2. Precursor services ... 10
1.3. Acronyms and definitions... 11
PART A. USERS’ EXPECTATIONS ... 13
2. Communities of users ... 15
3. Users’ expectations... 19
3.1. Data ... 20
3.2. Metadata and ancillary information... 22
3.3. Access to data ... 23
3.4. Documentation... 24
3.5. Quality of service ... 24
3.6. Monitoring quality... 25
4. Answering the expectations ... 26
4.1. Data ... 26
4.2. Metadata and ancillary information... 28
4.3. Access to data ... 29
4.4. Documentation... 30
4.5. Quality of service ... 30
4.6. Monitoring quality... 31
PART B. CREATING DATABASES ... 33
5. The databases HelioClim and SOLEMI ... 35
6. Brief description of the method converting satellite images into surface solar irradiance ... 37
6.1. History of the Heliosat methods... 37
6.2. Overview of the method Heliosat-2... 39
6.3. Inputs to the clear-sky models ... 40
6.4. Brief description of the clear-sky models ... 45
7. The quality of the retrieved irradiances ... 49
7.1. Principles. Comparisons. Limitations... 49
7.2. Measures of performance... 50
7.3. Typical performances of existing services SoDa and SOLEMI ... 55
7.4. Known problems ... 56
8. Overview of the operation chains (workflow) in the present services SoDa and SOLEMI ... 63 8.1. Overview of the workflow in the SoDa Service for producing
9. Transition towards the future operation chain in MACC-RAD... 69
9.1. Improvements and changes in the current methods and workflows... 69
9.2. Overview of the new method Heliosat-4 ... 70
9.3. Overview of the workflow in the future chain ... 70
9.4. Quality control of products ... 72
PART C. DELIVERING PRODUCTS ... 73
10. Core products ... 75
10.1. Main features of the core products. Geographical and temporal coverage ... 75
10.2. List of products ... 76
10.3. How to make a request for a MACC product ... 77
10.4. Delivery deadline ... 77
10.5. Data policy. Conditions of use ... 78
10.6. Format of products... 78
10.7. Maps ... 81
11. Description of the future MACC-RAD Service... 83
11.1. Introduction to collaborative information systems and web services ... 83
11.2. The MACC-RAD Service and the SoDa Service ... 85
11.3. The middleware and related tools... 86
11.4. Using the prototype of the information system ... 90
11.5. Conclusion ... 93
1. Introduction
The MACC (Monitoring Atmospheric Composition and Climate) project is designed to meet the requirements that have been expressed for the pilot GMES Atmospheric Core Service. The project has been prepared by the consortia of the EC-FP6 project GEMS and the ESA-GSE project PROMOTE, whose core service lines will provide the starting point for MACC. From mid-2009 MACC will continue, improve, extend, integrate and validate these service lines, so that the overall MACC system is ready near the end of 2011 for qualification as the operational GMES Atmospheric Core Service. MACC will prepare the core service in terms of implementation, sustained operation and availability. It will maintain and further develop the efficiency and resilience of the end-to-end pre-operational system, and will refine the scientific basis and quality of the products of the system. It will ensure that its service lines best meet both the requirements of downstream service providers and end users at the European, national and local levels, and the requirements of the global scientific user community.
The service lines will cover air quality, climate forcing, stratospheric ozone and solar radiation. MACC will deliver operational products and information that support the establishment and implementation of European policy and wider international programmes. It will acquire and assimilate observational data to provide sustained real-time and retrospective global monitoring of greenhouse gases, aerosols and reactive gases such as troposphere ozone and nitrogen dioxide. It will provide daily global forecasts of atmospheric composition, detailed air-quality forecasts and assessments for Europe, and key information on long range transport of atmospheric pollutants. It will provide comprehensive web-based graphical products and gridded data on which downstream services may be based. Feedback will be given to space agencies and providers of in-situ data on the quality of their data and on future observational requirements.
One of the core services in MACC will provide radiation values at the ground level, which will fulfil the needs in European and national policy developments and the requirements of partly commercial downstream services, e.g., for planning, monitoring, efficiency improvements, and the integration of solar energy systems into energy supply grids.
To do so, several data originating from various sources are assembled. Many of them describe the optical state of the atmosphere, e.g., aerosol optical properties, water vapour and ozone contents over the atmospheric column. Others depict the ground properties, e.g., ground albedo, ground elevation.
These data are inputs to a model that simulates the scattering and absorption phenomena occurring in the atmosphere and affecting the solar radiation in its way downwards to the ground. The outputs of this model are values of the solar radiation available at ground level that can be used to produce energy, either as heat or electricity.
1.1. Objectives of the document
For the sake of simplicity, we denote by “MACC-RAD Service” the future service within the GAS (GMES Atmospheric Service) that will deliver core products on solar energy radiation resources.
The objectives of this document are to do document and specify this MACC-RAD Service as well as the user-access procedures to the products delivered by this service.
Actually, such a service is an information system composed of two major blocks. One is made of databases, processing chains, daily operations, methods, input data, control and monitoring of operations and quality of products. The other deals with the dissemination of the products, the means of access, control of dissemination and quality of service.
This report will document both blocks. As a service aims at satisfying needs of its users, the specifications of this service must be built on the description of the users expectations on products and delivery, and therefore of their profiles. The first part of this document (Part A) is therefore the description of the users and their expectations. Part B deals with the description of the databases, of the algorithms, of the operations towards the creation / update of the databases, validation process, monitoring. Part C deals with the delivery of products.
This document intends to be a living one. It will evolve as the service and its components themselves evolve in the transition process from the precursor services to the MACC-RAD Service.
1.2. Precursor
services
Before proceeding, it is worth mentioning two precursor services which are the foundations of the MACC-RAD Service: the SoDa Service and SOLEMI Service, that are presently fully operational and managed by Armines and DLR. There is a variety of documentation, validation and user information available for both services – either from standard operations, from recent project related work or from international benchmarking exercises. Therefore, another objective of this user’s guide is to combine and summarize this scattered information.
The SoDa Service originates from a EC-funded project (IST, 200-2003); it turned operational in 2003. Its number of customers increases regularly. From 400 users in 2003, it reached 42 000 users in 2009, and answered approximately 400 000 requests for data in 2009. The
SoDa Service is actually a portal and more exactly a collaborative information system. This means that by connecting to the SoDa Service, the user can access several services offered by several providers in a transparent and homogeneous manner. A service can be a data set, a database or an application. There are presently eleven providers for approximately 60 services. The SoDa Service is formally a means for disseminating knowledge. However, it is becoming so popular that its users often confuse the services offered by the SoDa Service into a single name: SoDa. Behind the SoDa Service, and among the various services offered, a major service is the access to the databases HelioClim of solar radiation at ground level. These databases, HelioClim-1 and -3, are created and managed by Armines. A routine exploitation of Meteosat images received by Armines provides 15-min values of radiation that are stored in the databases. Control of operations is performed automatically. Quality of products is checked regularly. In 2006, access to the most recent parts of the HelioClim database became for-pay. There is a few tens of customers for-pay of the SoDa Service. They are companies having themselves their own customers and own requirements and contingencies. The number of customers is increasing as well as their exigencies regarding the quality of service. Because Armines is a research institute, it does not have the necessary means and knowledge to handle a commercial service and to ensure and secure operations. In 2009, the company Transvalor, a daughter company of Armines, took over the control of the SoDa Service in order to enhance the safety in provision of data and to better handle customers. Presently, the operational processing chain converting Meteosat images into radiation values is implemented at Transvalor’s premises to increase reliability in the timely provision of radiation data to customers, while the chain at Armines is now efficiently working as a back-up.
The SOLEMI Service has various properties that differ from the SoDa Service. Nevertheless, it is similar in principle to SoDa in the sense that it is a service: there is one series of actions to construct the database SOLEMI and a series of actions to exploit it for the benefit of customers. The properties of the database SOLEMI are described in the following pages. A series of efforts is underway to ease the access to the database, another series deals with the increase in quality of the irradiation values. The customers of the SOLEMI Service request more studies while SoDa customers require more irradiation data. Therefore, there is no need for the SOLEMI Service to offer access via the web like the SoDa Service. However, a service delivering part of the SOLEMI database has been developed by DLR and exposed in the prototype of the second generation of the SoDa Service (project.mesor.net).
For the sake of simplicity, this document treats both SOLEMI and SoDa Services in the same way, as if both were a collaborative information system.
One may see the SOLEMI and SoDA Services as concurrent services. This is true in many aspects. However, Armines and DLR share the same objective: performing research to open-up opportunities for companies. Armines and DLR are not competing on market grounds and have signed a legal agreement in 2008, binding Armines, DLR and Transvalor for the sales of next generation radiation products. This agreement is one of the essential pillars of the proposed MACC-RAD Service.
1.3. Acronyms and definitions
DirHI Direct Irradiance, or Irradiation. Part of the radiation that is received from the direction of the sun on a horizontal plane.
GAS GMES Atmospheric Service
GHI Global Horizontal Irradiance, or Irradiation. The radiation that is received by a horizontal plane from all directions.
HelioClim A set of databases on solar radiation available at ground level, created by Armines from Meteosat images. HelioClim-1 covers the period 1985-2005, HelioClim-3 starts in 2004 and is on-going.
Heliosat Name of a family of methods to convert images acquired by meteorological geostationary satellites into images of solar radiation available at ground level. For example, the data bases HelioClim-1 and -3 are constructed with the method Heliosat-2.
IEA International Energy Agency
MACC Monitoring Atmosphere Composition and Climate. An EC-funded research project to establish the GMES Atmospheric Service.
MACC-RAD A sub-project within MACC dealing with radiation. MACC-RAD
Service
The core service within the GAS that delivers core products on solar radiation at ground level.
SoDa Service A Web portal offering an one-stop access to several services (databases, applications) relating to solar radiation.
SOLEMI Solar Energy Mining. It corresponds to both method and service providing SSI. SSI Surface Solar Irradiance, also called surface downward solar irradiance, or
surface downward shortwave irradiance. It can also denotes irradiation, which is the irradiance multiplied by a duration. For example, hourly irradiation is equal to the hourly average of irradiance multiplied by 3600 s.
2. Communities of users
Who are the expected users of the MACC-RAD Service? To best design the information system, we need to know who are the users, their typology, how do they structure in communities and domains, and for which purposes they are using the SSI data.
Relationships between users and development of information systems providing SSI are long-standing ones. There are well-established communities of users such as
planners and managers of solar energy systems and power plants, architects and building engineers,
researchers in renewable energies and building engineering.
There are more and the situation is evolving. New communities of users are attracted by the availability of irradiance data, because they are new in renewable energies such as local authorities and municipalities, or they are in a new domain of activity, e.g., material weathering and ageing.
The managers of the existing information systems delivering SSI such as SOLEMI and SoDa Service and other providers are regularly performing surveys in order to better know their users and establish typologies to improve answers to needs.
Regarding the use of SSI for energy production and building engineering, several recent surveys and outcomes of international initiatives are of interest:
MESoR (Management and exploitation of solar resource knowledge), funded by the EC DG-TREN, 2007-2009 (www.mesor.org) (Hoyer-Klick et al. 2008, 2009),
EnviSolar (Environmental information services for solar energy industries), funded by the European Space Agency, 2004-2006 (www.envisolar.com) (Schroedter-Homscheidt et al. 2006),
GEOSS Energy Community of Practice (www.geoss-ecp.org),
the Energy Chapter in the 2007 GEO report The Full Picture (Schroedter-Homscheidt et al. 2007),
SWERA (Solar and wind energy resource assessment), a programme of UNEP, 2004-2008 (swera.unep.net),
IEA SHC 36. International Energy Agency, Solar Heating and Cooling Implementing Agreement, Task 36, 2005-2010 (www.iea-shc.org/task36) (Huld et al. 2008).
A first typology of users can be found from these surveys:
companies (engineering bureaus, energy producers, investors, plant managers, maintenance services and electricity grid managers),
experts (engineering bureaus, private R&D),
public research institutes (engineering bureaus, private R&D),
public authorities and other organisations supporting policy making, incentives and permit delivery at national, regional or local levels, as well as European policy makers in charge of supporting the implementation of EU policies.
The present work aims at better defining this typology of users, what are their domains of application (or discipline or field), and what are their purposes in using data. It is based on the exploitation of several recent surveys, described in Table 2.1, and of the knowledge gained in the exploitation for several years of services supplying SSI to users or in the above-mentioned projects.
Name Date Number of respondents
Comments
IEA SHC 36 2007 111 Respondents were not selected. The questionnaire was on-line on several web sites
SoDa 2005 2005 159 Respondents were not selected. The questionnaire was on-line on the Web SoDa Service
Table 2.1. List of surveys used in the present work
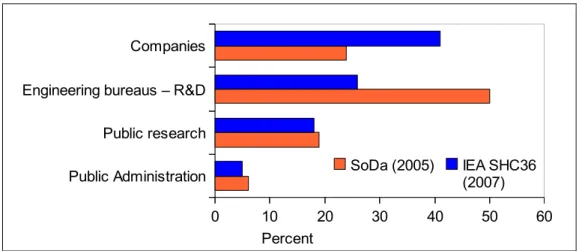
Figure 2.1 exhibits the typology of users and their relative importance as reported by SHC 36 and the SoDa Service. Questions were not exactly the same in both surveys. It is possible that several users are misplaced between “companies” and “engineering bureaus”. Nevertheless, both surveys clearly show the importance of the private sector: approximately two-thirds of the users belong to this sector.
Public Administration Public research Engineering bureaus – R&D Companies
0 10 20 30 40 50 60
SoDa (2005) IEA SHC36 (2007) Percent
Figure 2.1. Typology of users and their relative importance
There are several purposes in the use of data. Their list and their relative importance are presented in Figure 2.2. Policy-making Guarantee/certification/insurance Grid management Monitoring / maintenance Plant operation Research/education Investment decision 0 5 10 15 20 25 30 35 IEA SHC 36 (2007) Percent
Figure 2.2. List of purposes for use of SSI data and their relative importance
The most important purposes are related to the investment decision: system design, feasibility study, cost assessment, and site selection. SSI data are often used for research
and education as already shown in Figure 2.1. Plant operation and monitoring are getting more and more importance as the number of plants is increasing. Smaller solar energy systems need low cost monitoring with a performance check while large solar energy systems need detailed monitoring with automatic fault detection routines. Certification and guarantee are attractive features to customers of the energy suppliers and installers of power systems. Electric power transmission systems collect power from the conventional plants as well as from different renewable sources like solar PV plants. Two major aspects for the management of such a complex grid system to ensure the quality of the supply in electricity is an accurate forecast of the solar power generated and of the expected demand, and a good knowledge of past events and their probabilities.
Finally, policy-making has a limited importance in the request for SSI data. An increase is expected as the local authorities and municipalities are more and more orientated towards sustainability for which exploitation of renewable energy is an important issue.
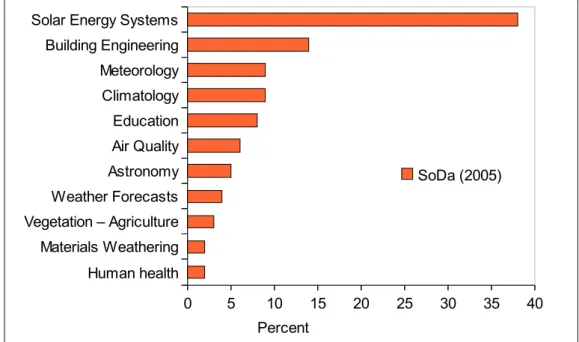
The survey made by the SoDa Service provides an insight of the various domains of activities of its users and their relative importance in the total number of requests for SSI (figure 2.3). Several answers were possible for each respondent.
Human health Materials Weathering Vegetation – Agriculture Weather Forecasts Astronomy Air Quality Education Climatology Meteorology Building Engineering Solar Energy Systems
0 5 10 15 20 25 30 35 40
SoDa (2005)
Percent
Figure 2.3. Domains of activities of the users of the SoDa Service and their relative importance
Users exploit the SoDa Service in relation with activities in production of energy (38%) and building engineering (15%). These domains represent more than half of the answers (53%). For companies, figures are much larger: production of energy (46%) and building engineering (20%). For companies, these domains represent two-thirds of the answers (66%).
The other half of answers spread themselves in meteorology and climatology (10% each), air quality (urban pollution, radiative budget), astronomy (position of the sun relative to the observer), weather forecasts (SSI, cloud cover), vegetation and agriculture (SSI, PAR), materials weathering and ageing, and human health (skin cancer, eye diseases,
users: typology and structure, are representative of what could happened with the MACC-RAD Service.
3. Users’
expectations
Users’ expectations have been assessed by several surveys and projects with respect to the parameters to be delivered and temporal and spatial resolution. A few dealt with the concept of service as a whole such as the project ENVISOLAR (Schroedter-Homscheidt et al. 2006) and those funded by the IEA (Cros, Wald 2003; Cros et al. 2004; Wald 2006).
We exploit this mass of information together with two recent relevant surveys: IEA SHC 36 and MESoR (Table 3.1). The IEA SHC 36 survey has been presented in the previous Chapter. The MESoR survey differs in several aspects. The sample of 30 respondents was selected by the MESoR consortium according to criteria of importance of data and frequency of usage as well as attitude to scientific cooperation. The surveyed organisations are active in the fields of solar energy systems and building engineering. They are located in various European countries plus the USA. The interviews by phone aimed at collecting information and evaluation about requirements, including needs for data (parameters, format, quality, resolution, etc.), service provision (coverage, availability), as well as about the attitude and interest towards the integration of the existing services into a unique point of access.
In addition, as it has been found that the usages and users of the SoDa Service are representative of what could happened with the MACC-RAD Service, we have exploited several findings on the usage of the SoDa Service in years 2008 and 2009 (Table 3.1).
Name Date Number of questionnaires
Comments
IEA SHC 36
2007 111 Users were not selected. The questionnaire was on-line on several web sites
MESoR 2008 30 Users were selected and interviewed on the phone SoDa 2008 or 2009 Based on several thousands of requests
It is not a survey filled in by users but a survey of the use of data provided by the SoDa Service during periods spanning one or more years
Table 3.1. List of surveys and findings used in the present work
The core products of the MACC-RAD Service will be exploited by commercial users to produce their own services dedicated to their own customers (downstream services). We rely on the experience gained by the present SOLEMI and SoDa Services to obtain the business-related users’ expectations.
Users expectations are treated in several categories:
data: which data are expected, which geophysical parameters,
metadata and ancillary information: which other data are useful to exploit the main data,
access to data: how can users practically access data, and which format, documentation: which documentation is expected,
quality of service: operations, help desk, customers desk, data policy, monitoring quality: scientific validation of products, quality in delivery.
3.1. Data
3.1.1. Geophysical parameters
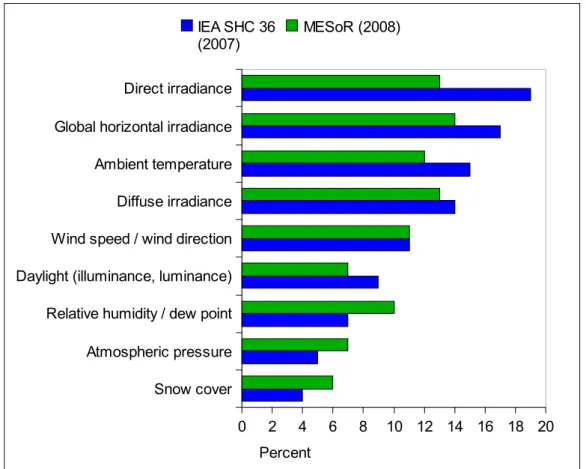
Figure 3.1 lists the geophysical parameters requested by the users and their relative importance according to the surveys IEA SHC 36 and MESoR.
Snow cover Atmospheric pressure Relative humidity / dew point Daylight (illuminance, luminance) Wind speed / wind direction Diffuse irradiance Ambient temperature Global horizontal irradiance Direct irradiance
0 2 4 6 8 10 12 14 16 18 20
IEA SHC 36
(2007) MESoR (2008)
Percent
Figure 3.1. Geophysical parameters requested and their relative importance
Results differ slightly by a few percents from one survey to another. This may be explained by the diversity in panels and by the content of the questionnaires. Nevertheless, both agree on the importance of global, direct and diffuse irradiances (GHI, DirHI, DifHI).
The demand for ambient temperature, or air temperature at 2 m height, is high. Actually, there is a request for having auxiliary meteorological data at the surface: air temperature, wind speed and direction, relative humidity and atmospheric pressure, which are coincident with irradiance data. These data are useful for computing the radiative budget of the solar energy system, thus having a more accurate assessment of the gains and therefore of the energy production. This is also true in building engineering to compute gains and losses in heat of buildings.
Unsurprisingly, users in building engineering request data in illuminance as this is the parameter used in daylighting in building.
A few users ask for snow cover. Snow may cover panels, thus reducing the energy production. It may also be confused with clouds by methods assessing the SSI from satellite images; its knowledge increases the reliability of the SSI data.
3.1.2. Spatial and temporal resolutions
According to these surveys, the spatial resolution of the data ranges clearly from 5 to 10 km, though there is marked interest for higher resolution of 1 km.
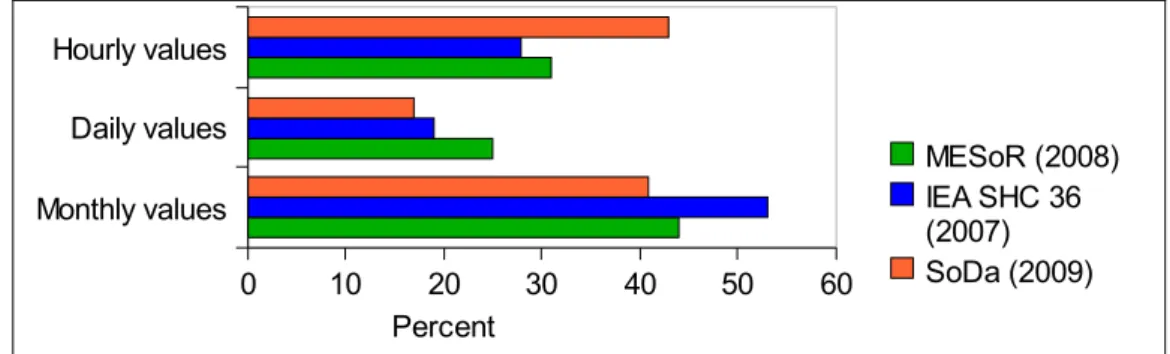
Figure 3.2 exhibits the list of temporal resolutions requested by users and their relative importance. Numbers differ slightly between both surveys but are in agreement. Both show that monthly values of SSI attract the greatest attention, followed by hourly values. The demand for daily values is the lowest.
Monthly values Daily values Hourly values 0 10 20 30 40 50 60 MESoR (2008) IEA SHC 36 (2007) SoDa (2009) Percent
Figure 3.2. Temporal resolutions requested and their relative importance
We add on this graph findings from the usage of the SoDa Service. During 2009, SSI data for the year 2005 were for free independently of the temporal resolutions. Computing the number of requests made for each resolution relative to the total number of requests provides a clear view of the most requested temporal resolutions.
The demand for daily values is small, in agreement with the surveys. For hourly and monthly values, the results are somehow conflicting. There were much more requests to hourly values than expected and slightly less for monthly values. The discrepancy between the expressed expectations and the effective behaviour of the users may be explained by the time lag between the surveys and the findings from the SoDa Service. At the time of the surveys (2007 and 2008), hourly data were not easily accessible. We believe that making them freely available in an easy manner creates a change in the usages of data.
It could be reported here that there has been an explosion of the number of requests for hourly values made to the SoDa Service in 2010 due to the increasing use of such SSI data for monitoring solar power plants.
3.1.3. Time-series or maps
Most data sources deliver data in the form of time-series. Users expressed differently in surveys when asked about their preferences for time-series of data (1 or more sites) or maps (i.e. gridded values). According to IEA SHC 36, both types seem useful to respondents. In the MESoR survey, users prefer clearly time-series to maps.
Maps or graphs Time-series (1 or more sites)
0 10 20 30 40 50 60 70 80 90 MESoR (2008) IEA SHC36 (2007) SoDa (2008) Percent
Figure 3.3. Percentage of users preferring time-series or maps
We add on this graph findings from the usage of the SoDa Service. During 2008, a mapping capability was made available for monthly values. Computing the number of requests made for maps relative to the total number of requests provides a view of the relative importance of maps. There are much more requests for time-series than for maps. Clearly, a provider of data should put priority on the capability of delivering time-series.
3.2. Metadata and ancillary information
Several pieces of additional information should be delivered with SSI data, besides the meteorological data mentioned above. These are metadata and ancillary information.
Metadata provide description of the data, e.g., date and time, geographical coverage, etc. They are necessary to exploit the data. There are two types of metadata.
One type is for discovery. It describes the data that could be delivered by a service, the list of products and how to obtain them. This type is exploited by catalogues of services and data. Examples are geographical or temporal coverage, spatial or temporal resolution, parameters. The second type is for exploitation of data by computers or not. It describes the exact content of the supplied file containing the requested data. Examples are geographical location, elevation, parameters, instants.
It is recommended to use standard metadata such as those proposed by INSPIRE, GEOSS, and ISO.
Figure 3.4 demonstrates the importance of the metadata for exploitation. It displays the percentage of users using the supplied SSI data as inputs to a simulator and more generally to an application, or using SSI data directly in their work. This percentage is large. It means that provided the metadata supplied and those understood by the application share the same format, delivering exploitation metadata should ease the workload of the users.
Direct use of data Data are inputs to a simulator
0 10 20 30 40 50 60 70
MESoR (2008)
Percent
Figure 3.4. Percentage of users using the SSI data as inputs to an application
request for having as outputs in addition to SSI the data input to the method for SSI assessment, such as aerosol properties, water and ozone column content, etc., say whether data are interpolated or not in space or time,
reliability, i.e., one or more quantities stating whether the supplied data, as a whole or individually, are reliable,
uncertainties, i.e., one or more quantities about the accuracy of the supplied data, as a whole or individually.
3.3. Access
to
data
Access to data covers several aspects: where, when, how. As a whole, users desire to access to data for anywhere and anytime; they desire to have an easy and fast access to these data whenever they want, from anywhere.
The geographical coverage requested by users depends strongly of their area of interest. For European users, emphasis is on Europe and Mediterranean basin. Ideally, the whole world should be covered.
The temporal coverage should span over several years, typically 10 or 15 recent years. Figure 3.5 displays the answers of respondents about the age of the SSI data.
Near-real-time (last hours/days) Recent (e.g. last month/last year) From older archives
0 10 20 30 40 50
IEA SHC 36 (2007) Percent
Figure 3.5. How recent should be the data
There is an equal spread of answers between archives and recent data (last month). Requests for very recent data are weak. The latter may have evolved in recent years due to the increase in monitoring activities of solar power plants, as discussed in section 3.1.
In the MESoR survey, all respondents underlined the importance of the Web as a mean to deliver information. They believed that accessing to the data by the Web makes things easier and faster, and because it would not be necessary to store information and applications in own information systems, thus reducing the burden in ICT expertise and hardware.
The Web has several advantages for users:
it could be a one-stop shop to access various data, it can be accessed anytime from anywhere,
a standard browser (e.g., Internet Explorer, or Firefox) can access the Web, the delivery of data can be instantaneous or so.
Finally, there is a large consensus in surveys about format of data. Users do not request for a specific format but do request for a standard type of file, namely text files (e.g., CSV files), or Excel-like spreadsheets. This is in line with the graph (Fig. 3.4) showing that products are further ingested into applications. As discussed earlier, these files should contain metadata describing the content of a file.
3.4. Documentation
Surveys reveal a great demand on documentation. Actually, there are several types of documentations requested:
scientific documentation, service documentation, list of products and catalogue, data policy.
The scientific documentation comprises at best, the articles that support the methods and operations used to supply the products. These articles have been published in international peer-reviewed journals and are freely available on-line.
A report may be available that describes how the contents of these articles have been exploited to produce the SSI and other data. The respondents stressed the need for clarity and transparency about the procedures and methods.
The service documentation comprises the users’ guide, describes operations, the workflow, and the various monitoring elements for quality assurance. Several procedures are described such as those used to fill gaps (spatial or temporal), or to flag and possibly remove erroneous data in temporally averaged products. The assessment of the reliability and the uncertainties of the data should be clearly depicted.
The list of products should be available, clear and comprehensive. A catalogue could be established with search capabilities.
Finally, data policy and intellectual property rights should be available and easy to read.
3.5. Quality
of
service
Users expressed concerns about the quality of service as a whole. By this, they expressed their expectations for a reliable service, working well, with no problem at all, and supplying what is expected.
Several users believe that such a service will work only if it can deliver products to users building their own services on the core products (downstream services). Accordingly, this service should work as a service to customers with customers’ desk and helpdesk. The customers’ desk deals with the commercial aspects of requests if any. The helpdesk helps in the use of the service.
The service should clearly express the means of delivery of the products and the time schedule. It should supply products in due course and punctually. If the Web is used to deliver, whether through a browser or e-mail, the delivery should be made in the moments following the order.
The SoDa Service offers capability to access data in an automated way by computers at a fixed hour every day. This capability should be offered in the MACC-RAD Service and enhanced. As several commercial applications are based on such capability, especially for monitoring solar power plants, supply of products should be safe. The Service should clearly indicate how it handles the various possible breakdowns and the ways to mitigate their consequences.
3.6. Monitoring
quality
Users expressed concerns about the means for controlling the quality of the products. More precisely, questions arise about:
the scientific quality. How it is established? What is the scientific validation of products? How often such a validation is made? How is it monitored?
the quality of the workflow, i.e., monitor the smooth running of each operation and of the chaining. How is it made and how often? What are the plans to improve the method / workflow if scientific improvements are available?
the quality of the service. How is it monitored and how often? How does it include surveys of incidents, concerns of users?
4. Answering the expectations
The MACC-RAD Service is designed in such a way that it satisfies the users’ expectations as a whole. Each element is designed in view of its integration in a more complete system and not individually. The use of Web technologies and more generally, of GEOSS standards and best practices in exchange of data and interoperability of applications permits to design an efficient information system in a modular way. The concept of a collaborative information system on the Web adopted in the MACC-RAD Service is discussed at the end of this document. Best designed for its integration in the MACC-RAD Service, each element can be updated and improved without re-designing the whole information system.
The concept of the MACC-RAD Service is based on the following elements:
operations and procedures to create databases of SSI, monitor the workflow, and control the quality,
databases of SSI and other parameters. These databases contain basic information from which core products are created,
applications that exploit these databases in order to create MACC-RAD core products. These applications are here Web services, i.e., applications that can be invoked on the Web,
exposition of these Web services in a community repository (community portal) for their exploitation,
a dedicated information system that interacts with the users, presents products, exploit the Web services to obtain products that it delivers to the users.
These elements are discussed in the next Chapters.
Prior to detailing these elements, we discuss the compliance of the proposed design to users’ expectations. To that goal, we list the expectations and show whether the future MACC-RAD Service bring an appropriate answer or not to each of them. In order to show improvements with current situation, we do the same for the present services: SOLEMI and SoDa. In addition, we also compare to the planned transition system that is based on the well-known SoDa Service. This transition system will be set up in order to bring answers more rapidly, as the creation of the MACC-RAD Service is a lengthy task.
4.1. Data
Table 4.1 shows the compliance of the present services, the transition service, and the first and second versions of the MACC-RAD Service with respect to users’ expectations on geophysical parameters.
The present services SoDa and SOLEMI deliver values for the global irradiance and its direct and diffuse components. These parameters will be delivered in the forthcoming services. Illuminance will be derived from total irradiance in the transition service, and will be directly computed in the MACC-RAD Service.
Request illuminance Irradiance, Snow cover
Other meteorological
parameters
Present services Yes - No No No
Transition Service Yes - Yes Yes, partly No
MACC-RAD v1 Yes - Yes Yes Yes
MACC-RAD v2 Yes - Yes Yes Yes
Table 4.1. Compliance with the users’ expectations regarding geophysical parameters
Snow cover is not a parameter delivered by the present services. It will be considered in the transition service, at least as a flag indicating a possible lack of reliability of the SSI estimate. Further versions will both take into account snow cover in the SSI estimates and provide snow cover parameter.
Other meteorological parameters are not delivered by the present services. They will not either in the transition service. The MACC-RAD Service will provide them.
Table 4.2 shows the compliance of the services with respect to users’ expectations on the spatial resolution of the geophysical parameters. The expectations will be met when parameters are available, except for the other parameters in version 1 of the MACC-RAD Service. These parameters will have the resolution of the re-analyses produced by ECMWF, i.e. a few tens of km. Smart spatial resampling procedures will be applied in version 2 to meet users’ expectations.
Request Irradiance, illuminance Snow cover Other parameters
Present services Yes - -
Transition Service Yes Yes -
MACC-RAD v1 Yes Yes No
MACC-RAD v2 Yes Yes Yes
Table 4.2. Compliance with the users’ expectations regarding spatial resolution (5 to 10 km)
Table 4.3 shows the compliance of the services with respect to users’ expectations on the temporal resolution. The expectations will be met for irradiance and illuminance. It is not expected to have hourly values of snow cover. As for other parameters, daily and monthly values will be available. Smart temporal resampling procedures will be applied in version 2 to meet users’ expectations.
Request Irradiance, illuminance Snow cover Other parameters
Present services Yes – Yes - Yes - -
Transition Service Yes – Yes - Yes No – Yes - Yes -
MACC-RAD v1 Yes – Yes - Yes No – Yes - Yes No – Yes - Yes
MACC-RAD v2 Yes – Yes - Yes No – Yes - Yes Yes – Yes - Yes
Table 4.3. Compliance with the users’ expectations regarding temporal resolution: hour – day - month
Table 4.4 shows the compliance of the services with respect to users’ expectations on the provision of time-series and maps. The present services deliver time-series as a standard product and maps on request. The situation will remain the same till the whole inclusion of the MACC-RAD Service version 2 of a mapping capability to provide maps as standard products.
Request Time-series Maps
Present services Yes On request
Transition Service Yes On request
MACC-RAD v1 Yes On request
MACC-RAD v2 Yes Yes
Table 4.4. Compliance with the users’ expectations regarding provision of time-series and maps
4.2. Metadata and ancillary information
Table 4.5 shows the compliance of the services with respect to users’ expectations on the metadata for discovery and exploitation. The present services use metadata for exploitation only. The transition service will be present in GEOSS catalogues due to the use of metadata for discovery. These metadata will be INSPIRE-compliant. Exploitation metadata in the MACC-RAD Service will be based on the on-going work of the GEOSS Architecture and Data Committee.
Request Discovery Exploitation
Present services No Yes
Transition Service Yes (INSPIRE) Yes
MACC-RAD v1 Yes (INSPIRE) Yes (GEOSS)
MACC-RAD v2 Yes (INSPIRE) Yes (GEOSS)
Table 4.5. Compliance with the users’ expectations regarding metadata for discovery and exploitation
Table 4.6 shows the compliance of the services with respect to users’ expectations on the ancillary information. The present services deliver flags and quantities relating to interpolation, reliability and uncertainty. This will remain in the forthcoming services with enhancements. In addition, data input to the method will be delivered by the MACC-RAD Service.
Request Data input to
method
Flag on
interpolation Reliability Uncertainty
Present services No Yes Yes Yes
Transition Service No Yes Yes Yes
MACC-RAD v1 Yes Yes Yes Yes
MACC-RAD v2 Yes Yes Yes Yes
Table 4.6. Compliance with the users’ expectations regarding ancillary information
4.3. Access
to
data
Table 4.7 shows the compliance of the services with respect to users’ expectations on the depth of the archive (10 years at least) and the age of the data. The services meet the demand on this point.
Delivering real-time products, i.e. having less than a few hours, will be technically difficult and is not in the scope of the MACC-RAD Service. The method to be used in the transition service and MACC-RAD Service requests inputs that cannot be provided in real-time. The delay in obtaining these inputs leads to a delay in provision of SSI products.
In addition, data policy and downstream services should be taken into account. Disseminating very recent data is a sensitive topic subject to the data policy of the various providers and that could be harmful to markets generated by downstream services and further, to the companies behind.
Request Archive (at
least 10 years)
Archive (10 recent years)
Recent (last month)
Near-real time (last hours/days)
Present
services Yes Yes Yes Yes
Transition
Service Yes Yes Yes Yes
MACC-RAD
v1 Yes Yes Yes Yes
MACC-RAD
v2 Yes Yes Yes Yes
Table 4.7. Compliance with the users’ expectations regarding the depth of the archive and the age of data
Table 4.8 shows the compliance of the services with respect to users’ expectations on the use of the Web and format of data. The present services use the Web for ordering and delivering data. Data are supplied in the form of text files (CSV) or Excel-like spreadsheets. The forthcoming services will meet the expectations.
Request Use the Web CSV files or spreadsheets
Present services Partly Yes
Transition Service Yes Yes
MACC-RAD v1 Yes Yes
MACC-RAD v2 Yes Yes
Table 4.8. Compliance with the users’ expectations regarding use of the Web and format of data
4.4. Documentation
Table 4.9 shows the compliance of the services with respect to users’ expectations on documentation. The present services meet the demand for documentation. Many documents are on-line. The forthcoming services will enhance the documentation, which will be on-line.
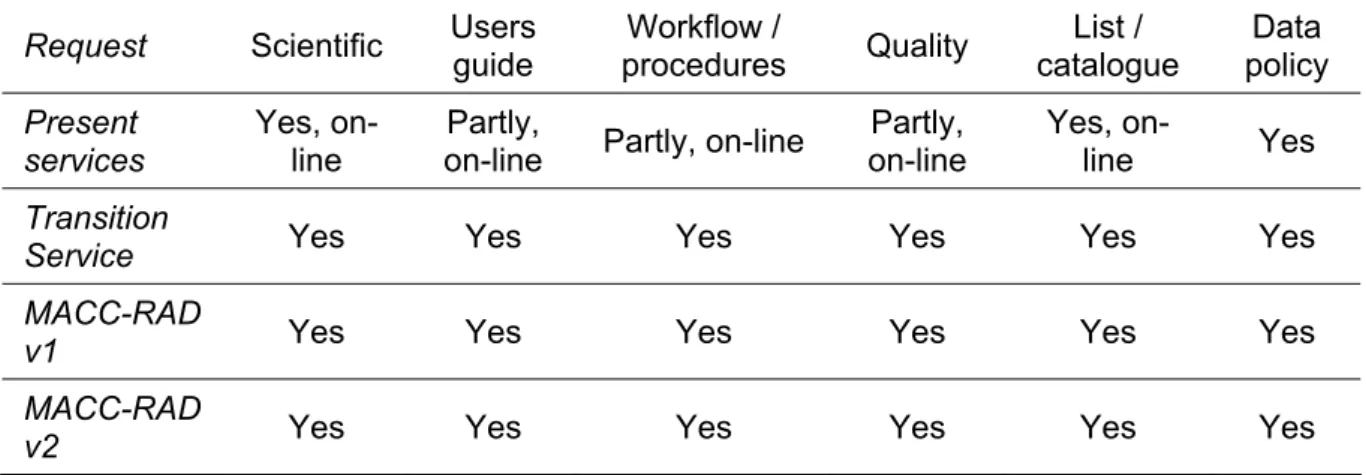
Request Scientific Users guide Workflow / procedures Quality List / catalogue Data policy Present services Yes, on-line Partly,
on-line Partly, on-line
Partly, on-line
Yes,
on-line Yes
Transition
Service Yes Yes Yes Yes Yes Yes
MACC-RAD
v1 Yes Yes Yes Yes Yes Yes
MACC-RAD
v2 Yes Yes Yes Yes Yes Yes
Table 4.9. Compliance with the users’ expectations regarding documentation
4.5. Quality
of
service
Table 4.10 shows the compliance of the services with respect to users’ expectations on the quality of service as a whole. The present services have taken steps to meet these expectations. The forthcoming services will follow this policy with improvements.
Request procedure Delivery Customers desk Helpdesk Automated access
Present
services Yes Partly Partly Partly
Transition
Service Yes Yes Yes Yes
MACC-RAD v1 Yes Yes Yes Yes
MACC-RAD v2 Yes Yes Yes Yes
Table 4.10. Compliance with the users’ expectations regarding the quality of service as a whole
4.6. Monitoring
quality
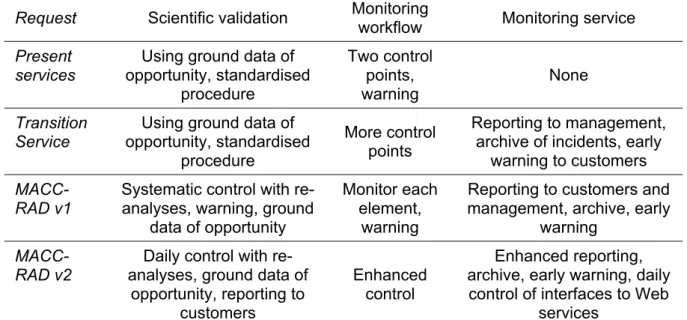
Table 4.11 shows the compliance of the services with respect to users’ expectations on the quality assurance and control.
The present services perform regularly validation of their products using ground measured data of opportunity. The validation procedure is now standardised thanks to the efforts made in the projects IEA SHC 36 and MESoR. Other manual procedures include a visual analysis of annual patterns for several years and a single geographical site, or visual inspection of images of SSI or other data in a movie.
In the future, it is foreseen to follow the same path for the transition service, and then, to exploit the re-analyses from ECMWF. It is foreseen to be able to report daily to customers. There will be two approaches in validation.
The first one consists in comparing reliable ground data with products. It will be performed as often as possible. It aims at assessing the uncertainty of the products. A model of uncertainty can be established or improved that provides for any instant the plausible uncertainty level of the SSI, given known explanatory variables such as the solar zenithal angle or the temporal variability of the SSI.
The second approach consists in comparing re-analyses with products. It will be performed once a day. Discrepancies are expected between both assessments. However, it is expected that a model can be found that explains these discrepancies as a function of known explanatory variables. Therefore, the distance between products and re-analyses can be predicted. It will be used to monitor the quality of products: large values should indicate suspect products. This approach is only sketched here. Its implementation will necessitate a great deal of effort and care.
The present services monitor the workflow at the following points: reception of the Meteosat images,
missing lines in an image, position of extreme lines and columns in image, storage of images of radiance in the temporary archive,
storage of clear-sky indices in the HelioClim databases, smooth running of each piece of software.
The present services do not have automated procedure to monitor the quality of the service. Efforts are made on an opportunity basis to warn customers about planned shutdowns. Efforts are planned in the forthcoming services. It is expected to establish a few control points, such as monitoring the number of connected customers and the computers’ capability, to report automatically to the management, and store reports in an archive. The MACC-RAD Service will comprise more control points and automated warning to customers. Enhanced reporting will be added in the future and daily controls of the interfaces to Web services (i.e. access to products) will be performed.
Request Scientific validation Monitoring
workflow Monitoring service
Present services
Using ground data of opportunity, standardised procedure Two control points, warning None Transition Service
Using ground data of opportunity, standardised
procedure
More control points
Reporting to management, archive of incidents, early
warning to customers
MACC-RAD v1
Systematic control with re-analyses, warning, ground
data of opportunity
Monitor each element,
warning
Reporting to customers and management, archive, early
warning
MACC-RAD v2
Daily control with re-analyses, ground data of
opportunity, reporting to customers
Enhanced control
Enhanced reporting, archive, early warning, daily
control of interfaces to Web services
Table 4.11. Compliance with the users’ expectations regarding the quality assurance and control
5. The databases HelioClim and SOLEMI
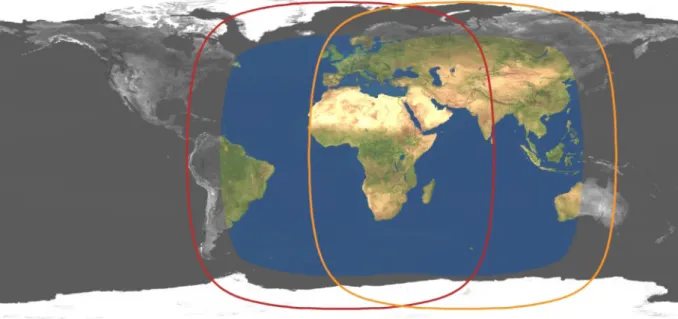
The databases HelioClim and SOLEMI originate from a processing of Meteosat images provided by Eumetsat, a European agency located in Darmstadt, in Germany.. The Meteosat satellites are geostationary and located over the Gulf of Guinea, at longitude 0 approximately. The currently operational satellite is called Meteosat Prime. As it is aging, the Meteosat Prime is replaced regularly and since 1998, the “old” satellite is shifted eastwards over the Indian Ocean, at 63°E; it is then called Meteosat East. Figure 5.1 depicts the geographical areas covered by both satellites and by SOLEMI.
Figure 5.1: Field of view of the Meteosat Prime (in red) and Meteosat East (in orange). The blue area denotes the part of the area where irradiances can be computed; this is the coverage of the database SOLEMI.
Since 2004, a new series of Meteosat satellites is in operation: Meteosat Second Generation covers the same area than the prime satellites. The Meteosat First Generation satellites were operated concurrently till 2006.
DLR has a complete copy of the Eumetsat archives of images acquired by the satellites Meteosat First Generation back to 1984. Raw data from 1991 to June 2006 (Meteosat Prime) and October 1998 to December 2006 (Meteosat East) are easily and operationally accessible in the Data Information and Management System (DIMS) at DLR. These images are exploited to produce the database SOLEMI.
Since 2004, the images of the satellite Meteosat Prime (MSG) are routinely received at Armines and are processed in near-real-time, owing to a collaboration with Eumetsat and Meteo-France. These images cover Europe, Africa, the Atlantic Ocean and the Western part of the Indian Ocean (see left half of the blue area in Figure 5.1). These images are exploited to produce the database HelioClim-3.
HelioClim-3 SOLEMI
Period Since 2004 Since 1991
Temporal Resolution 15 min 1 hour
Geographical Coverage Europe, Africa, Middle East
Europe, Africa, Middle East, Asia (except Eastern Asia)
Spatial Resolution 3 km at satellite nadir, approx. 5 km mid-latitude
3 km at satellite nadir, approx. 5 km mid-latitude Parameters Global total irradiance on
horizontal plane
Global total irradiance on horizontal plane; direct normal irradiance
Processing Near-real-time On request
Update of the database End of day End of month
Version V2 V14, build 98
6. Brief description of the method converting satellite images into
surface solar irradiance
6.1. History
of
the Heliosat methods
Several studies have demonstrated the feasibility of extracting the global solar surface irradiance (SSI) from geostationary satellites images like Meteosat (Tarpley, 1979; Möser, Raschke, 1984). Indeed, these satellites, which have passive sensors, observe the state of the atmosphere and the cloud cover above the target. These observations can be used to calculate the radiation reaching the ground.
Very early, the European Commission funded research to develop methods for retrieving the SSI from Meteosat images (Grüter et al., 1986). Among those, the Heliosat method was developed at MINES ParisTech (Cano et al., 1986). It became very popular and has been adopted by many researchers. Therefore, it underwent many changes aiming at improvements; the versions bearing major improvements were numbered (Heliosat-1, Heliosat-2, Heliosat-3).
The principles of Heliosat are illustrated in Figure 6.1. In most cases, a cloud exhibits a larger reflectance than the ground. Consequently, the appearance of a cloud in the field of view of the satellite sensor should result in an increase of the perceived signal: the cloud (target 2) appear brighter (whiter) than the ground (target 1). The magnitude of the difference between both targets is related to the depletion of the downwards radiation by the atmosphere. Of course, the situation where one can compares a cloudy pixel to a neighbour cloud-free pixel rarely happens. Therefore, Heliosat comprises a modelling of the SSI that should be observed by the sensor if the sky were clear for any pixel.
ATMOSPHERE SPACE target 1 target 2 clouds satellite OCEAN, GROUND ATMOSPHERE SPACE target 1 target 2 clouds satellite OCEAN, GROUND
Fig.6.1: Measurement principle as used in cloud-index methods
The versions of Heliosat, which are inverse models, have in common to be divided into two parts regarding the physical modelling: converting the satellite image into a cloud index and converting the cloud index in irradiance. Therefore, they are called cloud index methods. Other methods with similar principles do not use cloud index. In the Tarpley’s method (1979), the irradiance is estimated from the cloud fraction above the pixel.
should be derived empirically by comparison with coincident ground measurements. These parameters can be computed for each location of ground station and then spatially interpolated to produce maps of parameters (Cano et al. 1986). They can also be averaged; the mean values are considered valid for a given region, e.g., Europe (Diabaté et al., 1988). Diabaté et al. (1989) observed that for Europe, three sets of parameters were needed: one for morning, one at noon, and one in the afternoon. A delicate part in the Heliosat method is the determination of the cloud-free instants. As Heliosat uses only one channel in visible range, the cloud-free instants should be detected by exploiting the time-series. A cloud-free instant should correspond to a minimum in the time-series, provided all other conditions are equivalent, which is not the case; for example, the sun position is changing within the day and also from day to day for the same hour. Espinar et al. (2009b) or Lefèvre et al. (2007) found that a relative error in the ground albedo leads to a relative error of the same magnitude in SSI under clear-sky, i.e., a relative error of order 10 % of the SSI in cloudy cases. Another delicate part in cloud-index based methods is the determination of the albedo of the brightest clouds. The error due to an error in this albedo increases as the sky is becoming cloudy; consequently, the relative error in the SSI can be very large, e.g., 60 % (Espinar et al., 2009b; Lefèvre et al., 2007).
Beyer et al. (1996) at the University of Oldenburg (Germany) produced a version called later Heliosat-1. It enhanced the original Heliosat method in several aspects. The major one is the adoption of the clear-sky index Kc instead of the clearness index KT. The clear-sky index is
defined as the ratio of the actual SSI to the SSI that would be received if the sky were clear. The great advantage of the substitution is that the relationship between Kc and n is universal and is now: Kc = 1-n. It has been found by these authors and confirmed by others that little was lost in quality by adopting this relationship for any part of the world and any time. Further work was done to remove partly the dependence of the received radiance with the viewing angle, thus leading to a more spatially-homogeneous cloud-index. In addition, work was performed on the determination of the ground and cloud albedoes. Several empirical parameters used in this determination, e.g., the allowed change in time of the ground albedo or the threshold to detect cloud-free instants were revisited and new values were proposed to better account for actual measurements of SSI made by European ground stations.
To improve the accuracy and the reliability of the estimation and to facilitate the implementation of the method, Rigollier et al. (2004) designed Heliosat-2 at MINES ParisTech. It exploits the advances proposed by Heliosat-1 and seeks at removing empirical parameters. This is done by adopting several models that have been published independently of Heliosat or Meteosat. This requests a calibration of the Meteosat images to convert gray values into radiances and then reflectances. The clear-sky model proposed in the European Solar Radiation Atlas (ESRA) was adopted (Rigollier et al., 2000). The albedo of the brightest clouds is given by the model of Taylor and Stowe (1984a, b). This version Heliosat-2 is presented hereafter.
Zarzalejo et al. (2009) combined the method Heliosat-2 and the statistical approach proposed in the original version to determine the relationship between the clear-sky index Kc and the cloud-index. Actually, they searched a relationship between ground measurements, the cloud index n and several statistical moments of n, e.g., median, first and third quartiles. It is a means to account for the local climate effects. They found unbiased results for 28 stations in Spain and the relative error decreases compared to the Heliosat-2 version.
The version Heliosat-3 has been designed in a collaborative EU-funded project led by University of Oldenburg, and comprising MINES ParisTech and DLR among others. It is characterized by a clear-sky model, called SolIS, which is an approximation of radiative transfer equations for fast implementation (Mueller et al. 2004).
6.2. Overview of the method Heliosat-2
Both HelioClim and SOLEMI are constructed by the same method, Heliosat-2. They differ in the implementation. The concept of Heliosat-2 is as follows. The irradiance I for an instant t and location (x, y) is equal to
I(t, x, y) = Ic (t, x, y) Kc(t, x, y) (6.1)
where Ic(t, x, y) is the irradiance for the clear-sky case; Kc(t, x, y) is called the clear-sky index,
is positive, and quantifies the depletion of Ic due to clouds. Thus, the method is based on 1) a
model of irradiance for clear-sky whose results are more or less depleted as a function of the cloud properties to yield actual irradiance. This concept is the basis of many published models outside Heliosat-2 (Rigollier et al., 2004).
The clear-sky index Kc(t, x, y) is computed from the analysis of the Meteosat image at instant t and from the time-series of images prior to the current one. A cloud-index n(t, x, y) is
defined:
n(t, x, y) = [cloud(t, x, y) – (t, x, y)] / cloud(t, x, y) – g(t, x, y)] (6.2)
where , cloud, and g are the reflectances respectively observed by satellite for the pixel
under concern, the brightest clouds, and the ground. The cloud index is close to 0 when the observed reflectance is close to the ground reflectance, i.e., when the sky is clear. It can be negative if the sky is very clean, in which case is smaller than g. The cloud index
increases as the clouds are appearing. It can be greater than 1 for clouds that are optically very thick.
An empirical relationship was derived from coincident ground measurements and Heliosat-2 results that links n to Kc (Figure 6.2):
n < -0.2 Kc = 1.2 -0.2 < n < 0.8 Kc = 1 - n 0.8 < n < 1.1 Kc = 2.0667 - 3.6667 n+ 1.6667 n² (6.3) n > 1.1 Kc = 0.05 0 0.2 0.4 0.6 0.8 1 1.2 -0.3 -0.1 0.1 0.3 0.5 0.7 0.9 1.1 C lear -sky i n d ex K c Cloud index n
For the computation of the DNI (direct normal irradiance) in the SOLEMI database, the following equation is used:
DNI = DNIclear * exp(a n) (6.4)
where a is a number which depends on the viewing geometry, the brightness temperatures in thermal infra-red of the pixel, and the spatial variability in the cloud index.
The model of irradiance for clear-sky used for HelioClim is that of the European Solar Radiation Atlas (ESRA); the clear-sky model for SOLEMI is the model of Bird. These models and their inputs are discussed in further sections.
There are limitations in the implementation of this concept. One major limitation is that
Ic(t, x, y) is unknown. Knowledge on aerosols and other influencing atmospheric parameters
is too poor to permit to retrieve on an operational basis the irradiance Ic(t, x, y) for any time
and any location. Therefore, the best that can be provided is a typical value of Ic(t, x, y) for
this instant and location. In order to cope with that uncertainty, the clear-sky index Kc(t, x, y)
is allowed to be greater than 1 while it should not in principle.
6.3. Inputs
to
the clear-sky models
The clear-sky models require inputs that are now discussed.
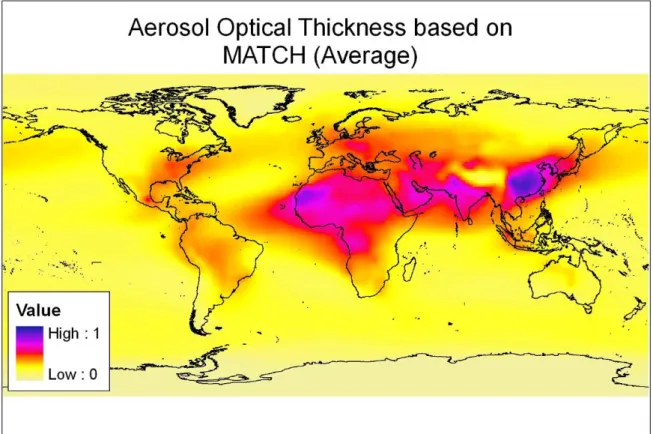
6.3.1. Aerosols
Aerosols have the strongest influence on clear-sky irradiances through absorption and scattering processes. Since aerosol particles are much larger than the solar irradiance wavelength, the scattering processes follow the Mie scattering theory. Unfortunately scattering and absorption processes cannot be well discriminated from each other. Ǻngstrøm introduced a formula covering both processes that provides the optical thickness as a function of the wavelength λ:
kλ = β λ-α (6.5)
β is the Ǻngstrøm turbidity coefficient indicating the aerosol content integrated in a vertical
column of the atmosphere. The values are usually between 0 and 0.5. α is the wavelength exponent related to the size distribution of the aerosol particles. α usually is between 0.25 and 2.5 with an average of 1.3. Extreme values up to -0.5 or 3.0 are possible.
Modelling aerosols in the atmosphere is very difficult and is one of the major current tasks in atmospheric and climate research. Liu and Pinker (2005) give an overview of the current state of the art. The sources of aerosols are highly variable in space and in time. The interaction of the aerosol particles with the atmospheric trace gases and clouds is complex; the life time is approximatively one week and is rather short. Models are making good progress in capturing aerosol evolution, but the characterization of the sources is still difficult (Tanré et al., 2005). Current state-of-the-art data sets currently include satellite observations of aerosols, precursor trace gases, clouds and precipitation and networks of surface-based instruments assimilated into a chemical transport model.
Chemical transport models are off-line models driven by meteorological data or from global circulation models which take aerosol processes as an integral part within the simulation scheme. The available global data sets have made use of satellite data. Many of them have been developed for the use in climate models, which analyze direct and indirect effects of