Publisher’s version / Version de l'éditeur:
Proceedings of Combustion Institute - Canadian Section Spring Technical
Meeting 2009, 2009
READ THESE TERMS AND CONDITIONS CAREFULLY BEFORE USING THIS WEBSITE. https://nrc-publications.canada.ca/eng/copyright
Vous avez des questions? Nous pouvons vous aider. Pour communiquer directement avec un auteur, consultez la première page de la revue dans laquelle son article a été publié afin de trouver ses coordonnées. Si vous n’arrivez pas à les repérer, communiquez avec nous à PublicationsArchive-ArchivesPublications@nrc-cnrc.gc.ca.
Questions? Contact the NRC Publications Archive team at
PublicationsArchive-ArchivesPublications@nrc-cnrc.gc.ca. If you wish to email the authors directly, please see the first page of the publication for their contact information.
NRC Publications Archive
Archives des publications du CNRC
This publication could be one of several versions: author’s original, accepted manuscript or the publisher’s version. / La version de cette publication peut être l’une des suivantes : la version prépublication de l’auteur, la version acceptée du manuscrit ou la version de l’éditeur.
Access and use of this website and the material on it are subject to the Terms and Conditions set forth at
Numerical study of the effects of pressure and gravitational
acceleration on soot formation in laminar axisymmetric coflow methane
diffusion flame: examining the p2g scaling
Liu, Fengshan; Smallwood, Gregory J.
https://publications-cnrc.canada.ca/fra/droits
L’accès à ce site Web et l’utilisation de son contenu sont assujettis aux conditions présentées dans le site LISEZ CES CONDITIONS ATTENTIVEMENT AVANT D’UTILISER CE SITE WEB.
NRC Publications Record / Notice d'Archives des publications de CNRC:
https://nrc-publications.canada.ca/eng/view/object/?id=4d77e46c-7291-4231-b373-43850aefacd6 https://publications-cnrc.canada.ca/fra/voir/objet/?id=4d77e46c-7291-4231-b373-43850aefacd6
_____________________________________________ Proceedings of Combustion Institute – Canadian Section Spring Technical Meeting Université de Montréal, Québec
UU
May 11-13, 2009
Numerical study of the effects of pressure and gravitational
acceleration on soot formation in laminar axisymmetric coflow
methane diffusion flame: examining the p
2g
scaling
Fengshan Liu, Gregory J. Smallwood
Institute for Chemical Process and Environmental Technology, National Research Council, Ottawa, Ontario, Canada K1A 0R6
1. Introduction
Investigation of soot formation is of great importance both fundamentally and practically. Although laminar coflow diffusion flames at atmospheric pressure and normal gravity (ng) are an ideal flame configuration to study many fundamental physical and chemical aspects of soot formation experimentally and numerically, such flames are in general buoyancy controlled. On the other hand, practically important turbulent flames are often not buoyancy controlled and should be related to weakly-buoyant laminar diffusion flames. Because of these constraints, it has been argued that the findings gained in buoyant laminar flames at ng may not be relevant to turbulent flames, since the path that soot follows has very different temperature and chemical environments in buoyant and weakly-buoyant flames, leading to very different soot growth and oxidation history [1,2].
Weakly- or non-buoyant laminar diffusion flames are ideally studied in environment of reduced gravity. Two popular but expensive ways to create such environment are using a space shuttle or a drop tower. Another inexpensive and easy-to-achieve approach to study laminar diffusion flames under reduced gravity is to investigate laminar diffusion flames under reduced pressure and normal gravity based on the simple scaling relationship that buoyancy scales as p2
g in laminar flames [3,4]. This scaling relationship suggests that flames at pressures on the order of 0.l atm and normal gravity (1g) have the same structure as those at reduced gravity of the order of 0.01g and atmospheric pressure. Based on this principle, Faeth and co-workers have experimentally investigated soot properties in weakly-buoyant laminar diffusion flames at low pressures and normal gravity [1,5]. It is important to point out that this scaling relationship was derived under the assumptions of a flame sheet model, unity Lewis number, and neglect of radiation heat loss [3]. However, there is currently a lack of detailed experimental or numerical studies as to whether such an scaling can be applied to investigate soot properties, even though applications have been reported [1,5]. The present study made an attempt to address the following question: does a laminar diffusion flame at lower pressure and higher gravitational acceleration have the same flame structure and soot field as its counterpart at a higher pressure and lower gravity as long as p2g and the mass flow rates of fuel and air are kept constant? To answer this question, detailed numerical calculations were conducted to predict the flame properties of laminar axisymmetric coflow methane/air diffusion flame under different pressures and gravities while keeping the mass flow rates of fuel and air and p2g constant. Governing equations of mass, momentum, energy and species were solved in axisymmetric cylindrical coordinates using the standard finite volume method. Soot formation was modelled using a semi-empirical two-equation model. Thermal radiation transfer was accounted for using the discrete-ordinates method coupled with a wide-band non-grey property model. Combustion chemistry was modelled using the GRI-Mech 3.0 mechanism. Detailed thermal and transport properties were considered. The numerical results were presented and analyzed with attention paid to the validity of the p2
g scaling relationship for flame properties and in particular those related to soot.
2. Numerical Model and Solution Method
The elliptic steady-state governing equations of mass, momentum, energy, and species in axisymmetric cylindrical coordinates and in the low Mach number limit given in [6] were solved. The effect of buoyancy was accounted for by retaining the gravity term in the momentum equation in the flow direction (z, vertically upwards). The method of correction diffusion velocity described in [7] was employed to ensure that the net diffusion flux of all species sums to zero in both r and z directions. Note that the correction velocity accounts for the thermophoretic velocity of soot. The interaction between the soot chemistry and the gas-phase chemistry was accounted for through the reaction rates of the species related to soot formation and oxidation, namely C2H2, CO, H2, O2, O, H, and OH in the present
context. Only the thermal diffusion velocities of H2 and H are accounted for using the expression given in [7]. The
source term in the energy equation due to radiation heat transfer was also included.
Soot is modeled using the semi-empirical two-equation model described in previous studies [8], which is a modified version from that presented by Leung et al. [9]. Briefly, it is assumed in this model that acetylene is the only species responsible for soot nucleation and surface growth. Soot oxidation by O2, O, and OH were accounted for. Further
details can be found in [8].
The source term due to thermal radiation in the energy equation was calculated using the discrete-ordinates method in axisymmetric cylindrical geometry described in [10]. The statistical narrow-band correlated-K (SNBCK) based 9-band model recently developed by Liu and Smallwood [11] was employed to obtain the absorption coefficients of the combustion products containing CO, CO2, H2O, and soot at each band and each quadrature point. Gas-phase
combustion chemistry was modeled using the GRI-Mech 3.0 mechanism [12], which was optimized for methane combustion, with the removal of species and reactions related to NOx formation (except N2). This simplified
GRI-Mech 3.0 mechanism contains 36 species and 219 reactions. Thermal and transport properties of species and the mixture were obtained from CHEMKIN subroutines and the GRI-Mech 3.0 database.
To identify the location of the flame sheet defined by the stoichiometric mixture fraction, an additional transport equation for the mixture fraction (0 at the air streams and 1 at the fuel stream), which is a conserved quantity without source terms in its transport equation, was solved. The diffusion coefficient of the mixture fraction was calculated with the assumption of unity Lewis number after the study of Pitsch and Peters [13]. In addition, the mixture fraction definition given by Bilger et al. [14] was also used to identify the flame location.
The discretization and solution methods of the transport equations used in this study were the same as those employed in previous studies [8,10].
The axisymmetric coflow laminar CH4/air diffusion flames numerically investigated in this study are stabilized on a
burner similar to the Gülder burner described in [15], which is also very similar to the burner used by Santoro and workers [16,17]. The Gülder burner consists of a fuel tube of 10.95 mm inner diameter surrounded by a co-annular outer air jet of 88 mm inner diameter. The thickness of the fuel tube is 0.9 mm. In this numerical study, the burner is a modified version of the Gülder burner: the outer co-annular air jet is much larger and has an inner diameter of almost 28 cm. This serves the purpose of minimizing the influence of using slip boundary condition on the outer radial boundary on the flame structure.
Numerical calculations were conducted on a computational domain of 9.78 cm (z) × 13.98 cm (r). Non-uniform grids were used in both the r and z directions to provide greater resolution in the large gradient regions near the burner exit without an excessive increase in the computing time. Very fine and uniform grids were placed within the fuel pipe at r = 5.45 mm in the radial direction with a grid size less than 0.2 mm. Outside the burner tip in r direction, the grid size became gradually coarser. In the flow direction (z), very fine and non-uniform grids were used in the burner exit region up to 2.6 cm (grid size less than 0.36 mm). Further downstream, uniform but coarser grids were used. The grid size between z = 2.6 cm and 6.6 cm is still fairly fine at Δz = 0.4 mm. Beyond z = 6.6 cm, the grid size is Δz = 0.65 mm. The computational domain was divided into 251(z)×135(r) control volumes. Both the fuel and air inlet temperatures were assumed to be 300 K. Uniform velocity profile was assigned to the air inlet except near the outer surface of the fuel pipe where a boundary layer type velocity profile was assumed. For the fuel stream, the inlet velocity profile was assumed to be parabolic. Along the centerline (r = 0 cm) and the outer radial boundary (r = 13.98 cm), v = 0 cm/s and zero-gradient for all other variables are assumed. At the top boundary (z = 9.78 cm), a zero-gradient condition was applied to all variables. The convergence criterion used in the calculations
was that relative changes of the peak soot volume fraction and the peak temperature were to be less than 1×10⁻⁵. The
grid resolution was found adequate, since further refinement has negligible influence on the numerical results. This numerical approach has been shown to predict soot volume fraction and flame temperature distributions in reasonable agreement with experimental data at atmospheric and elevated pressures [10,18].
3. Results and Discussion
Numerical calculations were conducted under three different levels of pressure and gravity at a constant p2
g = 98 atm2 cm/s2. The three sets of pressure and gravity are summarized in Table 1, where g
0 is the gravity on earth (980
cm/s2). It is seen that while the pressure does not vary significantly from the lowest to the highest level (by about a factor of 3). However, the corresponding variation of gravitational acceleration is much larger (a factor of 10). It is recognized that the range of pressure variation considered in this study is relatively small. This is to ensure that the methodology used in this study, in particular the gas-phase reaction mechanism, soot formation model, and the neglect of near-burner effects (upstream diffusion of heat and mass around the burner rim), is valid and can be used with confidence.
At p = 1 atm, the mean air and fuel inlet velocities are specified at 20 cm/s and 3.25 cm/s, respectively. The mass flow rates of the air and fuel streams are kept constant as the ambient pressure is varied. In other words, the mean inlet velocities are varied as inversely proportional to pressure.
Table 1 Three sets of pressure and gravity considered. Set p (atm) g (cm/s2) g/g0
1 1 98 0.1
2 0.6325 245 0.25
3 0.3162 980 1.0
The structures of the flame under the three sets of pressure and gravitational acceleration are first examined in terms of temperature and axial velocity distributions. Fig. 1 displays the 2D distributions of temperature with the peak temperature in each case indicated in the figure caption. The solid and dashdot black lines in these color plots represent the stoichiometric mixture fraction (fst = 0.05496) obtained from solving the transport equation for the
mixture fraction [13] and based on the definition of Bilger et al. [14], respectively. The first impression from this figure is that there is a significant change in the flame structure with the variation in the ambient pressure, even though the mass flow rates of air and fuel and p2
g are kept constant. The flame is lifted when the pressure reaches p = 0.32 atm. The peak temperature occurs in each case in the annular region low in the flame. The maximum peak temperature is achieved at p = 0.32 atm and the peak temperature starts to drop slightly as the pressure is increased. As the pressure decreases from p = 1 atm, the temperatures in the centerline region continue to increase. As shown later, this is associated with reduced radiation heat loss from soot as much less soot is formed with decreasing pressure.
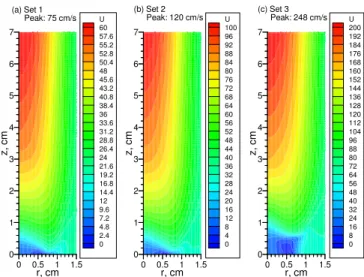
The flame heights, defined by the location of the stoichiometric mixture fraction on the centreline (solid black lines in Fig. 1), the flame height remains almost constant as the pressure is decreased. In addition, the flame height defined by the solid black line agrees well with that defined by the peak temperature on the centreline when the flame is not lifted, Figs. 1(a) and 1(b). On the other hand, the stoichiometric mixture fraction from solving the mixture fraction transport equation yields a much longer flame height (dashdot line) for when the flame is not lifted, Figs. 1(a) and 1(b). For the lifted case, Fig. 1(c), the two methods for obtaining the stoichiometric mixture fraction agree reasonably well. The definition of mixture fraction due to Bilger et al. [14] is preferred because the flame height from this definition agrees with that defined by the axial location where the centerline temperature peaks. Figure 2 displays the axial velocity distributions. Due to large differences in the axial velocity among the three sets of pressure and gravitational acceleration, each plot uses a different color scale from 0 to its own maximum value at z = 7 cm indicated in the figure caption. These color contours were generated using 26 uniform levels between 0 and their respective peak axial velocities. The peak axial velocity (at z = 7 cm on the flame centerline) varies significantly from 75 cm/s at p = 1 atm, Fig. 2(a), to 248 cm/s at p = 0.32 atm, Fig. 2(c). These results are expected under conditions of fixed mass flow rates and p2g. With decreasing the pressure, both the inlet velocities of the air and fuel streams and the gravitational acceleration increase. Both factors contribute to the increased axial velocity with decreasing pressure shown in Fig. 2.
Such a factor of three variation in the axial velocity suggests that the residence time of a fluid parcel from the burner exit surface to a given height in the flame could be very different. To quantitatively illustrate this point, Fig. 3 compares the residence times for a fluid parcel along the flame centerline. As anticipated from the approximately factor of three increase in the axial velocity as the pressure is decreased from 1 atm to 0.32 atm, the corresponding residence time decreases also by about a factor of three. This substantial variation in the residence time from one set of pressure/gravitational acceleration to another implies that certain aspects of the laminar diffusion flame that are kinetically controlled could be quite different, rendering the p2g scaling relationship no longer useful for investigating soot formation at reduced buoyancy by conducting experiments at lower pressures.
Distributions of soot volume fraction for the three sets of pressure/gravitational acceleration are compared in Fig. 4. Note that these color contours are generated using 26 uniform color scales from 0 to their respective peak soot volume fractions due to the large variation from one case to another. Several observations can be made from this figure. First, the visible flame height due to soot luminosity decreases slightly with decreasing pressure from about 35 mm at p = 1 atm, Fig. 4(a), to about 32 mm at p = 0.63 atm, Fig. 4(b). The visible flame height then remains almost unchanged with further decreasing in pressure. Secondly, the peak soot volume fraction decreases very rapidly as the pressure is decreased, from 0.41 ppm at p = 1 atm to 0.138 ppm at p = 0.63 atm, and finally to 0.0085 ppm at 0.32 atm. Thirdly, the relative concentration of soot in the flame centerline region increases with decreasing pressure. It is well known from laminar diffusion flame experiments conducted at elevated pressures and earth gravity that more soot is produced as the pressure is increased [18-20]. The main mechanism for the effect of pressure on soot formation was found to be through its direct influence on the density mixture, which in turn alters the reaction rates of both gas-phase and soot chemistry. It has also been made clear that reduced buoyancy enhances soot formation [21,22]. Therefore, under conditions of constant p2
g and constant mass flow rates of fuel and air streams it is expected that more soot is formed as the pressure is increased, since both elevated pressure and reduced buoyancy prompt soot formation.
The results shown in Fig. 4 clearly indicate that soot formation characteristics at lower pressure/higher gravity, Fig. 4(c), are very different from those at atmospheric pressure/reduced gravity, Fig. 4(a). For this reason, the p2g scaling relationship derived by Davis et al [3] should not be used to infer soot formation in reduced gravity by conducting experiments under reduced pressure as advocated by Faeth et al. [1,5]. It is interesting to notice that Davis et al. [3] made the following cautious statement in their study: “Clearly use of this procedure to attain very small effective gravitational accelerations appears unreasonable, as chemical kinetics could certainly not be ignored at the low pressures required. Additionally, enhanced soot production at low g would not be simulated by this pressure variation technique.”
As noted in the Introduction, the p2
g scaling relationship was derived based on the flame sheet approximation, unity Lewis numbers, and neglect of thermal radiation transfer by maintaining a constant Richardson number. The numerical results obtained in this work suggest that there are significant variations in the flame structure and soot formation characteristics for a laminar diffusion flame under conditions of constant mass flow rates of fuel and air streams and p2
g. The reasons for the failure of this scaling relationship for the purpose of soot study include the strong pressure dependence of residence time and reaction rates and the reduced soot formation and reduced radiation heat loss, which in turn alters the flame temperature, as the pressure is decreased.
4. Conclusions
Detailed numerical calculations were conducted in a laminar coflow CH4/air diffusion flame with soot formation for
three sets of pressure and gravitational acceleration under conditions of constant p2
g and mass flow rates of the fuel and air streams. The numerical results indicate that there are substantial variations in the flame structure and soot volume fraction, and moderate change in the visible flame height as the pressure is varied even though p2g is fixed. The stoichiometric mixture fraction defined by Bilger et al. should be used to identify the flame front in diffusion flames. The main reasons for the breakdown of this so-called p2
g scaling relationship are strong variations in residence time, overall chemical reaction rates, and flame temperature as the pressure is varied. Therefore, this scaling relationship should not be used to infer soot formation characteristics in weakly buoyant flames by conducting experiments at reduced pressures.
References
[1] S. Mortazavi, P. B. Sunderland, J. Jurng, Ü. Ö. Köylü, G. M. Faeth, AIAA 93-0708, 31st Aerospace Sciences Meeting & Exhibit, Jan. 1993, Reno, NV.
[2] P. B. Sunderland, S. Mortazavi, G. M. Faeth, D. L. Urban, Combust. Flame 96 (1994) 97-103. [3] R. W. Davis, F. E. Moore, Santoro, R. J., Ness, J. R., Combust. Sci. Tech. 73 (1990) 625-635.
[4] G. M. Faeth, Proceedings of the AIAA/IKI Microgravity Science Symposium, AIAA, Washington, 1991, pp. 281-293.
[5] Ü. Ö. Köylü, P. B. Sunderland, Mortazavi, S., G. M. Faeth, AIAA 94-0428, 32nd Aerospace Sciences Meeting
& Exhibit, Jan. 1994, Reno, NV.
[6] K. K. Kuo, Principle of Combustion, Wiley, New York, 1986.
[7] R. J. Kee, J. F. Grcar, M. D. Smooke, J. A. Miller, SANDIA Report, SAND85-8240, Reprint, 1994. [8] F. Liu, H. Guo, G. J. Smallwood, Ö. L. Gülder, JQSRT 73 (2002) 409-421.
[9] K. M. Leung, R. P. Lindstedt, W. P. Jones, Combust. Flame 87 (1991) 289-305. [10] F. Liu, H. Guo, G. J. Smallwood, Combust. Flame 138 (2004) 136-154. [11] F. Liu, G. J. Smallwood, JQSRT 84 (2004) 465-475.
[12] G. P. Smith, D. M. Golden, M. Frenklach, N. W. Moriarty, B. Eiteneer, M. Goldenberg, C. T. Bowman, R. K., Hanson, S. Song, W. C. Gardiner Jr., V. V. Lissianski, Z. Qin, HHUUhttp://www.me.berkeley.edu/gri_mech/UUHH
.
[13] H. Pitsch, N. Peters, Combust. Flame 114 (1998) 26-40.
[14] R. W. Bilger, S. H. Stårner, R. J. Kee, Combust. Flame 80 (1990) 135-149.
[15] D. R. Snelling, K. A. Thomson, G. J. Smallwood, Ö. L. Gülder, Applied Optics 38 (1999) 2478-2485. [16] R. J. Santoro, H. G. Semerjian, R. A. Dobbins, Combust. Flame 51 (1983) 203-218.
[17] K. C. Smyth, J. H. Miller, R. C. Dorfman, W. G. Mallard, R. J. Santoro, Combust. Flame 62 (1985) 157-181. [18] F. Liu, K. A. Thomson, H. Guo, G. J. Smallwood, Combust. Flame 146 (2006) 456-471.
[19] K. A. Thomson, Ö. L. Gülder, E. J. Weckman, R. A. Fraser, G. J. Smallwood, D. R,. Snelling, Combust. Flame 140 (2005) 222-232.
[20] L. L. McCrain, W. L. Roberts, Combust. Flame 140 (2005) 60-69.
[21] C. M. Megaridis, D. W. Griffin, B. Konsur, Proc. Combust. Inst. 26 (1996) 1291-1299. [22] P. S. Greenberg, J. C. Ku, Combust. Flame 108 (1997) 227-230.
0 0.5 1 1.5 r, cm 0 1 2 3 4 5 6 7 z, cm T, K 1900 1836 1772 1708 1644 1580 1516 1452 1388 1324 1260 1196 1132 1068 1004 940 876 812 748 684 620 556 492 428 364 300 (a) Set 1 Peak: 1876 K 0 0.5 1 1.5 r, cm 0 1 2 3 4 5 6 7 z, cm (b) Set 2 Peak: 1880.5 K 0 0.5 1 1.5 r, cm 0 1 2 3 4 5 6 7 z, cm (c) Set 3 Peak: 1899.5 K 0 0.5 1 1.5 r, cm 0 1 2 3 4 5 6 7 z, cm U 60 57.6 55.2 52.8 50.4 48 45.6 43.2 40.8 38.4 36 33.6 31.2 28.8 26.4 24 21.6 19.2 16.8 14.4 12 9.6 7.2 4.8 2.4 0 (a) Set 1 Peak: 75 cm/s 0 0.5 1 1.5 r, cm 0 1 2 3 4 5 6 7 z, cm U 100 96 92 88 84 80 76 72 68 64 60 56 52 48 44 40 36 32 28 24 20 16 12 8 4 0 (b) Set 2 Peak: 120 cm/s 0 0.5 1 1.5 r, cm 0 1 2 3 4 5 6 7 z, cm U 200 192 184 176 168 160 152 144 136 128 120 112 104 96 88 80 72 64 56 48 40 32 24 16 8 0 (c) Set 3 Peak: 248 cm/s
Fig. 1 Comparison of 2D temperature distributions Fig. 2 Comparison of axial velocity distributions. with stoichiometric mixture fraction (0.05496)
contours shown. z, cm 0 1 2 3 4 5 6 7 8 9 Res idence t ime, ms 0 50 100 150 200 250 p = 1 atm 0.6325 atm 0.3162 atm 0 0.5 1 1.5 r, cm 0 1 2 3 4 5 6 7 z, cm Soot 0.4 0.384 0.368 0.352 0.336 0.32 0.304 0.288 0.272 0.256 0.24 0.224 0.208 0.192 0.176 0.16 0.144 0.128 0.112 0.096 0.08 0.064 0.048 0.032 0.016 0 (a) Set 1 Peak: 0.41 ppm 0 0.5 1 1.5 r, cm 0 1 2 3 4 5 6 7 z, cm Soot 0.12 0.1152 0.1104 0.1056 0.1008 0.096 0.0912 0.0864 0.0816 0.0768 0.072 0.0672 0.0624 0.0576 0.0528 0.048 0.0432 0.0384 0.0336 0.0288 0.024 0.0192 0.0144 0.0096 0.0048 0 (b) Set 2 Peak: 0.138 ppm 0 0.5 1 1.5 r, cm 0 1 2 3 4 5 6 7 z, cm Soot 0.0085 0.00816 0.00782 0.00748 0.00714 0.0068 0.00646 0.00612 0.00578 0.00544 0.0051 0.00476 0.00442 0.00408 0.00374 0.0034 0.00306 0.00272 0.00238 0.00204 0.0017 0.00136 0.00102 0.00068 0.00034 0 (c) Set 3 Peak: 0.0085 ppm
Fig.3 Distributions o fluid parcel residence time Fig. 4 Distributions of soot volume fraction. along the flame centerline.