HAL Id: hal-02750108
https://hal.inrae.fr/hal-02750108
Submitted on 3 Jun 2020HAL is a multi-disciplinary open access archive for the deposit and dissemination of sci-entific research documents, whether they are pub-lished or not. The documents may come from teaching and research institutions in France or abroad, or from public or private research centers.
L’archive ouverte pluridisciplinaire HAL, est destinée au dépôt et à la diffusion de documents scientifiques de niveau recherche, publiés ou non, émanant des établissements d’enseignement et de recherche français ou étrangers, des laboratoires publics ou privés.
X-Palm, a functional structural plant model for
analysing temporal, genotypic and inter-tree variability
of oil palm growth and yield
Benoit Pallas, Jean-Christophe Soulie, Grégory Aguilar, Lauriane Rouan,
Delphine Luquet
To cite this version:
Benoit Pallas, Jean-Christophe Soulie, Grégory Aguilar, Lauriane Rouan, Delphine Luquet. X-Palm, a functional structural plant model for analysing temporal, genotypic and inter-tree variability of oil palm growth and yield. 7. International Conference on Functional Structure Plant Models, Jun 2013, Vantaa, Finland. �hal-02750108�
Proceedings of the 7th International Conference on Functional-Structural Plant Models, Saariselkä, Finland, 9 - 14 June 2013. Eds. Risto Sievänen, Eero Nikinmaa, Christophe Godin, Anna Lintunen & Pekka Nygren.
http://www.metal.fi/fspm2013/proceedings. ISBN 978-951-651-408-9.
319
X-Palm, a functional structural plant model for analysing temporal, genotypic
and inter-tree variability of oil palm growth and yield
Benoît Pallas*, Jean-Christophe Soulié, Grégory Aguilar, Lauriane Rouan and Delphine Luquet
CIRAD, UMR AGAP, Avenue d’Agropolis, F-34398 Montpellier cedex 5
*correspondence: [email protected]
Highlights: Oil palm yield depends on many component traits that are determined during about 4 years between inflorescence meristem initiation and harvest. Yield also presents large inter-month variability as well as variability among trees in the field. To simulate this complex system we developed a plant growth model using i) plant source-sink relationships as drivers of plant phenotypic plasticity and ii) stochastic rules relating inflorescence characteristics to plant nutritional status.
Keywords: Carbon balance, yield components, Elaeis guinensis, stochastic model, organogenesis INTRODUCTION
Oil palm is the most important oil crop in the world but no relevant model was built to simulate and predict oil palm growth and yield variability. This can be explained by the complexity of yield elaboration for oil palm. Throughout its productive period, each phytomer can bear a female or male inflorescence or none at all if abortion occurs. Yield also depends on other components such as the number of fruits per inflorescence, individual fruit weight or oil content in fruits. Previous studies (Combres et al., 2013) showed that each of these yield components is determined during specific phases of the whole inflorescence development (4 years). Several factors can indeed differently affect each yield component. Plant source-sink balance for carbohydrates was observed to be one of the main factors affecting yield (Pallas et al., 2013). Each tree in a plantation can also present its own production rhythm resulting in trees that are out of phase. Accordingly, depending on the genotype propensity to have desynchronized trees and on environmental conditions, production at the plantation level will be either rhythmic or continuously distributed along years (Corley and Tinker, 2003). To simulate this pattern deterministic models based on response curves at the plantation level are not fully adequate. Different modelling approaches were performed, in particular stochastic models, to predict growth variability in the field (e.g. Kang et al., 2009) but these approaches showed limits in modelling such complex system of dynamic source-sink relationships and their genotypic and environmental determinisms. The study presents an original (X-Palm) model dedicated to analyze the dynamic source/sink relationships underlying yield elaboration and predict the periodicity of oil palm plantation production.
MODEL STRUCTURE
Using object-oriented modelling, X-Palm is based on an explicit topological representation of all the growing units. The plantation is represented as a sum of individual trees, each of them are composed of a cohort of phytomers bearing organs (internode, leaf and bunch). Each organ is decomposed into ‘sub-organs’ (e.g. peduncle, rachilla, fruit for bunches). Each organ is characterized by both quantitative (weight, thermal time since appearance...) or qualitative (inflorescence state...) variables. X-Palm is based on the concept of competition among sinks driving biomass partitioning and on retroaction loops between source/sink ratio and morphogenesis (Luquet et al., 2006). At each time step a plant carbon balance is computed. This carbon balance takes into account assimilate demand for organ growth and maintenance respiration and assimilate supply from photosynthesis and reserve mobilization. Estimation of organ assimilate demand is based on its potential organ growth according to its physiological age and on its biomass composition. Assimilate supply is estimated using the Monteith formalism and the Beer-Lambert law. A competition index (ratio between C supply and demand, Ic) is then computed at the plant level. Water deficit, as previously suggested (Combres et al., 2013), directly acts on the assimilation rate on thus leads to decrease Ic. The main originality of this model is to formalize the sequence and interdependency of yield elaboration processes each having its own sensitivity to plant nutritional status represented by Ic (Fig. 1A,B; Pallas et al., 2013). During these specific stages of sensitivity, probability laws are used to determine inflorescence status (aborted, female, male) according to Ic. Similarly, quantitative relationships are used to regulate other yield components depending on Ic (number of flowers per inflorescence, fruit-set). The probabilities linking the different inflorescence states and Ic are computed according to two parameters, Ic_slope : the regression slope between Ic during specific phases and the probability for producing female inflorescence (becoming productive) and Ic_int : the
320
intercept of the linear relationship between Ic and the probability for producing female inflorescence (Fig. 1B). These formalisms enable the model to simulate trade-offs between yield components at plant scale (competition among bunches) and at bunch scale (competition between fruit size and number). The model also simulates a reserve pool of carbon assimilate resulting from above mentioned source/sink balance.
Fig. 1. Sub-model for (A) yield component elaboration and (B) the probability to produce a female inflorescence.
MODEL VALIDATION The model was calibrated on a long-term
experiment (10 years) performed in Indonesia on a commercial hybrid (Pallas et al., 2013). This experiment enabled to calibrate the relationships between Ic and yield components as well as model parameters dealing with organ potential growth or phytomer production rate. The model was then validated on trees of the same genotype grown in the same environmental conditions but subjected to two pruning practices to artificially modify source/sink relations at tree level. For the trees under leaf pruning treatment (LPT) more than 50% of the leaves were pruned to decrease the source/sink ratio and for the trees under fruit pruning treatment (FPT) all bunches were removed to increase the source/sink ratio. Since the model is not deterministic, simulations were performed with the same number of trees than observed on the experimental plot (6 trees per treatment). As observed experimentally LPT decreased bunch production (simulated: -26%, observed: -21%) whereas bunch production was strongly increased for trees under FPT after the end of bunch ablation practices (simulated: +102%, observed: +189%) (Fig. 1A). No clear seasonal periodicity in bunch production was observed and simulated in this environment. This roughly continuous production mainly results from the absence of dry season in Indonesia that leads to reasonably constant seasonal carbon balance (Ic).
Fig. 2. Simulation of (A) bunch production per tree, (B) monthly index of competition and (C) whole reserve carbohydrate biomass per tree for the three treatments. LPT: leaf pruning treatment, FPT: fruit pruning treatment. Results are the average values of 6 simulated trees.
Simulation results showed strong impact of treatments on Ic (mean values = 1.03, 0.96 and 1.45 for Control, LPT and FPT) (Fig. 2B) and on the amount of carbohydrates in the reserve pool (Fig. 2C), the former showing strong temporal fluctuations. The average values of Ic as well as the relative differences in carbon reserve are close to that calculated on experimental data (Pallas et al., 2013). Both Ic and reserve pool simulations provide a conceptual validation of the model. Due to observed and simulated inter-tree variability of the variables related to carbohydrate balance a dynamic validation of the model is difficult at
A
B
2003 2005 2007 2009 2011 R es er v e car b o h y d rat e (kgC H2 O t ree -1 ) 0 50 100 150 200 A C Dates Inde x of c om pe ti ti on (Ic ) 0.0 0.5 1.0 1.5 2.0 B B unc h pr oduc ti on (kg t re e -1 m ont h -1 ) 0 10 20 30 40 A Control LPT FPT Treatments321
this stage. As a consequence model validation was also performed using final yield component variables. The model represents the impact of each treatment on the different yield components during the leaf pruning treatment period for trees under LPT or after the cessation of treatments for trees under FPT (Table 1). The variability of each yield component among trees and months is also represented (Fig. 3). The model was also able to simulate the evolution of fruit and leaf growth according to their age and the trade-offs between yield components especially between individual fruit weight and fruit number per bunch (not shown).
Table 1. Simulated and observed yield components for Control, LPT (leaf pruning treatment) and FPT (fruit pruning treatment). Results are the average values of 6 simulated trees.
Fig. 3. Simulated and observed coefficients of variation (Cv) for the 6 control trees during the experiments.
SENSITIVITY ANALYSIS AND GENETIC VARIABILITY A set of model sensitivity analyses were
performed to quantify yield sensitivity to each of its component. In particular, the impact of parameters
Ic_slope and Ic_int controlling the probability to
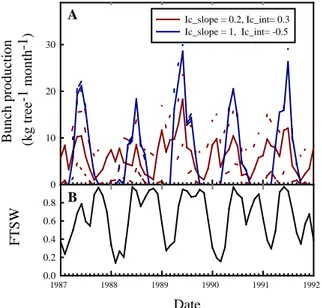
produce bunches according to Ic was tested to further analyse and explain existing genotypic differences in term of bunch production periodicity and intensity (Corley and Tinker, 2003). Meteorological data originated from Ivory Coast were used. In this zone, seasonal water deficit resulting in periodic low Ic values are observed (Fig. 4B). Both parameters (Ic_slope and Ic_int) displayed strong impact on inter-tree variability and thus plantation production periodicity (Fig. 4A). The model needs to be further validated on contrasted genotypes and environments to further explore traits of interest for oil-palm breeding in non-optimal cultivation zones.
Fig. 4 (A) Simulation of bunch production in Ivory Coast for two “virtual” genotypes with different sensitivity to Ic. Simulations were performed with 70 trees. Solid line is the mean value and dashed line is the standard deviation. (B) Evolution of the fraction of transpirable soil water.
LITERATURE CITED
Combres JC, Pallas B, Rouan L, Bonnal V, Mialet-Serra I, Caliman JP, Braconnier S, Soulié JC, Dingkuhn M. 2013. Simulation of inflorescence dynamics in oil palm and estimation of environment sensitive phenological
phases. A model based analysis. Functional Plant Biology 40: 263-279.
Corley RHV, Tinker PB. 2003. The oil palm, 4th edn. Oxford : Blackwell Science.
Kang M, Cournède PH, (de) Reffye P, Auclair D, Hu G. 2008. Analytical study of a stochastic plant growth model :
application of the GreenLab model. Mathematics and Computers in Simulation 78: 57-75.
Luquet D, Dingkuhn M, Kim H, Tambour L, Clement-Vidal A. 2006. EcoMeristem, a model of morphogenesis and
competition among sinks in rice. 1. Concept, validation and sensitivity analysis. Functional Plant Biology 33: 309-323.
Pallas B, Mialet-Serra I, Rouan L, Clément-Vidal A, Caliman JP, Dingkuhn M. 2013. Effect of trophic
competition on yield components, growth dynamics and structure of bunches in oil-palm (Elaeis guineensis). Tree
Physiology in press. A A B unc h pr oduc ti on (k g tr ee -1 m ont h -1) 0 10 20 30 Ic_slope = 0.2, Ic_int= 0.3 Ic_slope = 1, Ic_int= -0.5 Date 1987 1988 1989 1990 1991 1992 FT S W 0.0 0.2 0.4 0.6 0.8 A B