Publisher’s version / Version de l'éditeur:
Vous avez des questions? Nous pouvons vous aider. Pour communiquer directement avec un auteur, consultez la
première page de la revue dans laquelle son article a été publié afin de trouver ses coordonnées. Si vous n’arrivez
Questions? Contact the NRC Publications Archive team at
[email protected]. If you wish to email the authors directly, please see the first page of the publication for their contact information.
https://publications-cnrc.canada.ca/fra/droits
L’accès à ce site Web et l’utilisation de son contenu sont assujettis aux conditions présentées dans le site LISEZ CES CONDITIONS ATTENTIVEMENT AVANT D’UTILISER CE SITE WEB.
Research Report (National Research Council of Canada. Institute for Research in
Construction), 2011-05-13
READ THESE TERMS AND CONDITIONS CAREFULLY BEFORE USING THIS WEBSITE.
https://nrc-publications.canada.ca/eng/copyright
NRC Publications Archive Record / Notice des Archives des publications du CNRC :
https://nrc-publications.canada.ca/eng/view/object/?id=b001a3aa-0894-4046-a7d7-03c68300fa14 https://publications-cnrc.canada.ca/fra/voir/objet/?id=b001a3aa-0894-4046-a7d7-03c68300fa14
NRC Publications Archive
Archives des publications du CNRC
For the publisher’s version, please access the DOI link below./ Pour consulter la version de l’éditeur, utilisez le lien DOI ci-dessous.
https://doi.org/10.4224/20374366
Access and use of this website and the material on it are subject to the Terms and Conditions set forth at
Performance of Protected Ceiling/Floor Assemblies and Impact on
Tenability with a Basement Fire Scenario
Su, J. Z.; Taber, B. C.; Leroux, P.; Bénichou, N.; Lougheed, G. D.; Bwalya,
A. C.
http://www.nrc-cnrc.gc.ca/irc
Pe rform a nc e of Prot e c t e d Ce iling/Floor Asse m blie s a nd I m pa c t on
T e na bilit y w it h a Ba se m e nt Fire Sc e na rio
I R C - R R - 3 0 7
S u , J . Z . ; T a b e r , B . C . ; L e r o u x , P . ; B é n i c h o u ,
N . ; L o u g h e e d , G . D . ; B w a l y a , A . C .
M a y 2 0 1 1
The material in this document is covered by the provisions of the Copyright Act, by Canadian laws, policies, regulations and international agreements. Such provisions serve to identify the information source and, in specific instances, to prohibit reproduction of materials without written permission. For more information visit http://laws.justice.gc.ca/en/showtdm/cs/C-42
Les renseignements dans ce document sont protégés par la Loi sur le droit d'auteur, par les lois, les politiques et les règlements du Canada et des accords internationaux. Ces dispositions permettent d'identifier la source de l'information et, dans certains cas, d'interdire la copie de documents sans permission écrite. Pour obtenir de plus amples renseignements : http://lois.justice.gc.ca/fr/showtdm/cs/C-42
Performance of Protected
Ceiling/Floor Assemblies and
Impact on Tenability with A
Basement Fire Scenario
Research Report: IRC-RR-307
Date: May 13, 2011
Authors: Joseph Z. Su, Bruce C. Taber,
Patrice Leroux, Noureddine
Bénichou, Gary D. Lougheed, Alex
C. Bwalya
NRC INSTITUTE FOR RESEARCH IN CONSTRUCTION Fire Research Program
ACKNOWLEDGMENTS
The National Research Council Canada gratefully acknowledges the financial and technical support of the following organizations that provided valuable input to the research as the project consortium members:
• Canadian Automatic Sprinkler Association
• Canadian Wood Council/ Wood I-Joist Manufacturers Association • City of Calgary
• City of Edmonton • FPInnovations • Gypsum Association
• Ontario Ministry of Community Safety and Correctional Services/Office of the Fire Marshal • Ontario Ministry of Municipal Affairs and Housing
The authors would like to acknowledge G. Crampton, E. Gibbs, M. Ryan, M. Wright, S.
Muradori, J. Cingel, J. Henrie, R. Monette, R. Rombough who contributed to the construction of the test assemblies and assisted in conducting the fire tests.
EXECUTIVE SUMMARY
After the Phase-1 project of the Fire Performance of Houses (FPH), which had focused on the fire performance of unprotected floor assemblies above a basement and impact on occupant safety in single-family houses, a further study was conducted to investigate the fire performance of protected ceiling/floor systems in a basement fire scenario.
A series of full-scale fire experiments were conducted using four types of floor assemblies (wood I-joist, steel C-joist and metal-web wood truss assemblies, as well as solid-sawn wood joist assemblies), which were selected from the assemblies that had been tested in Phase 1 of the FPH research. The test assemblies were protected on the basement side with direct-applied regular gypsum board, residential sprinkler systems or a suspended ceiling. The study focused on the impact of the protection measures on the life safety of occupants from the perspective of tenability within the test house and structural integrity of floor systems for use as egress routes.
The experiments conducted using the test assemblies with regular gypsum board protection exhibited the same chronological sequence of fire events — fire initiation, smoke alarm activation, onset of untenable conditions, and finally structural failure of the test assemblies. The sequence was the same between the experiments conducted in this series of the full-scale fire experiments and also the same as the experiments conducted in Phase 1 of the FPH
research for the fire scenario with an open basement doorway. Smoke obscuration was the first hazard to arise. Untenable (incapacitation) conditions were reached shortly after smoke
obscuration. Compared to the experiments conducted in Phase 1 using the same floor structures without gypsum board protection, the times during which tenable conditions were maintained were similar or improved slightly whilst the structural performance was improved significantly with the gypsum-board-protected ceiling/floor assemblies. The times taken to reach structural failure for the gypsum-board-protected assemblies were much longer than those Phase 1 experiments with no protection. Also, with regular gypsum board protection, all test assemblies provided similar durations of structural fire endurance under the test fire scenario. The experiment using the test assembly with the suspended ceiling followed the same
sequence of fire events. However, the benefit of the suspended ceiling as a floor protection measure was marginal since the structural collapse of the test assembly was delayed only slightly and tenability conditions were similar to those found in Phase 1 tests of the same floor assembly without protection.
In the experiments with residential sprinkler-protected assemblies, the structural integrity of the test assemblies was protected, there was no structural failure or damage to the test assemblies in the test scenario and the fire was effectively suppressed. The residential sprinkler systems also maintained the conditions tenable in the test house during the experiments. Additional experiments were conducted with different and more challenging fuel package and fire location (a separate report RR-308 contains details and results of two such experiments [18]).
TABLE OF CONTENTS
ACKNOWLEDGMENTS ………i
EXECUTIVE SUMMARY ………. ii
LIST OF FIGURES ………v
LIST OF TABLES ………...viii
1 INTRODUCTION ... 1
1.1 Background ... 1
1.2 Objectives of the Research ... 1
2 EXPERIMENTS ... 1
2.1 Experimental Facility ... 1
2.2 Fuel Package ... 4
2.3 Fire Scenario ... 6
2.4 Protected Ceiling/Floor Assemblies Used ... 6
2.5 Instrumentation ... 7
2.6 Experimental Procedure ... 8
3 METHODOLOGY FOR TENABILITY ANALYSIS ... 8
3.1 Exposure to Toxic Gases ... 9
3.2 Exposure to Heat ... 10
3.3 Visual Obscuration by Smoke ... 10
4 RESULTS OF EXPERIMENTS AND ANALYSIS ... 11
4.1 Smoke Alarm Response ... 11
4.2 Solid-Sawn Wood Joist Assembly with Gypsum Protection – Test PF-01 ... 12
4.2.1 Construction Details of the Test Assembly ... 12
4.2.2 Fire Development in Basement ... 21
4.2.3 Visual Obscuration ... 22
4.2.4 Gas Measurements and Analysis (CO, CO2 and O2) ... 22
4.2.5 Temperature-Time Profiles on the Upper Storeys ... 24
4.2.6 Estimation of Time to Incapacitation ... 26
4.2.7 Performance of Test Assembly ... 26
4.2.8 Sequence of Events ... 29
4.3 Steel C-Joist Assembly with Gypsum Protection – Test PF-02 ... 29
4.3.1 Construction Details of the Test Assembly ... 29
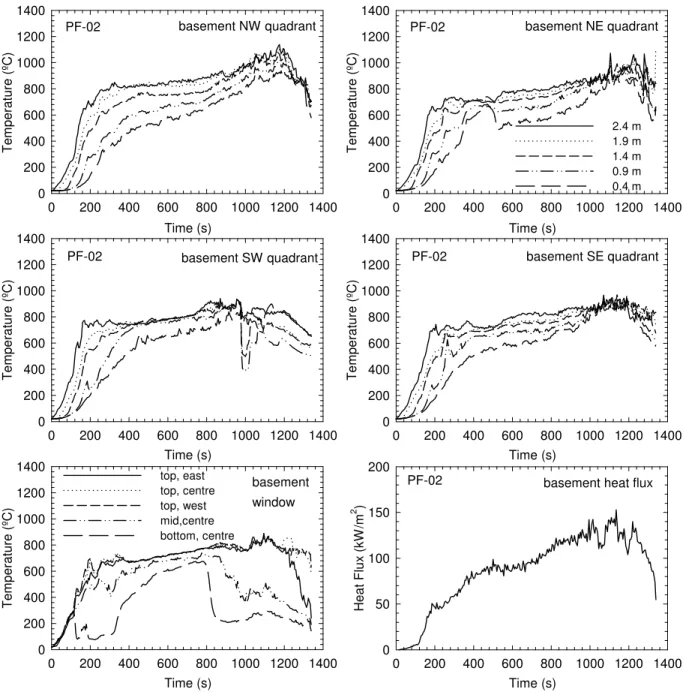
4.3.2 Fire Development in Basement ... 38
4.3.3 Visual Obscuration ... 39
4.3.4 Gas Measurements and Analysis (CO, CO2 and O2) ... 40
4.3.5 Temperature-Time Profiles on the Upper Storeys ... 42
4.3.6 Estimation of Time to Incapacitation ... 44
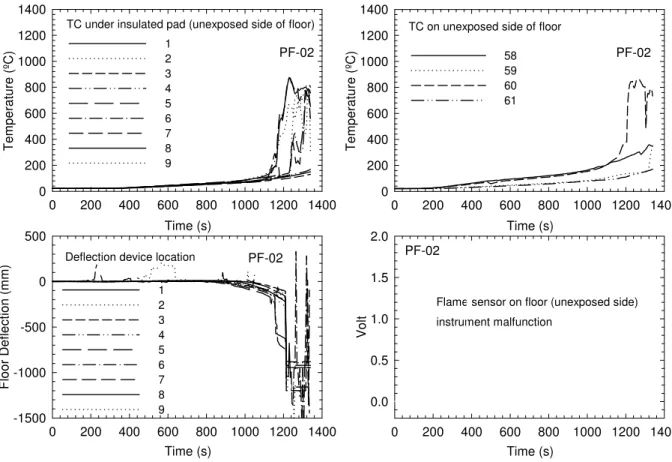
4.3.7 Performance of Test Assembly ... 44
4.3.8 Sequence of Events ... 47
4.4 Wood I-Joist Assembly with Gypsum Protection – Test PF-04 ... 47
4.4.1 Construction Details of the Test Assembly ... 47
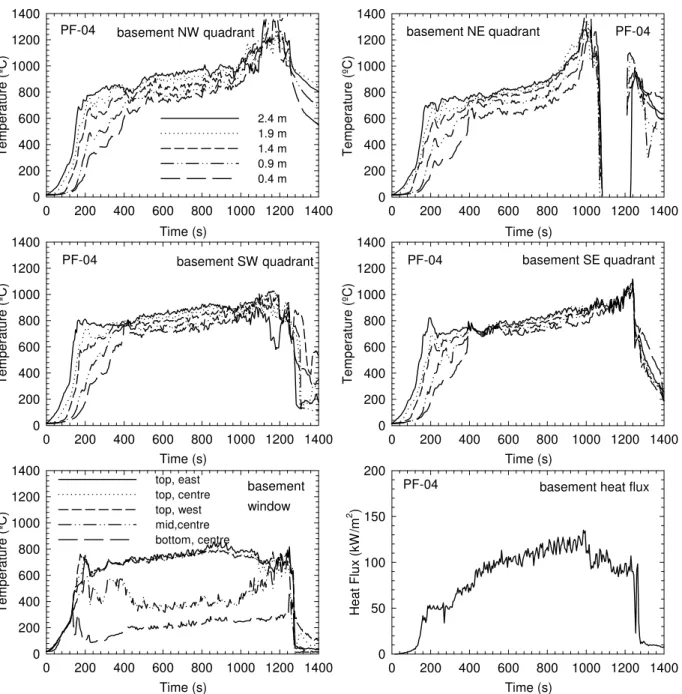
4.4.2 Fire Development in Basement ... 53
4.4.3 Visual Obscuration ... 54
4.4.4 Gas Measurements and Analysis (CO, CO2 and O2) ... 55
4.4.5 Temperature-Time Profiles on the Upper Storeys ... 57
4.4.6 Estimation of Time to Incapacitation ... 59
4.4.7 Performance of Test Assembly ... 59
4.4.8 Sequence of Events ... 61
4.5 Wood I-Joist Assembly with Suspended Ceiling – Test PF-05 ... 62
4.5.2 Construction Details of the Test Assembly ... 65
4.5.3 Fire Development in Basement ... 67
4.5.4 Visual Obscuration ... 68
4.5.5 Gas Measurements and Analysis (CO, CO2 and O2) ... 69
4.5.6 Temperature-Time Profiles on the Upper Storeys ... 71
4.5.7 Estimation of Time to Incapacitation ... 73
4.5.8 Performance of Test Assembly ... 73
4.5.9 Sequence of Events ... 75
4.6 Wood I-Joist Assembly with Residential Sprinkler Protection – Test PF-03 ... 76
4.6.1 Construction Details of the Test Assembly ... 76
4.6.2 Residential Sprinkler Design ... 77
4.6.3 Fire Development in Basement ... 80
4.6.4 Visual Obscuration ... 81
4.6.5 Gas Measurements and Analysis (CO, CO2 and O2) ... 82
4.6.6 Temperature-Time Profiles on the Upper Storeys ... 83
4.6.7 Performance of Test Assembly ... 84
4.6.8 Sequence of Events ... 86
4.7 Wood I-Joist Assembly with Residential Sprinkler Protection – Test PF-03B ... 87
4.7.1 Residential Sprinkler Design ... 87
4.7.2 Fire Development in Basement ... 90
4.7.3 Visual Obscuration ... 91
4.7.4 Gas Measurements and Analysis (CO, CO2 and O2) ... 92
4.7.5 Temperature-Time Profiles on the Upper Storeys ... 93
4.7.6 Performance of Test Assembly ... 94
4.7.7 Sequence of Events ... 96
4.8 Metal-Web Wood Truss Assembly with Residential Sprinkler Protection – Test PF-06 .. 97
4.8.1 Construction Details of the Test Assembly ... 97
4.8.2 Fire Development in Basement ... 104
4.8.3 Visual Obscuration ... 105
4.8.4 Gas Measurements and Analysis (CO, CO2 and O2) ... 106
4.8.5 Temperature-Time Profiles on the Upper Storeys ... 107
4.8.6 Performance of Test Assembly ... 108
4.8.7 Sequence of Events ... 110
4.9 Metal-Web Wood Truss Assembly with Gypsum Protection – Test PF-06C ... 111
4.9.1 Fire Development in Basement ... 114
4.9.2 Visual Obscuration ... 115
4.9.3 Gas Measurements and Analysis (CO, CO2 and O2) ... 116
4.9.4 Temperature-Time Profiles on the Upper Storeys ... 118
4.9.5 Estimation of Time to Incapacitation ... 120
4.9.6 Performance of Test Assembly ... 120
4.9.7 Sequence of Events ... 123
5 SUMMARY AND CONCLUSIONS ... 123
LIST OF FIGURES
Figure 1. The test facility ... 2
Figure 2. Facility plan view ... 3
Figure 3. Fuel package ... 4
Figure 4. Layout of the fuel package ... 5
Figure 5. Solid-Sawn wood joist layout details (PF-01) ... 13
Figure 6. Details of end connection, supports, cross bracing and joist overlap (PF-01) ... 14
Figure 7. OSB subfloor layout (PF-01, PF-03, PF-03B, PF-04 and PF-05) ... 15
Figure 8. Subfloor nail pattern and nail description (PF-01) ... 16
Figure 9. Gypsum board layout on the assembly as the basement ceiling (PF-01)... 17
Figure 10. Gypsum board screw layout (PF-01, PF-04 and PF-06C) ... 18
Figure 11. Thermocouples locations in PF-01 assembly ... 19
Figure 12. Thermocouples locations reflecting the different sections shown in Figure 11 (Test PF-01) ... 20
Figure 13. Loading blocks and deflection measurement points on the unexposed side of the assembly ... 20
Figure 14. Temperatures and heat flux in the basement fire room in Test PF-01 ... 21
Figure 15. Smoke optical density measurements in Test PF-01 ... 22
Figure 16. CO, CO2 and O2 concentrations in Test PF-01 ... 23
Figure 17. Temperatures on the first storey in Test PF-01 ... 24
Figure 18. Temperatures on the second storey in Test PF-01 ... 25
Figure 19. Temperatures in floor cavities in Test PF-01 ... 27
Figure 20. Temperatures, deflections and flame sensor on the unexposed side of the assembly on the first storey in Test PF-01 ... 28
Figure 21. Steel C-joist layout details (PF-02) ... 30
Figure 22. Details of end connection and joist overlap (PF-02) ... 31
Figure 23. Blocking-in details (PF-02) ... 32
Figure 24. Subfloor layout (PF-02) ... 33
Figure 25. Subfloor screw pattern and screw description (PF-02) ... 34
Figure 26. Gypsum board layout on the assembly as the basement ceiling (PF-02)... 35
Figure 27. Gypsum board screw layout for steel C-joist assembly (PF-02) ... 36
Figure 28. Thermocouples locations in PF-02 assembly ... 37
Figure 29. Thermocouples locations in the different sections shown in Figure 28 (PF-02) ... 38
Figure 30. Temperatures and heat flux in the basement fire room in Test PF-02 ... 39
Figure 31. Smoke optical density measurements in Test PF-02 ... 40
Figure 32. CO, CO2 and O2 concentrations in Test PF-02 ... 41
Figure 33. Temperatures on the first storey in Test PF-02 ... 42
Figure 34. Temperatures on the second storey in Test PF-02 ... 43
Figure 35. Temperatures in floor cavities in Test PF-02 ... 45
Figure 36. Temperatures, deflections and flame sensor on the unexposed side of the assembly on the first storey in Test PF-02 ... 46
Figure 37. Wood I-joist layout details for Tests PF-03, PF-03B, PF-04 and PF-05 ... 48
Figure 38. Details of end connection and supports for Test PF-04 (gypsum protection) ... 49
Figure 39. Gypsum board layout on basement ceiling (Tests PF-04 and PF-06C) ... 50
Figure 40. Subfloor nail pattern (Tests PF-03, PF-03B, PF-04 and PF-05) ... 51
Figure 41. Thermocouples locations (Tests PF-03, PF-03B, PF-04 and PF-05) ... 52
Figure 42. Thermocouples installed in the sections shown in Figure 41 (Test PF-04) ... 53
Figure 43. Temperatures and heat flux in the basement fire room in Test PF-04 ... 54
Figure 44. Smoke optical density measurements in Test PF-04 ... 55
Figure 46. Temperatures on the first storey in Test PF-04 ... 57
Figure 47. Temperatures on the second storey in Test PF-04 ... 58
Figure 48. Temperatures in floor cavities in Test PF-04 ... 60
Figure 49. Temperatures, deflections and flame sensor on the unexposed side of the assembly on the first storey in Test PF-04 ... 61
Figure 50. Temperature profiles in intermediate-scale tests for selection of suspended ceiling 64 Figure 51. Details of end connection and supports for Test PF-05 (suspended ceiling) ... 65
Figure 52. Mineral fibre panel layout as suspended ceiling (Test PF-05) ... 66
Figure 53. Thermocouples installed in the sections shown in Figure 41 (Test PF-05) ... 67
Figure 54. Temperatures and heat flux in the basement fire room in Test PF-05 ... 68
Figure 55. Smoke optical density measurements in Test PF-05 ... 69
Figure 56. CO, CO2 and O2 concentrations in Test PF-05 ... 70
Figure 57. Temperatures on the first storey in Test PF-05 ... 71
Figure 58. Temperatures on the second storey in Test PF-05 ... 72
Figure 59. Temperatures in floor cavities in Test PF-05 ... 74
Figure 60. Temperatures, deflections and flame sensor on the unexposed side of the assembly on the first storey in Test PF-05 ... 75
Figure 61. Thermocouples in the sections shown in Figure 41 (Tests PF-03 and PF-03B only) ... 77
Figure 62. Sprinkler locations related to wood I-joists and fuel in Test PF-03 ... 78
Figure 63. Sprinkler and CPVC piping installation with exposed wood I-joists in Test PF-03 .... 79
Figure 64. Temperatures on sprinklers and wood cribs in the fire room in Test PF-03 ... 80
Figure 65. Temperatures and heat flux in the basement fire room in Test PF-03 ... 81
Figure 66. Smoke optical density measurements in Test PF-03 ... 82
Figure 67. CO, CO2 and O2 concentrations in Test PF-03 ... 82
Figure 68. Temperatures on the first storey in Test PF-03 ... 83
Figure 69. Temperatures on the second storey in Test PF-03 ... 84
Figure 70. Temperatures in floor cavities in Test PF-03 ... 85
Figure 71. Temperatures, deflections and flame sensor on the unexposed side of the assembly on the first storey in Test PF-03 ... 86
Figure 72. Sprinkler location related to wood I-joists and fuel in Test PF-03B... 88
Figure 73. Sprinkler and CPVC piping relative to exposed wood I-joists and fuel (Test PF-03B) ... 89
Figure 74. Temperatures at sprinkler and wood cribs in the fire room in Test PF-03B ... 90
Figure 75. Temperatures and heat flux in the basement fire room in Test PF-03B ... 91
Figure 76. Smoke optical density measurements in Test PF-03B ... 92
Figure 77. CO, CO2 and O2 concentrations in Test PF-03B ... 92
Figure 78. Temperatures on the first storey in Test PF-03B ... 93
Figure 79. Temperatures on the second storey in Test PF-03B ... 94
Figure 80. Temperatures in floor cavities in Test PF-03B ... 95
Figure 81. Temperatures, deflections and flame sensor on the unexposed side of the assembly on the first storey in Test PF-03B ... 96
Figure 82. Metal-web wood truss assembly and relative locations for sprinkler and fuel in Test PF-06 ... 98
Figure 83. Metal-web wood truss assembly and sprinkler in Test PF-06... 99
Figure 84. Details of end connection and supports for Test PF-06 (sprinkler protection) ... 100
Figure 85. OSB subfloor layout (Tests PF-06 and PF-06C)... 101
Figure 86. Subfloor screw pattern (Tests PF-06 and PF-06C)... 102
Figure 87. Thermocouples locations (Tests PF-06 and PF-06C)... 103
Figure 90. Temperatures and heat flux in the basement fire room in Test PF-06 ... 105
Figure 91. Smoke optical density measurements in Test PF-06 ... 106
Figure 92. CO, CO2 and O2 concentrations in Test PF-06 ... 106
Figure 93. Temperatures on the first storey in Test PF-06 ... 107
Figure 94. Temperatures on the second storey in Test PF-06 ... 108
Figure 95. Temperatures in floor cavities in Test PF-06 ... 109
Figure 96. Temperatures, deflections and flame sensor on the unexposed side of the assembly on the first storey in Test PF-06 ... 110
Figure 97. Metal-web wood truss layout details for Tests PF-06 and PF-06C ... 112
Figure 98. Details of end connection and supports for Test PF-06C (gypsum protection) ... 113
Figure 99. Thermocouples installed in the sections shown in Figure 87 (Test PF-06C only) .. 114
Figure 100. Temperatures and heat flux in the basement fire room in Test PF-06C ... 115
Figure 101. Smoke optical density measurements in Test PF-06C ... 116
Figure 102. CO, CO2 and O2 concentrations in Test PF-06C ... 117
Figure 103. Temperatures on the first storey in Test PF-06C ... 118
Figure 104. Temperatures on the second storey in Test PF-06C ... 119
Figure 105. Temperatures in floor cavities in Test PF-06C... 121
Figure 106. Temperatures, deflections and flame sensor on the unexposed side of the assembly on the first storey in Test PF-06C ... 122
LIST OF TABLES
Table 1. Fuel Quantities in Experiments ... 5
Table 2. Fire Tests with Protected Ceiling/Floor Assemblies ... 7
Table 3. Smoke Alarm Activation Times after Ignition ... 11
Table 4. Time to the Smoke Optical Density Limit in Test PF-01 ... 22
Table 5. Time to the Specified FED for Exposure to O2 Vitiation, CO2 and CO in Test PF-01 ... 23
Table 6. Time to the Specified FED for Exposure to Convected Heat in Test PF-01 ... 25
Table 7. Summary of Estimation of Time to Specified FED and OD for Test PF-01 ... 26
Table 8. Summary of Sequence of Events in Test PF-01 ... 29
Table 9. Time to the Specified FED for Exposure to O2 Vitiation, CO2 and CO in Test PF-02 ... 41
Table 10. Time to the Specified FED for Exposure to Convected Heat in Test PF-02 ... 43
Table 11. Summary of Estimation of Time to Specified FED and OD for Test PF-02... 44
Table 12. Summary of Sequence of Events in Test PF-02 ... 47
Table 13. Time to the Smoke Optical Density Limit in Test PF-04 ... 55
Table 14. Time to the Specified FED for Exposure to O2 Vitiation, CO2 and CO in Test PF-04 .. 56
Table 15. Time to Specified FED for Exposure to Convected Heat in Test PF-04 ... 58
Table 16. Summary of Estimation of Time to Specified FED and OD for Test PF-04... 59
Table 17. Summary of Sequence of Events in Test PF-04 ... 62
Table 18. Intermediate Scale Furnace Results for Ceiling Materials ... 64
Table 19. Time to the Smoke Optical Density Limit in Test PF-05 ... 69
Table 20. Time to the Specified FED for Exposure to O2 Vitiation, CO2 and CO in Test PF-05 .. 70
Table 21. Time to the Specified FED for Convected Heat in Test PF-05... 72
Table 22. Summary of Estimation of Time to Specified FED and OD for Test PF-05... 73
Table 23. Summary of Sequence of Events in Test PF-05 ... 76
Table 24. Summary of Sequence of Events in Test PF-03 ... 87
Table 25. Summary of Sequence of Events in Test PF-03B ... 97
Table 26. Summary of Sequence of Events in Test PF-06 ... 111
Table 27. Time to the Smoke Optical Density Limit in Test PF-06C ... 116
Table 28. Time to the Specified FED for O2 Vitiation, CO2 and CO in Test PF-06C ... 117
Table 29. Time to the Specified FED for Convected Heat in Test PF-06C ... 119
Table 30. Summary of Estimation of Time to Specified FED and OD for Test PF-06C ... 120
Table 31. Summary of Sequence of Events in Test PF-06C ... 123
PERFORMANCE OF PROTECTED CEILING/FLOOR ASSEMBLIES AND IMPACT ON TENABILITY WITH A BASEMENT FIRE SCENARIO
Joseph Z. Su, Bruce C. Taber, Patrice Leroux, Noureddine Bénichou, Gary D. Lougheed, Alex C. Bwalya
1 INTRODUCTION
1.1 Background
National Research Council Canada’s Institute for Research in Construction (NRC-IRC) has been conducting a multiphase research project on the fire performance of houses (FPH). One of the primary objectives of the research is to determine the impact of products and systems used in construction of single-family houses on life safety of occupants under fire conditions. The recently completed Phase 1 of the FPH research [1-7] was undertaken in response to a request from the Canadian Commission on Building and Fire Codes and the Canadian Commission on Construction Materials Evaluation to gain better understanding of the factors that affect the life safety of occupants in the event of a fire. The Phase-1 study focused on basement fires and their impacts on the structural integrity of unprotected floor assemblies above a basement and tenability conditions on upper storeys in the test house. A range of floor systems available in the marketplace was used in the Phase-1 research.
After the Phase-1 study, a group of industrial and governmental bodies expressed an interest in pursuing further studies to investigate the performance of protected floor systems and the effect of different protection measures on tenability conditions. In response, NRC-IRC’s Fire
Research (FR) Program formed a consortium to undertake the further studies (Phase 1b). This report documents the Phase-1b research project.
1.2 Objectives of the Research
A series of full-scale fire experiments were conducted in an experimental facility representing a typical two-storey detached single-family house with protected ceiling/floor assemblies above the basement under a basement fire scenario. The objectives of this consortium project are:
1. To study the fire performance of ceiling/floor systems protected by measures such as regular gypsum board, residential sprinkler systems or suspended ceiling; and
2. To understand the impact of the protection measures on the tenability conditions for occupants on the upper storeys.
3. To determine the sequence of events such as fire initiation, smoke alarm activation, onset of untenable conditions, and structural failure.
2 EXPERIMENTS
2.1 Experimental Facility
The experimental facility used represented a typical two-storey detached single-family house with a basement. Figure 1 and Figure 2 show an elevation view and a plan view, respectively, of the facility with basement, first storey and second storey. Each storey had a floor area of
95 m2 and a ceiling height of 2.4 m. There was no heating, ventilating and air-conditioning or plumbing system installed in the test house, i.e., no associated mechanical openings.
The basement was partitioned to create a fire room representing a 27.6 m2 basement living area
(the remaining area was not used during the experiments). This was the average size of basement rooms based on survey results [8]. A rectangular exterior opening measuring 2.0 m wide x 0.5 m high and located 1.8 m above the floor was provided in the south wall of the fire room. The size of the opening is equivalent to the area of two typical basement windows (1.0 x 0.5 m). A removable noncombustible panel was used to cover the opening at the beginning of each experiment. The walls of the fire room were lined with 12.7-mm-thick regular gypsum board.
A 0.91-m-wide x 2.05-m-high doorway opening located on the north wall of the fire room led into an empty stairwell enclosure (without a staircase). At the top of this stairwell, a 0.81-m-wide x 2.05-m-high doorway led into the first storey. This doorway leading to the first storey either had a door in the closed position (closed basement doorway) or had no door (open basement doorway), depending on the scenario being studied. There is no requirement for a basement door in the National Building Code of Canada (NBCC) [9].
The first storey had an open-plan layout. A test ceiling/floor assembly was constructed directly above the fire room for each experiment (more details are provided in Sections 4.2 - 4.9). The remainder of the floor on the first storey was constructed out of noncombustible materials. A 0.89-m-wide x 2.07-m-high doorway led to the exterior. The staircase to the second storey was not enclosed. There were no window openings on the first storey.
The second storey was partitioned to contain bedrooms, which were connected by a corridor (measuring 4.45 m long x 1.10 m wide). The experiments involved two target bedrooms of the same size. The door of the southeast bedroom remained closed whereas the door on the southwest bedroom was kept open. Each bedroom doorway was 0.81 m wide x 2.05 m high. There were no window openings on the second storey.
For the first and second storeys, cement board covered the walls, and the ceilings were covered with 12.7-mm-thick regular gypsum board.
2.2 Fuel Package
A simple and repeatable fuel package, which had been developed for Phase 1 of the FPH research [10, 11], was used in the full-scale experiments. This fuel package consisted of a mock-up sofa constructed with 9 kg of exposed polyurethane foam (PUF), the dominant combustible constituent of upholstered furniture, and 190 kg of wood cribs beside and underneath the mock-up sofa. A photograph of the fuel package is shown in Figure 3.
The mock-up sofa was constructed with 6 blocks of flexible polyurethane foam (with a density of
32.8 kg/m3) placed on a metal frame. Each block was 610 mm long x 610 mm wide and
100 mm or 150 mm thick. The 150-mm-thick foam blocks were used for the backrest and the 100-mm-thick foam blocks for the seat cushion. The PUF was used without any upholstery fabric that is used in typical upholstered furniture.
The wood cribs were made with spruce lumber pieces, each piece measuring 38 mm x 89 mm x 800 mm. For the small cribs located under the mock-up sofa, four layers with six pieces per layer were used. The other two cribs used eight layers.
The placement of the fuel package in the basement fire room is illustrated in Figure 4. The fuel quantity used in each experiment is listed in Table 1. The mock-up sofa was located at the center of the floor area. The mock-up sofa was ignited in accordance with the ASTM 1537 test protocol [12] and the wood cribs provided the remaining fire load to sustain the fire for the desired period of time. This fuel package provided a relatively-severe, fast-growing basement fire with a very reproducible fire exposure [10, 11, 13].
Figure 4. Layout of the fuel package (all dimensions in mm)
Table 1. Fuel Quantities in Experiments (kg)
Test Foam Crib Bs Crib Bh Crib N + Crib S Moisture Content
of Cribs PF-01 (March 19, 2009) 9.31 63.2 62.7 32.1 + 30.7 6% PF-02 (May 6, 2009) 9.32 63.2 63.5 31.2 + 30.9 6% PF-03 (Sep. 24, 2009) 9.25 64.5 63.4 33.3 + 33.0 10% PF-03B (Oct. 8, 2009) 9.27 64.1 65.2 33.7 + 32.2 8% PF-04 (Jan. 28, 2010) 9.30 61.3 61.0 31.3 + 31.3 6% PF-05 (April 14, 2010) 9.53 59.8 62.4 32.1 + 31.9 7% PF-06 (June 1, 2010) 9.66 65.7 65.7 32.8 + 32.1 7% PF-06C (Sep. 14, 2010) 9.57 63.3 64.9 32.9 + 32.3 8%
2.3 Fire Scenario
The fire scenario used in the experiments was one of the scenarios used in Phase 1 of the FPH research [7, 13]. In this scenario, the doorway from the first storey to the open stairwell to the basement fire room had no door. Since there is no requirement for a basement door in the NBCC, this scenario was considered the code minimum. On the second storey, the door to the southwest bedroom was open and the door to the southeast bedroom was closed.
The exterior window opening in the basement fire room and the exterior door on the first storey were initially closed. The mock-up sofa was ignited using a gas burner in accordance with the ASTM 1537 test protocol [12]. The noncombustible panel that covered the fire room’s exterior window opening was manually removed if and when the temperature measured at the top-center of the opening reached 300°C. This would provide the ventilation air required for combustion and simulate the fire-induced breakage and complete fall-out of the window glass. To simulate occupants evacuating the test house, the exterior door on the first storey was opened at 180 s after ignition and left open.
It is acknowledged that this fire scenario does not represent a frequent household fire scenario. The fire scenario was used in the project to provide a reasonable challenge to the structural integrity of the test ceiling/floor assembly above the basement.
2.4 Protected Ceiling/Floor Assemblies Used
Table 2 shows the ceiling/floor systems used in the full-scale fire experiments with the open basement doorway fire scenario. The four types of assemblies were selected from the assemblies that had been tested in Phase 1 of the FPH research [1-7]. The test floor
assemblies were constructed in the same way as in Phase 1 of the FPH research but the floor assemblies were protected on the basement side with regular gypsum board, residential
sprinkler systems or a suspended ceiling. There were discussions on other protection systems, e.g., spray on insulation, and the consortium decided not to pursue these further, given a fixed number of tests.
For each experiment, a ceiling/floor assembly was constructed on the first storey directly above the 5.3 m long x 5.2 m wide basement fire room. A single layer of oriented strandboard (OSB) was used for the subfloor of all assemblies without additional floor finishing materials on the test assemblies since there are no specific requirements for floor finishing materials atop an OSB subfloor in the NBCC. This was considered the code minimum and reduced the number of experimental variables.
Each assembly selected for testing was designed on the basis of an imposed load of 1.90 kPa, self-weight of 0.5 kPa and the span of the basement room. For the assemblies using solid-sawn wood joists and steel C-joists, the maximum allowable design spans for those members under residential occupancy loading resulted in the use of an intermediate support beam. For the wood I-joist and metal-web wood truss assemblies, they were designed and constructed to span the full width of the room, which resulted in them being at or near to their maximum allowable design span.
In the experiments, actual loading was applied on the test assembly, as follows: the self-weight (dead load) of the assembly, plus an imposed load (live load) of 0.95 kPa (i.e., half of the imposed load of 1.90 kPa prescribed by the NBCC [9] for residential occupancies). This was based on the fact that in a fire situation, only part of the imposed load is available. This was also consistent with a number of international standards (Eurocode [14], New Zealand and Australian standards [15, 16], and ASCE [17]). The total imposed load applied to the test assembly was 25 kN (i.e., 0.95 kPa multiplied by the floor area) using uniformly distributed concrete blocks.
A primary fire test was conducted with each ceiling/floor assembly. For those ceiling/floor assemblies that survived the primary tests, where possible, the floor/ceiling systems were refitted for secondary fire tests such as tests of another protection configuration, or tests of another protection system (a secondary test was denoted by a letter after the test number, as shown in Table 2). Specific details of the design and construction of the protected assemblies are provided in Sections 4.2 - 4.9.
Table 2. Fire Tests with Protected Ceiling/Floor Assemblies (open basement doorway)
Assemblies Protection Primary test Protection Secondary test
Solid-sawn wood joist
(235 mm depth) Gypsum PF-01 (March 19, 2009) - - Steel C-joist (203 mm depth) Gypsum PF-02 (May 6, 2009) - - Wood I-joist* (302 mm depth) Sprinkler (2 sprinklers) PF-03 (Sep. 24, 2009) Sprinkler (1 sprinkler) PF-03B (Oct. 8, 2009) Wood I-joist (302 mm depth) Gypsum PF-04 (Jan. 28, 2010) - - Wood I-joist (302 mm depth) Suspended Ceiling PF-05 (April 14, 2010) - -
Metal-web wood truss* (302 mm depth) Sprinkler (1 sprinkler) PF-06 (June 1, 2010) Gypsum PF-06C (Sep. 14, 2010) Notes:
1. The wood I-joist were referred as wood I-joist A in Phase 1 of the FPH research;
2. *Additional secondary tests with the residential sprinkler system were conducted for these test assemblies (see a separate report for details [18]).
2.5 Instrumentation
Extensive thermocouple arrays were installed in the test house to measure temperatures. Vertical arrays of thermocouples (at heights of 0.4, 0.9, 1.4, 1.9 and 2.4 m above the floor) were located at the four quarter points of the fire room, basement doorway, four quarter points on the first storey, centre of the corridor on the second storey, and centre of the two bedrooms on the second storey.
Thermocouples were installed at the basement exterior opening to monitor the temperature. A heat flux meter was installed on the west wall (near the centre, 2.05 m above the floor) in the fire room.
Extensive thermocouple arrays were also installed on the test assemblies, including
thermocouples on the unexposed side of the assemblies and in the floor cavities. In addition, flame-sensing devices [19] and floor deflection devices [20] were installed on the unexposed surface of the test assemblies. The floor deflection was measured at nine locations on the test assembly. The flame-sensing device was placed at the central tongue-and-groove joint of the subfloor.
Smoke and gas measurements focused on upper storeys with four gas sampling locations. On the first storey, gas sampling ports were located at the southwest quarter point at 0.9 m and 1.5 m above the floor. On the second storey, gas sampling ports were located at the centre of the corridor at 0.9 m and 1.5 m above the floor. Gas samples from these sampling locations
were connected to nondispersive infrared CO/CO2 gas analyzers, O2 gas analyzers and smoke
density meters.
Residential ionization and photoelectric smoke alarms were installed on each level and in each bedroom, which were powered by batteries and were not interconnected (new smoke alarms were used in each experiment).
Airflow velocities at the various openings and the differential pressure between the fire room and the first storey were also measured but are not included in this report. This data may be useful for fire modeling purposes in the future.
2.6 Experimental Procedure
The mock-up sofa was ignited in accordance with the ASTM 1537 test protocol [12] and data was collected at 5 s intervals throughout each test.
The noncombustible panel that covered the fire room’s exterior window opening during the initial stage of each test was manually removed if the temperature measured at the top-center of the opening reached 300°C. The removal of the panel simulated the fire-induced breakage and complete fall-out of the window glass and provided the ventilation air necessary for combustion. The exterior door on the first storey was opened in each test at 180 s after ignition and left open, simulating a situation where some occupants, who would have been in the test house, escaped leaving the exterior door open while other occupants may still have been inside the house. A test was terminated after structural failure of any part of the test assembly or after a predetermined test duration (20~30 minutes), whichever came first.
3 METHODOLOGY FOR TENABILITY ANALYSIS
Heat, narcotic and irritant gases, and smoke produced from fires can individually or collectively create conditions that are potentially untenable for occupants. An approach based on ISO
been fully described in reports on Phase 1 of the FPH research [1-7]. The objective of the tenability analysis was to estimate the time available for occupants to escape from a fire before the onset of incapacitating conditions.
The fractional effective dose (FED) was calculated using measured data on potential heat and gas exposure to determine the time available for escape. The calculated time available for escape depends not only on the time-dependent temperatures, concentrations of combustion gas products and density of smoke in the test house, but also on the characteristics of
occupants. This report presents the results of the analysis for two typical FED values: FED = 1 and FED = 0.3.
The time available for escape calculated based on FED = 1 represents the time available for a healthy adult of average susceptibility. To examine the effect on a more susceptible person, the threshold can be lower, e.g. FED=0.3, and the time available for escape would be shorter than for an average healthy adult. The time available for escape associated with other FED values can also be calculated, if required.
The location of the occupant in the test house has an effect on the time available for escape. The analysis focused on the fire conditions affecting tenability, as measured on the first and second storeys of the test facility, and the impact on any occupant assumed to be present at the time of ignition. The tenability analysis focused on potential impact on any occupants on the upper storeys of the test house. The conditions in the basement fire room are not survivable once flashover occurs.
Heat, combustion gas products and smoke obscuration are treated as acting independently on the occupant to create incapacitating conditions and the time available for escape is the shortest of the times estimated from consideration of exposure to combustion gas products, heat and visual obscuration.
3.1 Exposure to Toxic Gases
The tenability analysis on gas exposure involved CO and CO2 and oxygen vitiation only, since
flaming combustion of polyurethane foam and wood cribs primarily produced toxic carbon
monoxide (CO) and asphyxiant carbon dioxide (CO2) in a vitiated oxygen (O2) environment.
Given the amount of polyurethane foam in the fuel package and the volume of the test house, hydrogen cyanide (HCN) produced from the combustion of polyurethane foam would not reach a concentration of concern for occupant life safety. The fuel package contained no chemical components that would produce acid halides in the combustion gases.
Detailed analysis indicated that the toxic effect of CO would be capable of causing
incapacitation at an earlier time than the effect of O2 vitiation and the asphyxiant effect of CO2.
The fractional effective dose for incapacitation due to CO was calculated using the approach given in ISO TS 13571 for short exposure to CO at high concentrations [21]:
∑
⋅
Δ
=
2 1 2)
5
%
exp(
35000
]
[
t tCO
t
CO
FED
where [CO] is the inhaled carbon monoxide concentration in parts per million, Δt (minutes) is the
incapacitation dose for the CO exposure, and exp(%CO2/5) is a CO2-induced hyperventilation
factor for breathing [21, 22]. The uncertainty in the calculation of FED due to the CO exposure is estimated to be ±40% [21].
3.2 Exposure to Heat
The rate of convected heat transfer from hot gases to the skin depends on temperature,
ventilation, humidity of the enclosure and clothing over the skin [22]. For hot air at temperatures above 120°C and with water vapour of less than 10%, pain and skin burns would be likely to occur in a few minutes. Assuming unclothed or lightly clothed subjects, the fractional effective dose for incapacitation due to the convected heat exposure was calculated using the following equation [21, 22]:
t
T
FED
t tΔ
×
=
∑
2 1 7 4 . 310
5
where T (°C) is the temperature and Δt (minute) is the discrete increment of time (i.e. the time
interval for data sampling). The uncertainty in the calculation of FED due to convected heat is estimated to be ±25%. Since there was temperature stratification, the temperatures at the 1.4 m height from the floor were used for the analysis of convected heat exposure on each storey, as this is the height of the nose/mouth of an average-height individual.
Radiant heat is important when the hot smoke layer is over 200°C, which corresponds to the
threshold radiant heat flux of 2.5 kW⋅m-2
to produce second degree burning of skin [23]. The calculation indicated that the convected heat exposure would result in incapacitation before the radiant heat began to play a major role on the first and second storeys. Convected heat was the most important source of heat exposure for occupants on the first and second storeys for the fire scenarios used.
3.3 Visual Obscuration by Smoke
Visual obscuration by the optically-dense smoke tended to be the first hazard to arise that could impede evacuation by the occupants. Although visual obscuration would not directly cause incapacitation, it would cause delays in movement by the occupants and thus prolong their exposure to other hazards. Visibility through smoke and the optical density of smoke are related (the visibility is proportional to the reciprocal of the OD for non-irritating smoke, for example) [24]. In this report, the smoke obscuration is expressed as the optical density per
meter (OD in m-1):
⎟
⎠
⎞
⎜
⎝
⎛
=
I
I
L
OD
0 10log
1
where I0 is the intensity of the incident light, I is the intensity of the light transmitted through the
path length, L (m), of the smoke. The optical density is related to the extinction coefficient
k (m-1) by OD = k/2.303.
the minimum visible brightness difference between an object and its background is used to estimate the smoke obscuration limit at which occupants cannot see their hands in front of their faces (a distance of 0.5 m or less). These calculations indicate that occupants cannot see their
hands in front of their faces and become disoriented at an optical density of 3.4 m-1. For an
occupant whose vision is impaired, this can happen at an optical density of 2 m-1 or lower.
Psychological effects of smoke on occupants may accelerate the loss of visibility [24]. Possible reduction of time to untenable smoke level due to psychological effect is not addressed in this
report. A tenability limit of ODLimit = 2 m-1 is used in this study.
4 RESULTS OF EXPERIMENTS AND ANALYSIS
This section provides the results of measurements and analysis, a summary of the findings of the performance of protected ceiling/floor assemblies and the effect of the protection measures on tenability conditions.
4.1 Smoke Alarm Response
Table 3 shows the activation times of the smoke alarms installed in the test facility. There was a significant delay for the smoke alarms in the second storey to activate, compared to the smoke alarm in the basement fire room. This highlights the importance of having the smoke alarms interconnected to activate simultaneously when one of them detects a fire.
Table 3. Smoke Alarm Activation Times (in seconds) After Ignition
Location Basement fire room 1st storey 2nd storey corridor 2nd storey SW bedroom (door open) 2nd storey SE bedroom (door closed) Smoke alarm type P 2 I 3 P 4 I 5 P 6 I 9 P 10 I 7 P 8 Test PF-01 27 37 57 102 112 117 127 242 282 Test PF-02 30 45 55 110 125 145 140 235 265 Test PF-03 45 95 105 175 175 210 na na na Test PF-03B 34 79 94 196 176 na na na na Test PF-04 30 40 55 115 125 140 na 235 255 Test PF-05 47 67 87 127 137 147 na 267 282 Test PF-06 55 85 95 185 195 360 410 na na Test PF-06C 30 75 90 140 145 150 160 220 250 Notes:
1. I: Ionization P: Photoelectric na: no activation;
2. The ionization smoke alarm was not installed in the basement fire room to avoid dealing with radioactive materials in the cleanup of debris after fire tests.
4.2 Solid-Sawn Wood Joist Assembly with Gypsum Protection – Test PF-01
Test PF-01 was conducted using a solid-sawn wood joist assembly with direct-applied regular gypsum board on the exposed side (gypsum board ceiling in the fire room).
4.2.1 Construction Details of the Test Assembly
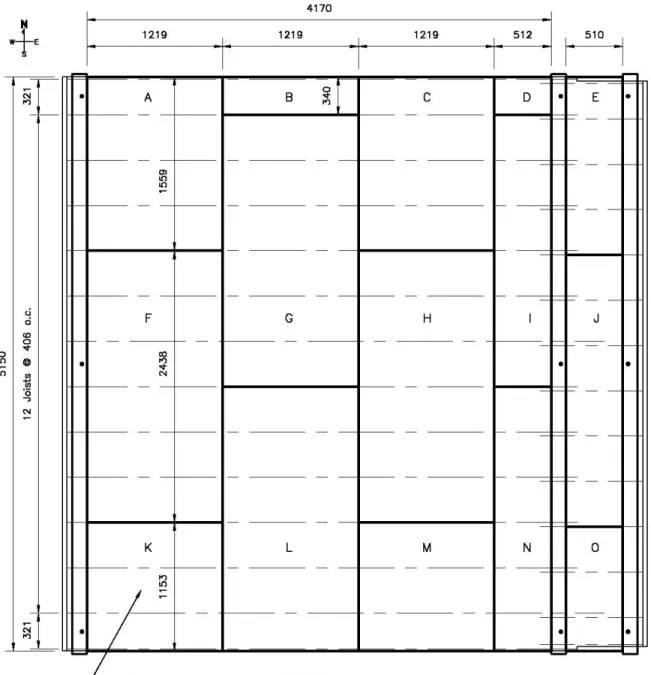
The overall dimensions of the solid-sawn wood joist assembly were 5250 mm x 5150 mm. Specific dimensions of the components of the assembly are provided in Figure 5 to Figure 10. The solid-sawn wood joists were manufactured using spruce-pine-fir (SPF) lumber bearing a grade-stamp 'No.2 and better'. The structural members were 235 mm deep x 38 mm wide (nominal 2” x 10”), and were spaced at 400 mm on centre (Figure 5). The joist span length was 4.17 m (Figure 5) based on the span tables of the NBCC [9]. This corresponds to the maximum span allowed for wood floor joists of SPF lumber graded as 'No.2 and better', and constructed with cross-bridging mid-span and the joists spaced at 400 mm o.c. Since the maximum span allowed for the solid-sawn wood joists was shorter than the length of the fire room, a beam was used as an intermediate support at the end of the 4.17-m span and a set of shorter joists were used to increase the span of the floor to extend to the end of the fire room.
The test assembly was supported by three horizontal steel beams, each of which was supported by two steel columns. The beams were bolted to the columns, which were stiffened by steel bars and rested stably on the floor under the weight of the test assembly and steel beams. Figure 6 shows the details of the joint overlap and the supporting steel beams, as well as the end connection. Ceramic fibre blankets were used to fill any gaps between the assembly and the end walls. Ceramic fibre blankets were also used to protect the steel beams and columns so that they were not subjected to fire and would not fail during the test.
Rim boards (headers) made of solid lumber that were 38 mm thick x 235 mm deep, were placed at the east and west sides of the test assemblies as shown in Figure 5. One row of diagonal wood cross-bracing, 38 mm thick x 38 mm wide, was placed at the centre of the longer span of the assembly between the joists. Details of the cross-bracing and its location within the joist layout for the above-mentioned assembly are shown in Figure 5 and Figure 6.
Figure 6. Details of end connection, supports, cross-bracing and joist overlap (PF-01) (all
OSB was used as the subfloor material in the test assembly. The specific OSB material used was selected based on a separate study documented in reference [28]. The subfloor panels were 15.1 mm thick, with a full panel size of 1.2 x 2.4 m. The longer panel edges had a tongue-and-groove profile while the short panel edges were square butt ends. Figure 7 shows the layout of the subfloor. The nailing pattern and description of nails used to attach the OSB panels to the solid-sawn wood joists and rim board (header) are shown in Figure 8.
Figure 7. OSB subfloor layout (PF-01, PF-03, PF-03B, PF-04 and PF-05) (all dimensions in
Figure 9. Gypsum board layout on the assembly as the basement ceiling (PF-01) (all
dimensions in mm)
Regular gypsum board was installed on the basement side of the ceiling/floor assembly by being fastened directly to the bottom of the joists. The gypsum board was 12.7 mm thick, with a full sheet size of 1.2 x 2.4 m. Figure 9 shows the layout of the gypsum board on the assembly. The joints of the gypsum board were finished with joint compound and tape. The screw pattern and description of screws used to fasten the gypsum board to the solid-sawn wood joists and rim board (header) are shown in Figure 10.
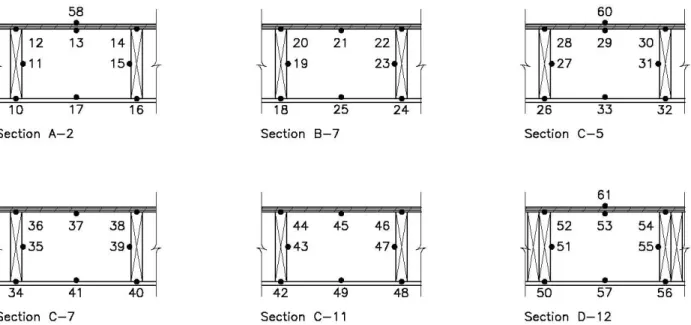
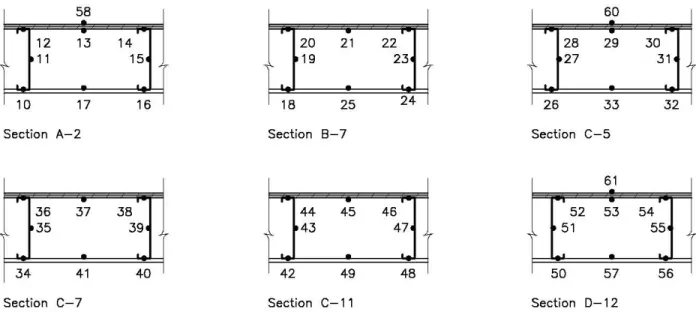
Sixty-one Type K (20 gauge) chromel-alumel thermocouples, with a thickness of 0.91 mm, were used for measuring temperatures at a number of locations throughout the assembly. The thermocouples were located on the unexposed side and in the cavities of the assembly as shown in Figure 11 and Figure 12. These locations were chosen to monitor the conditions of the assembly at critical locations during the fire tests.
Figure 12. Thermocouples locations reflecting the different sections shown in Figure 11
(Test PF-01)
The floor deflection was measured at 9 points. The measurement technique utilized 9 rods that were touching the tops of 9 concrete blocks placed on the unexposed surface of the test assembly at the locations shown as circles in Figure 13. This ensured that the downward movement of the subfloor was monitored during the fire exposure. The deflections were recorded using an electro-mechanical method described in Reference [20].
N
Figure 13. Loading blocks and deflection measurement points on the unexposed side of the
4.2.2 Fire Development in Basement
Figure 14 shows the temperatures measured in the basement fire room. The polyurethane foam used for the mock-up sofa dominated the initial fire growth. The temperatures at the window quickly reached 300°C and the noncombustible window covering panel was removed at 97 s. The temperatures at the 2.4 m height exceeded 600°C within 140 s, indicating that the fire room reached flashover conditions. The fast development of the fire from ignition to attainment of the first temperature peak was consistent with the experiments in Phase 1 of FPH research.
Following this initial stage of fire growth, the fire became wood-crib-dominated. There was a quick transition from a well-ventilated flaming fire to an under-ventilated fire. (Note that the significant temperature drop in the NW quadrant around 1000 s was unknown.) Figure 14 also shows the heat flux measured at the west wall (near the centre, 2.05 m above the floor). The
maximum heat flux was 150 kW·m-2, indicating post-flashover conditions in the fire room.
Figure 14. Temperatures and heat flux in the basement fire room in Test PF-01 basement NE quadrant Time (s) 0 200 400 600 800 1000 1200 1400 T empera tur e (º C ) 0 200 400 600 800 1000 1200 1400 2.4 m 1.9 m 1.4 m 0.9 m 0.4 m basement SE quadrant Time (s) 0 200 400 600 800 1000 1200 1400 T e m p erat ur e (º C ) 0 200 400 600 800 1000 1200 1400
basement heat flux
Time (s) 0 200 400 600 800 1000 1200 1400 H e at Fl ux ( kW /m 2 ) 0 50 100 150 200 PF-01 PF-01 PF-01 basement NW quadrant Time (s) 0 200 400 600 800 1000 1200 1400 T e m p erat ur e (º C ) 0 200 400 600 800 1000 1200 1400 basement SW quadrant Time (s) 0 200 400 600 800 1000 1200 1400 T empe rat ur e ( ºC ) 0 200 400 600 800 1000 1200 1400 basement window Time (s) 0 200 400 600 800 1000 1200 1400 T empe rat ur e ( ºC ) 0 200 400 600 800 1000 1200 1400 top, east top, centre top, west mid,centre bottom, centre PF-01 PF-01
4.2.3 Visual Obscuration
The optical density was measured at 0.9 and 1.5 m heights (simulating the height of the
nose/mouth of an average height individual crawling and standing, respectively) above the floor
on the first and second storeys. Table 4 shows the times to reach OD = 2 m-1. Figure 15 shows
the optical density-time profiles. It must be pointed out that the video records show no signs of decrease in the optical density after the first peak, indicating that the smoke density meters started the self purging cycle. The smoke density meter has an operation temperature limit of 80°C in its gas chamber; when this temperature is reached, the flow is reversed to cool the chamber to protect the electronic components. The smoke meter resumes operation once the gas chamber is cooled down below 80°C. In this experiment, only the initial part of the curves (up to the first peaks) represents valid measurements.
Table 4. Time (in seconds) to the Smoke Optical Density Limit in Test PF-01
Test PF-01 1st storey SW quadrant 2nd storey corridor
OD = 2 m-1 2 m-1
1.5 m above floor 192 257
0.9 m above floor 212 237
Figure 15. Smoke optical density measurements in Test PF-01
4.2.4 Gas Measurements and Analysis (CO, CO2 and O2)
Figure 16 shows the CO, CO2 and O2 concentration-time profiles measured at the southwest
quarter point on the first storey and at the centre of the corridor on the second story during the
experiment. Within approximately 400 s, oxygen was diminished to below 10% and CO2
increased to above 10%, which could cause incapacitation and lead to rapid loss of
consciousness due to lack of oxygen alone or due to the CO2 asphyxiant effect alone [22]. The
concentrations were below 5% O2 and above 16% CO2 near the end of the experiment. Note
that two gas analyzers used had an upper limit of 10% for CO2 measurements and one gas
analyzer used had an upper measurement limit of 1% CO. All other gas analyzers had higher measurement limits. 2nd storey corridor Time (s) 0 200 400 600 800 1000 1200 1400 S m oke O p ti cal D ensi ty ( O D /m) -1 0 1 2 3 4 5 6 1.5 m 0.9 m PF-01 1st storey SW quadrant Time (s) 0 200 400 600 800 1000 1200 1400 S m oke O pti cal D ensi ty (O D /m ) -1 0 1 2 3 4 5 6 1.5 m 0.9 m PF-01
The tenability analysis indicated that the toxic effect of CO would be capable of causing
incapacitation at an earlier time than the effect of O2 vitiation and the asphyxiant effect of CO2.
The times to reach the specified FED for exposure to O2 vitiation, CO2 and CO are shown in
Table 5.
Figure 16. CO, CO2 and O2 concentrations in Test PF-01
Table 5. Time (in seconds) to the Specified FED for Exposure to O2 Vitiation, CO2 and CO in
Test PF-01
Fractional Effective Dose FED = 0.3 FED = 1.0
CO alone – 1st storey 337 922
CO with CO2 hyperventilation – 1st storey 272±20 352±30
Low O2 hypoxia – 1st storey 557 947
CO alone – 2nd storey corridor 357 967
CO with CO2 hyperventilation – 2nd storey corridor 297±20 377±30
Low O2 hypoxia – 2nd storey corridor 592 977
High CO2 hypercapnia – 1st storey 412 527
High CO2 hypercapnia – 2nd storey corridor 432 552
Note:
1. Values determined using concentrations at 1.5 m height.
Time (s) 0 200 400 600 800 1000 1200 1400 CO ( % ) 0 1 2 3 4 5 6 7 PF-01 Time (s) 0 200 400 600 800 1000 1200 1400 O2 (% ) 0 5 10 15 20 1st storey, 1.5 m 1st storey, 0.9 m 2nd storey, 1.5 m 2nd storey, 0.9 m Time (s) 0 200 400 600 800 1000 1200 1400 CO 2 (%) 0 5 10 15 20 PF-01 PF-01
4.2.5 Temperature-Time Profiles on the Upper Storeys
Figure 17 and Figure 18 show temperature profiles measured on the first and second storeys during the experiment. The temperatures depended on the locations inside the test house. In the bedroom with the door closed, the temperatures never exceeded 60°C during the
experiment.
Figure 17. Temperatures on the first storey in Test PF-01
1st storey NE quadrant Time (s) 0 200 400 600 800 1000 1200 1400 T em perat ure (º C ) 0 200 400 600 800 1000 1200 2.4 m 1.9 m 1.4 m 0.9 m 0.4 m 1st storey SE quadrant Time (s) 0 200 400 600 800 1000 1200 1400 T em per a ture (º C ) 0 200 400 600 800 1000 1200
exterior door (outside)
Time (s) 0 200 400 600 800 1000 1200 1400 T em per ature (º C ) 0 200 400 600 800 1000 1200 PF-01 PF-01 PF-01 1st storey NW quadrant Time (s) 0 200 400 600 800 1000 1200 1400 T em perat ure ( ºC ) 0 200 400 600 800 1000 1200 1st storey SW quadrant Time (s) 0 200 400 600 800 1000 1200 1400 T em perat ure (º C ) 0 200 400 600 800 1000 1200 doorway to basement Time (s) 0 200 400 600 800 1000 1200 1400 T em per a ture (º C ) 0 200 400 600 800 1000 1200 PF-01 PF-01 PF-01
Figure 18. Temperatures on the second storey in Test PF-01
The convective heat exposure depended on the location in the test house. In the closed
bedroom, heat exposure would not cause incapacitation. On the first storey, in the corridor or in the open bedroom on the second storey, the calculated times to incapacitation due to exposure
to the convected heat are given in Table 6 for FED= 0.3 and 1. The calculated times to reach
the heat incapacitation doses on the first storey were shorter than those for CO exposure; the time difference for FED to change from 0.3 to 1.0 due to the heat exposure was also shorter than that for CO exposure. In the corridor on the second storey, the calculated times to reach the incapacitation doses for heat exposure were slightly longer than those for CO exposure.
Table 6.Time (in seconds) to the Specified FED for Convected Heat in Test PF-01
Fractional Effective Dose FED = 0.3 FED = 1.0
1st storey SE quadrant 242 292
1st storey SW quadrant 242±10 287±15
1st storey NE quadrant 257 312
1st storey NW quadrant 257 317
2nd storey corridor 317±15 407±25
2nd storey open bedroom 472 697
2nd storey closed bedroom not reached
(FED<0.06)
not reached (FED<0.06) Note:
1. Values determined using temperatures at 1.4 m height.
2nd storey corridor Time (s) 0 200 400 600 800 1000 1200 1400 T e m perature (º C ) 0 100 200 300 400 2.4 m 1.9 m 1.4 m 0.9 m 0.4 m
2nd storey closed bedroom
Time (s) 0 200 400 600 800 1000 1200 1400 T e m perature (º C) 0 100 200 300 400 PF-01 PF-01 2nd storey open bedroom
Time (s) 0 200 400 600 800 1000 1200 1400 T e m perature (º C) 0 100 200 300 400 PF-01
4.2.6 Estimation of Time to Incapacitation
Table 7 summarizes the results of tenability analysis with the estimated times to the onset of various conditions for Test PF-01. Smoke obscuration was the first hazard to arise. The calculated time for reaching the specific FED either due to the heat exposure or due to the CO
exposure (exacerbated by CO2-induced hyperventilation), whichever occurred first, is listed in
Table 7. Heat exposure reached the specific FED on the first storey at times shorter than for CO exposure. On the second storey (in the corridor), CO exposure reached the specific FED earlier than heat exposure. The time difference for heat exposure and CO exposure to reach the specific FED was not significant. Note that for the closed bedroom on the second storey, based on the temperatures and the heat exposure calculation, the conditions in the closed bedroom would not reach untenable conditions.
Table 7. Summary of Estimation of Time to Specified FED and OD (in seconds) for Test PF-01
Test
OD = 2 m-1 FED = 0.3 FED = 1
1st storey 2nd storey 1st storey 2nd storey 1st storey 2nd storey
PF-01 192±5 257±5 242±10 297±20 287±15 377±30
Notes:
1. Values determined using the measurements at 1.5 m height (for gas concentrations and OD) or 1.4 m height (for temperatures);
2. The number with the Italic typeface represents the calculated time for reaching the CO incapacitation dose, while the number in bold represents the calculated time for reaching the heat incapacitation dose, whichever occurred first.
4.2.7 Performance of Test Assembly
A floor system provides an egress route for occupants and its structural integrity directly impacts the safe evacuation of the occupants from the house during a fire emergency. During the fire experiment, the conditions of the test assembly were monitored.
Figure 19 shows temperatures in the cavities of the test assembly. The thermocouples installed in the six sections of the floor cavities aimed to monitor the temperatures inside the cavities and provide an indication of the effectiveness of the gypsum board protection for the test assembly. The time when the temperatures in the floor cavities begun approaching the fire room
temperature indicated likely opening of cracks and subsequent fall off of the gypsum membrane protection for the floor structure. This happened from about 700 s to 1100 s depending on the position. This was accompanied by a slow but regular increase in room temperatures in the basement (Figure 14), which was likely a result of an increase in the burning rate due to the additional fuel from ignited areas of the test assembly that were left exposed to the fire as portions of the gypsum ceiling fell off. Visual observation confirmed that small gypsum pieces started falling from the centre of the ceiling shortly after 700 s, followed by larger gypsum pieces falling off after 800 s. Subsequently, the fire started to involve the joists and subfloor.
Figure 19. Temperatures in floor cavities in Test PF-01
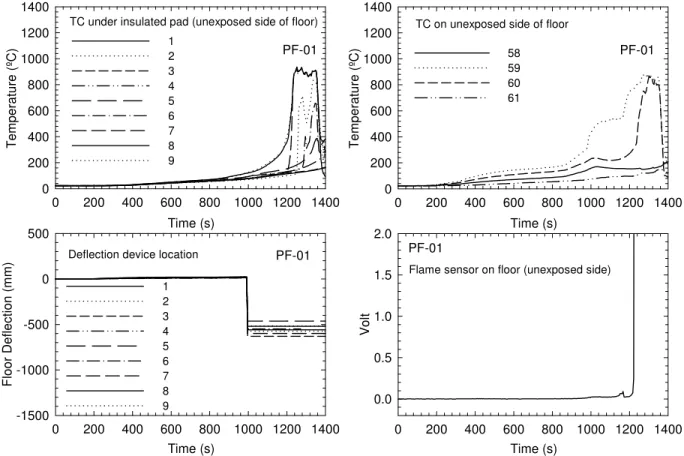
Figure 20 shows results of the measurements using thermocouples, flame-sensing devices and deflection devices on the unexposed side the test assembly on the first storey.
The deflection of the ceiling/floor assembly was measured at nine points located in the central area of the test assembly just above the fuel package where the impact of the fire on the assembly was anticipated to be the greatest. The test assembly reached the maximum deflection capacity of the measurement devices at 1000 s prior to its structural failure. The temperature measurements by nine thermocouples under insulated pads on top of the subfloor (on the first storey) are consistent with the measurements in the standard
fire-resistance test with respect to thermocouple type, installation and layout [29]. A rapid
TC in floor cavity B-7 Time (s) 0 200 400 600 800 1000 1200 1400 T emp era tur e (º C ) 0 200 400 600 800 1000 1200 1400 18 19 20 21 22 23 24 25 TC in floor cavity C-7 Time (s) 0 200 400 600 800 1000 1200 1400 T empe rat ur e (º C ) 0 200 400 600 800 1000 1200 1400 34 35 36 37 38 39 40 41 TC in floor cavity D-12 Time (s) 0 200 400 600 800 1000 1200 1400 T empe rat ur e (º C ) 0 200 400 600 800 1000 1200 1400 50 51 52 53 54 55 56 57 PF-01 PF-01 PF-01
TC in floor cavity A-2
Time (s) 0 200 400 600 800 1000 1200 1400 T empe rat ur e (º C ) 0 200 400 600 800 1000 1200 1400 10 11 12 13 14 15 16 17 TC in floor cavity C-5 Time (s) 0 200 400 600 800 1000 1200 1400 T emper at ur e (º C ) 0 200 400 600 800 1000 1200 1400 26 27 28 29 30 31 32 33 TC in floor cavity C-11 Time (s) 0 200 400 600 800 1000 1200 1400 T emper at ur e ( ºC ) 0 200 400 600 800 1000 1200 1400 42 43 44 45 46 47 48 49 PF-01 PF-01 PF-01
increase in temperature indicates that the test assembly was significantly breached. The subsequent rapid decrease in temperature was due to the termination of the experiment by extinguishing the fire with water. It is worth mentioning that on the basis of temperature, failure under standard fire-resistance test conditions is defined as a temperature rise of 140°C on average of the nine padded thermocouples or a temperature rise of 180°C at any single point. Based on this criterion, the floor failure time would be 1100 s (single-point temperature rise of 180°C). Four bare thermocouples were also installed on the unexposed side of the test assembly for temperature measurements.
The flame-sensing device [19] at the central tongue-and-groove joint on the unexposed side of the OSB subfloor provided detection of flame penetration through the test assembly. Figure 20 shows a noticeable voltage signal after 1000 s and a large voltage spike after 1230 s, indicating that the device was detecting flames that had penetrated the test assembly. Flame penetration of the test assembly is also a failure criterion in standard fire-resistance testing [29].
Figure 20. Temperatures, deflections and flame sensor on the unexposed side of the assembly
on the first storey in Test PF-01
Although the failure time of the test assembly could be slightly different using other criterion, visual observation through the window opening of the fire room confirmed that structural failure occurred at 1320 s. After this time, the test assembly lost function as an egress route. The fire consumed the OSB subfloor in many areas, particularly in areas directly above the fuel
package. Several concrete blocks, which were used to apply loading to the test assembly, fell through the subfloor. There was a partial collapse of the test assembly with one floor joist consumed by the fire. Most other solid-sawn wood joists although significantly charred,
TC on unexposed side of floor
Time (s) 0 200 400 600 800 1000 1200 1400 T e mperatu re (º C) 0 200 400 600 800 1000 1200 1400 58 59 60 61
Flame sensor on floor (unexposed side)
Time (s) 0 200 400 600 800 1000 1200 1400 Vo lt 0.0 0.5 1.0 1.5 2.0 PF-01 PF-01
TC under insulated pad (unexposed side of floor)
Time (s) 0 200 400 600 800 1000 1200 1400 T e mperature (º C) 0 200 400 600 800 1000 1200 1400 1 2 3 4 5 6 7 8 9
Deflection device location
Time (s) 0 200 400 600 800 1000 1200 1400 F loor Defle c tion (m m) -1500 -1000 -500 0 500 1 2 3 4 5 6 7 8 9 PF-01 PF-01