HAL Id: hal-01678518
https://hal.archives-ouvertes.fr/hal-01678518
Submitted on 18 Jul 2020
HAL is a multi-disciplinary open access
archive for the deposit and dissemination of
sci-entific research documents, whether they are
pub-lished or not. The documents may come from
teaching and research institutions in France or
abroad, or from public or private research centers.
L’archive ouverte pluridisciplinaire HAL, est
destinée au dépôt et à la diffusion de documents
scientifiques de niveau recherche, publiés ou non,
émanant des établissements d’enseignement et de
recherche français ou étrangers, des laboratoires
publics ou privés.
Seasonal erosion and restoration of the dust cover on
comet 67P/Churyumov-Gerasimenko as observed by
OSIRIS onboard Rosetta
Xuanyu Hu, Xian Shi, Holger Sierks, Marco Fulle, J. Blum, H. U. Keller,
Ekkehard Kührt, Björn Davidsson, C. Güttler, B. Gundlach, et al.
To cite this version:
Xuanyu Hu, Xian Shi, Holger Sierks, Marco Fulle, J. Blum, et al.. Seasonal erosion and
restora-tion of the dust cover on comet 67P/Churyumov-Gerasimenko as observed by OSIRIS onboard
Rosetta. Astronomy and Astrophysics - A&A, EDP Sciences, 2017, 604, A114 (31 p.).
�10.1051/0004-6361/201629910�. �hal-01678518�
DOI:10.1051/0004-6361/201629910 c ESO 2017
Astronomy
&
Astrophysics
Seasonal erosion and restoration of the dust cover on comet
67P/Churyumov-Gerasimenko as observed by OSIRIS
onboard Rosetta
X. Hu
1, 2,∗, X. Shi
1, H. Sierks
1, M. Fulle
3, J. Blum
2, H. U. Keller
2, E. Kührt
4, B. Davidsson
5, C. Güttler
1,
B. Gundlach
2, M. Pajola
6, D. Bodewits
7, J.-B. Vincent
1, N. Oklay
1, M. Massironi
8, S. Fornasier
9, C. Tubiana
1,
O. Groussin
10, S. Boudreault
1, S. Höfner
1, S. Mottola
4, C. Barbieri
11, P. L. Lamy
12, R. Rodrigo
13, 14, D. Koschny
15,
H. Rickman
16, 17, M. A’Hearn
7, J. Agarwal
1, M. A. Barucci
9, J.-L. Bertaux
18, I. Bertini
19, G. Cremonese
8,
V. Da Deppo
20, S. Debei
21, M. De Cecco
22, J. Deller
1, M. R. El-Maarry
23, 24, A. Gicquel
1, P. Gutierrez-Marques
1,
P. J. Gutiérrez
25, M. Hofmann
1, S. F. Hviid
4, W.-H. Ip
26, L. Jorda
10, J. Knollenberg
4, G. Kovacs
1, J.-R. Kramm
1,
M. Küppers
27, L. M. Lara
25, M. Lazzarin
11, J. J. Lopez-Moreno
25, F. Marzari
11, G. Naletto
28, 19, 20, and N. Thomas
23, 29(Affiliations can be found after the references) Received 15 October 2016/ Accepted 4 April 2017
ABSTRACT
Context.Dust deposits or dust cover are a prevalent morphology in the northern hemi-nucleus of comet 67P/Churyumov-Gerasimenko (67P). The evolution of the dust deposits was captured by the OSIRIS camera system onboard the Rosetta spacecraft having escorted the comet for over two years. The observations shed light on the fundamental role of cometary activity in shaping and transforming the surface morphology.
Aims.We aim to present OSIRIS observations of surface changes over the dust deposits before and after perihelion. The distribution of changes and a timeline of their occurrence are provided. We perform a data analysis to quantify the surface changes and investigate their correlation to water activity from the dust deposits. We further discuss how the results of our investigation are related to other findings from the Rosetta mission. Methods. Surface changes were detected via systematic comparison of images, and quantified using shape-from-shading technique. Thermal models were applied to estimate the erosion of water ice in response to the increasing insolation over the areas where surface changes occurred. Modeling results were used for the interpretation of the observed surface changes.
Results.Surface changes discussed here were concentrated at mid-latitudes, between about 20◦
N and 40◦
N, marking a global transition from the dust-covered to rugged terrains. The changes were distributed in open areas exposed to ample solar illumination and likely subject to enhanced surface erosion before perihelion. The occurrence of changes followed the southward migration of the sub-solar point across the latitudes of their distribution. The erosion at locations of most changes was at least about 0.5 m, but most likely did not exceed several meters. The erosive features before perihelion had given way to a fresh, smooth cover of dust deposits after perihelion, suggesting that the dust deposits had been globally restored by at least about 1 m with ejecta from the intensely illuminated southern hemi-nucleus around perihelion, when the north was inactive during polar night.
Conclusions.The erosion and restoration of the northern dust deposits are morphological expressions of seasonality on 67P. Based on observations and thermal modeling results, it is inferred that the dust deposits contained a few percent of water ice in mass on average. Local inhomogeneity in water abundance at spatial scales below tens of meters is likely. We suspect that dust ejected from the deposits may not have escaped the comet in bulk. That is, at least half of the ejected mass was afloat in the inner-coma or/and redeposited over other areas of the nucleus.
Key words. comets: general – comets: individual: 67P/Churyumov-Gerasimenko
1. Introduction
The brief revisit to the comet 9P/Tempel 1 by the spacecraft Stardust-NExT in 2011 led to the discovery of various changes on the nucleus surface that had occurred over a period of almost six years following the exploration by the Stardust-NExT’s pre-decessor Deep Impact (A’Hearn et al. 2005;Thomas et al. 2013; Veverka et al. 2013). The receding scarps, several smoothed crater rims, and possible local variations in the contrast of sur-face albedo, would represent the most intriguing and, yet, the only direct observations of cometary surface modifications prior to the Rosetta mission.
Since the rendezvous of Rosetta with the comet
67P/Churyumov-Gerasimenko (hereafter 67P) in mid 2014, the Optical, Spectroscopic, and Infrared Remote Imaging
∗
Corresponding author: X. Hu, e-mail: hu@mps.mpg.de
System (OSIRIS) onboard the spacecraft had been observing the comet at unprecedented spatial and temporal resolutions (Keller et al. 2007; Sierks et al. 2015). The observations pro-vided critical constraints in determining the physical properties of the bi-lobed, dusty nucleus (Sierks et al. 2015;Pätzold et al. 2016), and enabled detailed morphological characterization of the surface (Thomas et al. 2015b) as well as realistic thermal analysis on the activity of 67P (Keller et al. 2015). Parts of the nucleus have been recurrently observed in detail. Various surface changes on 67P had been noted before its perihelion passage. A prominent case occurred in the smooth terrains of Imhotep1
from late May to early July, 2015, where multiple quasi-circular,
1 The definition and description of geomorphological regions on 67P
are given inThomas et al. (2015b) andEl-Maarry et al. (2015). The reader is also referred toAuger et al.(2015) for details of the regional morphologies in Imhotep.
fast-expanding features were observed that probably indicate migrating scarps due to continuous collapse or removal of the top multi-meter thick surface layer (Groussin et al. 2015). Mov-ing escarpments of possibly comparable propagatMov-ing pattern and speed were detected in Hapi (Davidsson et al., in prep.), which had been among the first visibly active areas of the nucleus since mid 2014 (Lara et al. 2015;Lin et al. 2015).
In the eyes of OSIRIS, hints of surface changes on 67P were abundant and multiplying as the comet approached perihelion. A number of “honeycomb” features, distinguished by ensembles of small depressions of a few decimeters in width, were detected in late March 2015 in the Ma’at region (Shi et al. 2016a). These features resided within the formerly smooth dust deposits, and likely indicate a change in macroscopic surface roughness over time. It is possible that the honeycombs had resulted from accu-mulated erosion in the dust deposits due to previous activities, for example, sublimation of water ice, in the course of a few months. Given the prevalence of dust deposits in the northern hemi-nucleus of 67P, this possibility stands as a strong motiva-tion for expanding the scrutiny over the nucleus for other similar but often subtle indications of surface changes.
This work is an exposition of the various types of surface changes associated with the dust deposits observed on 67P be-fore perihelion. The discussions are organized as follows. In Sect.2, we present temporal comparisons of morphological ob-servations indicative of changes over time. In Sect. 3, we per-form a photometric analysis of observations to authenticate and quantify the surface changes as a probable consequence of ero-sion. In Sect.4, a thermal model is applied to analyze the role of intensifying insolation in triggering or facilitating the dust ero-sion via water outgassing. We discuss the global distribution of the observed surface changes in Sect.5; in particular, we argue that the erosion and restoration of the dust deposits are a mor-phological expression of seasonality on 67P. The implications of the surface changes studied here are discussed in Sect.6in con-nection with some key findings from other instruments onboard Rosetta. Finally, our conclusions are summarized in Sect.7.
2. Observation
2.1. OSIRIS observation of honeycomb features during late March flyby
The Rosetta spacecraft performed a flyby around 67P on March 28, 2015. During the close encounter, the Narrow Angle Cam-era (NAC) of OSIRIS was able to collect a series of images with pixel resolutions2of 0.5 m or better within 30 km from the cen-ter of nucleus. The images revealed the presence of some distinct yet unfamiliar surface features in several morphological regions in the northern hemi-nucleus3. Most of these features can be
eas-ily distinguished as macroscopically rough patches ranging in size from dozens up to hundreds of meters (Fig. 1). Each ap-pears to be densely indented or pitted in texture. Although the indentations lack the hexagonal shape and regular arrangement, these patches are reminiscent of the cellular structure of honey-combs on decimeter to meter scales (Shi et al. 2016a). The hon-eycomb texture here can be loosely generalized as a resolved surface roughness or topography in contrast with the surround-ing smooth texture with random and more uniform roughness.
2 Unless otherwise noted, pixel resolution in the present discussion is
referred to the nucleus surface (TableA.1).
3 Information on all the images used in this work is given in
Ap-pendixA.
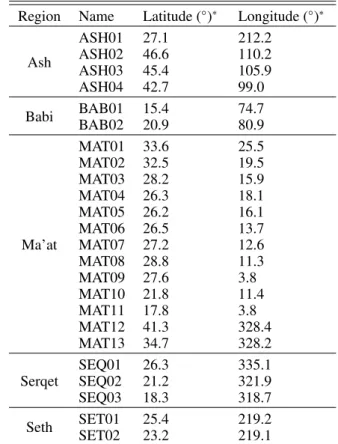
Table 1. List of honeycomb features observed by OSIRIS cameras dur-ing the late March flyby in 2015.
Region Name Latitude (◦)∗ Longitude (◦)∗
Ash ASH01 27.1 212.2 ASH02 46.6 110.2 ASH03 45.4 105.9 ASH04 42.7 99.0 Babi BAB01 15.4 74.7 BAB02 20.9 80.9 Ma’at MAT01 33.6 25.5 MAT02 32.5 19.5 MAT03 28.2 15.9 MAT04 26.3 18.1 MAT05 26.2 16.1 MAT06 26.5 13.7 MAT07 27.2 12.6 MAT08 28.8 11.3 MAT09 27.6 3.8 MAT10 21.8 11.4 MAT11 17.8 3.8 MAT12 41.3 328.4 MAT13 34.7 328.2 Serqet SEQ01 26.3 335.1 SEQ02 21.2 321.9 SEQ03 18.3 318.7 Seth SET01 25.4 219.2 SET02 23.2 219.1
Notes. (∗) By definition according to the Cheops reference frame
(Preusker et al. 2015).
A list of identified honeycomb features and their distribu-tion on the nucleus is provided in Table1. All features are lo-cated between 15◦N and 50◦N in latitude. The distribution is somewhat uneven in longitude. The gaps from 30◦E to 60◦E and from 220◦E to 300◦E partly correspond to the Hapi region deep into the concavity between the two lobes (Sierks et al. 2015; Thomas et al. 2015b). The lack of features between 120◦E and 200◦E may be in part attributed to the incomplete coverage of high-resolution observations during the period.
The regions in which honeycombs were identified include Ma’at and Serqet, on the small lobe of the nucleus, and Ash, Babi, and Seth on the large lobe. All regions display dust de-posits characteristic in the northern hemi-nucleus (Thomas et al. 2015b;El-Maarry et al. 2015). The dust cover probably resulted from the deposition of dust particles ejected from the nucleus that had not escaped from the nucleus and re-accumulated on the surface (Thomas et al. 2015a,b). The thickness of the dust cover varies.Thomas et al.(2015a) estimated a thickness of be-tween about 1 and 5 m based on the depth-to-diameter ratio of a potential impact crater in the Ash region. A similar esti-mate is obtained by Mottola et al. (2015) for dust deposits at the designated landing site for Philae at Agilkia (La Forgia et al. 2015). Possibly, the honeycombs occurred sporadically within smooth terrains with extant dust deposits by the time of observa-tions.Shi et al.(2016a) infer from the pattern of surface rough-ness as well as the typical dimension of individual depressions that the honeycombs may be akin to the pitted dusty terrains
Fig. 1.Honeycomb features observed by OSIRIS during the Rosetta flyby of 67P on March 28, 2015, in Ash (a); at the border between Ash and Seth (b); at the border between Serqet and Ma’at (c), (d); in Ma’at (e); and in Babi (f ). The view of each image is indicated by the red rectangle with respect to the nucleus. Regions are distinguished by color: ash in red, Seth in blue, Serqet in purple, Ma’at in green, and Babi in orange. Nomenclature is as in Table1.
found primarily on the small lobe of 67P (Mottola et al. 2015; El-Maarry et al. 2015;La Forgia et al. 2015).
2.2. Comparison with earlier observations of local morphologies
The plethora of honeycombs observed across the nucleus prompted the question of whether they were fresh features
indicating surface changes over time. The detection of changes by comparing images of a common location is restricted by the difference in resolution, viewing geometry, and illumina-tion condiillumina-tion. The first detecillumina-tion and the last observaillumina-tion before the occurrence of a honeycomb specify a time frame in which the (potential) surface change has occurred. The observations of some particular honeycomb features in different regions are pre-sented below.
Fig. 2.Comparison of surface texture around honeycombs MAT01 and MAT02 observed on September 12, 2014 (a) and January 22, 2015 (b). Some common features are marked by yellow arrows as landmarks. The dust deposits located between MAT02 and the cliff has been partially removed, forming a distinct valley. The scale bar applies to both panels. The observation in (a) was taken at the phase angle of 72◦
with the pixel resolution of 0.51 m. b) was taken at a larger phase angle of 93◦
with the pixel resolution of 0.48 m (TableA.1). Nomenclature is as given in Table1.
2.2.1. Ma’at
The first clear sight of honeycombs was traced back to January 2015, when MAT01 and MAT02 were already distinguishable (Fig.2). Both were half-shielded at the foot of a steep wall or cliff. The abrupt local topography often limits the visibility of the feature locations in the images. As a result, we have found few images from before this date that show the local morphol-ogy in as much detail. An unobstructed but more slanted view of the cliff floor where MAT02 was located suggests that the feature was imperceptible on September 12, 2014 (Fig. 2a). It cannot be ruled out that, in this case, higher incidence and phase angles of Fig.2b may have accentuated the pattern of indenta-tions in the honeycomb. However, we note that the widths of the indentations can be roughly likened to the size of a few ad-joining boulder-like features from the debris. Many indentations were in full shadow, or unilluminated at the bottom. We infer that the depths of indentations should be somewhat comparable to the widths. Therefore, when the boulders are clearly discernible, the absence of indentations is unlikely to be a visual coincidence in Fig.2a. Instead, it may indicate the presence of smooth dust de-posits at the time of observation and, hence, a change in surface roughness over time. The positive relief of MAT02 indicates that the excavation of material was not restricted to within individual indentations but occurred around the honeycombed patch (note the valley formed between MAT02 and the cliff in Fig.2).
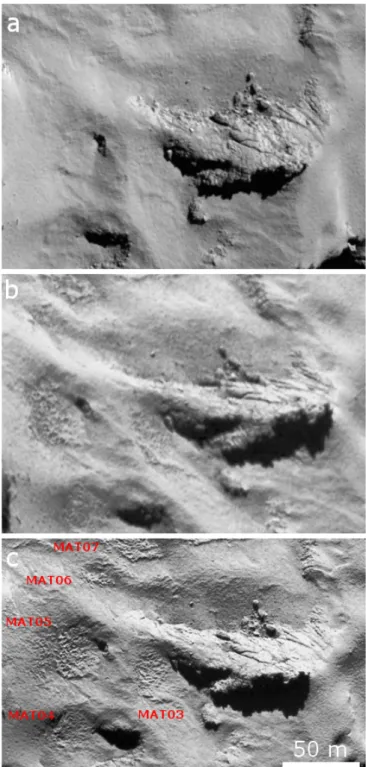
In Fig. 3, we adapt and present a series of three images, spanning six months from the end of September 2014, which provide arguably the clearest temporal contrast in morphologies around honeycombs MAT03-07. The features occurred within the widespread dust deposits that masked the consolidated sub-strate revealing rugged, fractured terrains at some large out-crops (Fig. 3a). The changes may have occurred before mid-February 2015, when the feature locations already appeared heavily etched within a few shallow depressions (Fig. 3b). We considered the comparison between Fig.3a and b as a further
Fig. 3.Comparison of surface texture around MAT03-07 from Septem-ber 2014 through March, 2015. a) Smooth deposits were prevalent on September 20, 2014. b) Surface roughness had increased at various lo-cations by February 14, 2015. c) Honeycomb features were distinguish-able on March 28, 2015. The observation in (a) was acquired at the phase angle of 65◦
with the pixel resolution of 0.48 m. b) was taken at the phase angle of 82◦
with the pixel resolution of 0.56 m. c) was taken at the phase angle of 68◦
with the pixel resolution of 0.44 m (TableA.1). Nomenclature is as given in Table1.
indication of the textural evolution of the dust deposits, which is revealed in the latter image with lower resolution. Figure3c shows the possibly more developed texture at the end of March 2015. It is inferred from the observations that the increase of the surface roughness was not confined to the honeycomb features but occurred over the entirety of the dust-covered areas.
2.2.2. Ash/Seth
The features SET01 and 02 were situated within a shallow basin on a terrace looking down toward Hapi (Fig.1b). The area is bordered by another higher terrace into Ash where ASH01 is located. The dust cover around the honeycombs was relatively smooth by mid-September 2014 (Fig.4a). The surface displays corrugations on the scale of several meters that are probably ei-ther result of aeolian transport or reflect underlying subsurface topography (Thomas et al. 2015a,b). A closer but more slanting view of the same area on February 14, 2015 may hint at a change in the surface pattern (Fig.4b). Many dim patches roughly sev-eral meters in size are visible in Fig.4b. Some appear half-closed with shaded edges on the sunward side. It is inferred that they in-dicate shallow depressions with unilluminated walls shadowing the bottoms. Overall, the surface began to exhibit a pitted pattern in Fig.4b, distinguished from the ruffled, undulating pattern in Fig.4a. The surface may have subsequently evolved to the hon-eycombed texture distinct in Fig.4c (cropped from Fig.1b) in late March 2015. The rim of the basin occupied by SET01,02 had become sharper and more rugged at several places. A long scarp and a smaller V-shaped scarp were likely formed by displace-ment of materials from the inside, possibly due to slumping. The loss of dust deposits is also evident at some fresh concavities near the terrace wall toward Ash. A shallow depression emerged by SET02 after mid-February 2015 (Fig.4b).
2.2.3. Babi
The features BAB01 and BAB02 both span roughly one hundred meters and had evolved from the formerly smooth, dusty plain fenced by extensive scarps along the boundary (Fig.D.1). A few images taken before mid-December 2014 show nearly identi-cal surface textures, suggesting that the dust cover had proba-bly not been altered down to the scale of 1 m (three-pixel reso-lution of the images) by then. The comparison of an image on December 30, 2014 with one on February 14, 2015 under sim-ilar illumination conditions revealed some localized (potential) surface changes around BAB02 (Figs. D.1c,d). For instance, a shallow concavity of a few meters in width had emerged next to an existing scarp (or, indistinguishably, a half-exposed boulder), in addition to a few other marginally resolved new depressions (Fig.D.1d). Nearby, a strip of the surface at the edge of BAB02 had coarsened perceptibly. However, there were no clear signs of significant evolution of the surface texture. The vastly different illumination conditions make it difficult to compare Figs.D.1c and d with earlier observations, such as Figs.D.1a and b. It is in-ferred that BAB01 and BAB02 probably did not take clear shape before mid-February 2015.
2.2.4. Serqet/Ma’at/Nut
Serqet is generally categorized as a region with consolidated ma-terials and littered with boulder-like debris; nevertheless, it is morphologically diverse and exhibits distinct dust deposits to-ward its northern borders with Ma’at and Nut (El-Maarry et al. 2015). Three honeycombs were identified within the dusty por-tions of the region, showing the indented texture similar to other features (Fig.D.2b). More seemed to exist, for example, beyond the border with Nut, though they are not enumerated in Table1. The proximity of these features to MAT12-13 may suggest that the surface texture of the dust deposits had been widely, if not evenly, altered across the tri-border area. It is noted, again, that the emergence of honeycombs was accompanied by numerous
Fig. 4. Comparison of surface texture around ASH01, SET01 and SET02 between November 2014 and the end of March 2015. a) Smooth deposits showed dune-like corrugations on November 11, 2014. b) De-pressions had appeared in scatter over the area by February 14, 2015. c) Mature honeycombs were observed on March 28 2015. Several fresh scarps (red arrows) and a wide shallow depression (dashed red rectan-gle) represent other potential changes in the vicinity. The observation in (a) was acquired at the phase angle of 70◦
with the pixel resolution of 0.52 m. b) was taken at the phase angle of 57◦
with the pixel reso-lution of 0.20 m. c) was taken at the phase angle of 68◦
with the pixel resolution of 0.51 m (TableA.1). Nomenclature is as given in Table1.
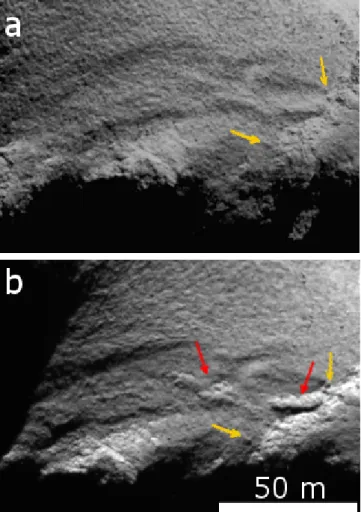
Fig. 5.Emergence of an outcropping structure in Ma’at. Smooth dust deposits observed on October 1, 2014 (a) had thinned out, occasionally exposing the rugged surface (indicated by the red arrow) in the observa-tion taken on March 28, 2015 (b). The yellow arrows point to common features in both images as landmarks. The observation in (a) was taken at the phase angle of 95◦
with the pixel resolution of 0.3 m. b) was taken at the phase angle of 68◦with the pixel resolution of 0.44 m (TableA.1).
other potential changes in the vicinity (Fig.D.2a). For instance, the dense formation of small depressions appeared to have dis-persed out from SEQ02 whose boundaries cannot be clearly distinguished. The topography nearby appeared more angular, which may reflect thinning of the dust deposits.
2.3. Other surface changes in the vicinity of honeycomb features
The emergence of honeycombs appeared to indicate an increase in the surface roughness at mid-latitudes in the northern hemi-nucleus. Numerous other surface changes have been noted that may indicate a wider expanse of surface change on 67P. We present some exemplary cases below with a crude classification of observations.
Exposure of abrupt topography. By the end of March 2015, a few thin but sheer outcrops seemed to have been exposed from the exhausted dust deposits by the crumbled, discontinuous precipice extending toward MAT01 (Fig.5). Observed at high in-cidence angles, the area around honeycombs MAT05,06 showed a rugged, furrowed topography that appeared to be buried under
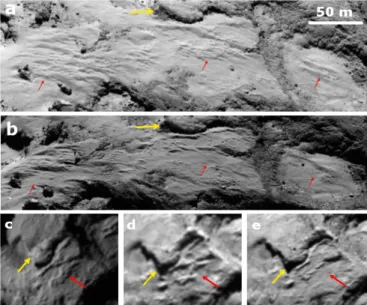
Fig. 6.Revelation of sharp topography indicating removal of overlying dust cover between November 13, 2014 (a) and March 28, 2015 (b). The area in the upper red rectangle showed clear-cut furrow-like relief that was indistinct earlier on. The roughness of the surface area within the lower red rectangle had increased around the honeycomb MAT05 (in shadow in (b)). A trench, indicated by the red arrow, had emerged along the foot of a scarp previously veiled by the dust deposits. The observation in (a) was taken at the phase angle of 82◦
with the pixel resolution of 0.62 m. b) was taken at the phase angle of 68◦
with the pixel resolution of 0.5 m (TableA.1).
smooth dust deposits four months earlier (Fig.6). As can per-haps be perceived in Fig. 3c, the ruggedness appeared pervasive and may not be easily discerned from the honeycombed textures. Numerous new depressions are visible on the neighboring ter-raced mound with occasionally exposed fractured edges, where the dust removal was probably non-uniform (Fig. 6b). A thin trench formed along an existing scarp suggests that the dust re-moval had been affected by local topography. As noted, the to-pography around SEQ02 and SEQ03 had apparently sharpened (Fig.D.2). The protrusion of a few boulder-like features seemed more pronounced in contrast to some more articulate depressions likely indicating retreat of the surface due to local dust removal.
Scattered depressions. A common form of surface changes that we noted is the emergence of multiple shallow depressions. Observations of some distinct changes in Ma’at bordering Hat-mehit are shown in Figs.7,8 andD.3, D.4 through compari-son of two images taken in November 2014 and March 2015, respectively. The depressions formed more sporadically than at the honeycombs or pitted deposits. However, the size of these features, varying from (at least) decimeters to meters, is simi-lar to the size of indentations of the honeycombs. The depres-sions probably resulted from the removal of dust deposits, as in-ferred from the excavation of materials around a few boulder-like blocks (Fig.7). Some may have evolved from the existing con-cavities on the surface (Fig.7). The fresh depressions were often accompanied by plenty of other subtle indications of changes, for example, the disappearance of dune-like structures (Fig.7). Some changes occurred within the originally thin dust deposits that occasionally ran out to reveal rugged, fractured substrate (Fig.D.3).
Fresh scarps. Fresh scarps had been found within the dusty deposits in several regions. The emergence of a scarp in Ma’at is easily explained by the removal of the surrounding dust de-posits, as the edges of several boulders nearby had been revealed over time (Fig.9). The rim of a trapezoidal-shaped, debris-filled depression by ASH01 had sharpened, which could have resulted from partial removal of the dust deposits, such as slumping or
Fig. 7.Chain of decimeter- to meter-wide depressions (indicated by the red arrow) emerged in Ma’at. a) is from an image taken on November 13, 2014; b) is from March 28, 2015. Some boulder-like blocks had be-come more distinct. Dust deposits around the boulder (indicated by the green arrow) in the upper-left corner of the image(s) may have been ex-cavated, with the boulder isolated at the bottom of the depression. The yellow arrow points to another boulder visible in both images but more clear-cut in the later observation, possibly due to retreat of the surround-ing regolith. The observation in (a) was taken at the phase angle of 82◦
with the pixel resolution of 0.62 m. b) was taken at the phase angle of 68◦
with the pixel resolution of 0.5 m (TableA.1).
Fig. 8.Scattered depressions (indicated by the red arrow) occurred next to what appeared to be a honeycomb feature in Ma’at (dashed red rect-angle). A boulder-like block visible in both images is highlighted as a landmark (yellow arrow). The earlier image was taken on November 13, 2014, at the phase angle of 82◦
with the pixel resolution of 0.62 m (a); the other was from March 28, 2015, at the phase angle of 68◦
with the pixel resolution of 0.5 m (b) (TableA.1).
thinning (Fig. D.5). The deposits on the slope of the depres-sion had been at least partially mobilized, with excavation ev-ident around several distinguished boulders. One of the blocks appeared to have been exposed. A large irregular-shaped depres-sion emerged near SET02 with scarp on the one side wandering into the adjacent field of talus (Fig. 10). There was a marked change in surface texture over the floor, where the previously uniform and stippled pattern of dust cover had diminished. We infer that this textural contrast may suggest a decrease in surface roughness, for example, by cleaning of large particles. Notably, a boulder at least 1 m in size had apparently been removed. Still in the Seth region but closer to Hapi, two semi-circular, likely meter-high scarps were visible in an image taken on January 23, 2015 (Fig.11b). One feature can be confirmed to have emerged after early December 2014 (Fig. 11a). The scarp was hard to distinguish ten days later, possibly suggesting ongoing changes. During this time, the other scarp feature receded by more than
Fig. 9.Scarp (indicated by the red arrow) in Ma’at occurred between December 2, 2014 (a) and March 28, 2015 (b). The sharp edges (indi-cated by the green arrows) of a few tentative half-buried boulder had been exposed by the retreat of the surrounding dust deposits. Yellow arrows point to common features in two images as landmarks. The ob-servation in (a) was taken at the phase angle of 91◦
with the pixel reso-lution of 0.52 m. b) was taken at the phase angle of 68◦
with the pixel resolution of 0.5 m (TableA.1).
Fig. 10.Scarp (indicated by the red arrow) in Seth occurred between November 11, 2014 (a) and March 28, 2015 (b). The previously stippled texture gave way to the smoother texture over the floor of the scarp. One meter-sized boulder (indicated by the green arrow) appeared to have been removed. The yellow arrows point to common features in both images as landmarks. The observation in (a) was taken at the phase angle of 70◦
with the pixel resolution of 0.52 m. b) was taken at the phase angle of 68◦
with the pixel resolution of 0.51 m (TableA.1).
10 m. This event might be similar to the prominent changes ob-served in Imhotep between May and July 2015 (Groussin et al. 2015). Scarps were also observed in other areas, such as Babi and Atum (see Fig.D.6, for two new features near BAB02).
Erasure of pitted deposits. With a similar texture, honey-combs may be akin to the pitted terrains (Shi et al. 2016a). Thomas et al.(2015a) noted that the pitted deposits are unlikely to have formed by direct dust deposition but indicate, rather, a textural evolution of the surface. The exact mechanisms of their formation are not understood. Mottola et al. (2015) proposed that the pits may have resulted from either collapse of the dust deposits ensuing the excavation of subsurface volatiles or mobi-lization of the deposits. At the time of writing, the pitted terrains at the border between Ma’at and Maftet had been visibly altered (Figs.12a,b). The changes probably occurred around July 2015, that is, not long before perihelion (Figs.12c,d,e). Heaps of pit-ted dust deposits were likely erased by erosion, leaving behind hollows within the residual dust cover. This serves as support-ing evidence that the honeycombs indicate an evolutionary stage
Fig. 11.Development of scarps in Seth. a) Scarps were imperceptible on December 2, 2014. b) Two scarps (indicated by red arrows) were observed on January 23, 2015. c) One scarp had retreated by more than 10 m in the following two weeks; the other feature had become less distinguishable. The yellow arrows point to a common boulder in all images as landmark. The observation in (a) was taken at the phase angle of 92◦
with the pixel resolution of 0.52 m. b) was taken at the phase angle of 93◦
with the pixel resolution of 0.48 m. c) was taken at the phase angle of 95◦
with the pixel resolution of 0.66 m (TableA.1). The Sun is projected toward the bottom of the image in (a), in the opposite direction as in (b) and (c).
Fig. 12. Changes in the pitted dust deposits in Ma’at bordered by Maftet. a) Pitted deposits distinct on March 28, 2015. b) Several pitted patches had been smoothed out by May 22, 2016. c), d), e) Sequence of three images taken on January 19, July 11, and November 28, 2015, respectively, showing the evolution of pitted deposits (indicated by the red arrow). The observations in (a) and (b) were taken at the respective phase angles of 74◦
and 105◦
, with nearly identical pixel resolutions of 0.61 m. c), d), and e) are of lower resolutions at 2.7 m, 2.9 m, and 2.3 m per pixel, respectively; the phase angles of the last three observations are similar at approximately 90◦
(TableA.1).
of the surface texture of the dust deposits. It also suggests that the erosion may both enhance and diminish the roughness of the dusty surface, whereas the mechanisms can be complicated.
2.4. Global distribution of identified surface changes
The honeycombs and the aforementioned changes of various forms are probably related (see an argument based on the time-line of the surface changes in Sect.5). There is little question that the new outcrops were formed by the removal of the over-lying dust (Figs.5,D.5). The scattered depressions were prob-ably akin to the indentations of honeycombs and resulted from surface erosion giving rise to the pitted texture at a later stage (Figs.7,8). The features SET01,02 and BAB02 appeared to have evolved as such. It can be difficult to clearly separate a honey-comb from the scattered depressions nearby (Figs.4c,8). Aside from an ensemble of small pits, an individual honeycomb can probably be better distinguished by the excavation of surround-ing dust deposits (Figs.1,2). Many honeycombs, for example, MAT03-07 (Fig.3), appeared to be isles of remnants from an expansive erosion that also affected their surroundings. We in-terpreted the fresh scarps, edges, and various depressions around SET02 and ASH01 as a consequence of surface erosion that had occurred beyond the honeycombs. If the honeycombs are indeed pitted remnants from erosion, they are subject to further textural variation (Fig.12).
The distribution of the surface changes presented in this sec-tion as well as those discussed byGroussin et al.(2015) is shown in Fig.13. The two general morphologies of smooth and rugged terrains are distinguished. Apart from the evident latitudinal con-centration from about 20◦N to 40◦N, the presented changes seem to be more populated near morphological boundaries between smooth and rugged regions. It is very likely that the dust cover
of 67P had been widely altered as the comet approached perihe-lion.
3. Change in surface roughness and erosion of the dust cover
Most of the identified potential changes appear to be an evolu-tion in macroscopic roughness of the dust cover. We note that observational effects such as dissimilar viewing geometries and varied illumination conditions of images could belie or, at least, pose a challenge to the factuality of the intuited surface changes. Hence, more care is warranted in the comparison of the images as well as interpretation of any visual differences. This is the crux of our discussion in this section.
We use radiometrically-calibrated level-three images, as de-scribed byTubiana et al.(2015). Let Iλbe the spectral radiance (in W m−2sr−1nm−1) of sunlight at wavelength, λ (in nm), scat-tered from the nucleus and detected by the camera. The radiance factor is defined by (Hapke 1981;Shkuratov et al. 2011), <=πIλ
Fλ, (1)
where Fλ is the solar irradiance (in W m−2nm−1) at λ. The observations analyzed in this work were acquired at λ ≈ 640 nm and 650 nm, between which Fλ varies insignificantly. Hereafter, we omit the subscript, λ, from the notation. It is il-lustrative to express the radiance factor as,
<= AF (α)D(i, e), (2)
A and F are the (wavelength-dependent) normal albedo and phase function, respectively. The latter is approximated here by the polynomial (Shkuratov et al. 2011;Schröder et al. 2013), F (α) ≈
K X
k=0
ckαk, (3)
for some coefficients, ck. The normal albedo, A, and phase func-tion with ck up to K = 3 are provided in Table2 by fitting the Hapke model (Hapke 2002) for 67P derived byFornasier et al. (2015). We note that c0= 1 by definition of Eq. (3), and that the phase angle, α, is measured in degrees. The disk function, D, is assumed to be approximated by the Lommel-Seeliger law: D(i, e)= 2 cos i
cos i+ cos e =
2 cos (α − γ)
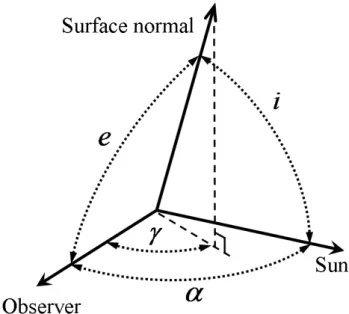
cos γ+ cos (α − γ) = D(α, γ), (4) where i and e denote the incidence and emission angles, respec-tively. γ is the photometric or luminace longitude (Hapke 2002; Shkuratov et al. 2011; the notation here is that of the latter). As shown in Fig.14, γ is the angle between the camera (observer) and the component of the surface normal projected onto the “Sun-surface-observer” plane, measured positive if overlapped with α. The advantage of introducing D(α, γ) is that, when phase angle varies negligibly over the image, the disk function depends only on γ that varies with surface topography.
3.1. Macroscopic surface roughness
We applied the basic shape-from-shading technique, introduced byRindfleisch(1966), to infer the surface roughness pattern in each image. This classical approach provides an efficient solu-tion for topography profiling from a single image. The technique
Table 2. Parameters of the shape-from-shading analysis. Solar irradiance at 1 AU
(640 < λ < 650 nm)
F 1.6 W m−2nm−1
Focal length of NAC rF 0.7168 m
Differential step (for 1 pixel) ds 13.5 × 10⁻⁶m
Normal albedo A 0.063
Coefficients of phase function
c1 −0.046
c2 1.1 × 10⁻³ c3 −1.4 × 10⁻⁵
is briefly reviewed in AppendixB. Suppose the distance, r, be-tween the (focal point of) camera and a certain reference point on the nucleus surface at P0 in the image is known as r0. The variation, ∆r, due to the topographic variation from P0 to any other point, P, in the direction of the Sun from the observer can be determined as ∆r ≈ r0 rF Z P P0 tan γds (m), (5)
where ds denotes some differential step along the straight path from P0 to P projected on the imaging plane, and where rF is the focal length of the camera. tan γ is derived from the pixel intensities at s.
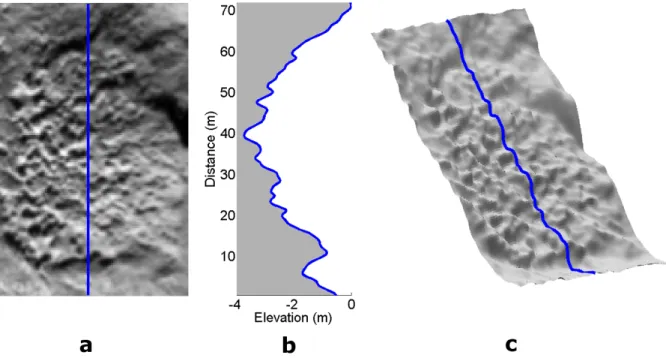
The procedure of the roughness analysis is illustrated in Fig.15, via an image of MAT05. The Sun is projected upward onto the image plane (as can be inferred from the direction of the shadow cast downwards in Fig.15a). The direction of inte-gration on the right-hand side of Eq. (5) is therefore from bot-tom to top. The profile of topography along a single path indi-cated in Fig.15a is shown in Fig.15b. We note that the elevation varies opposite to∆r and is referred to a local plane given by the corresponding facet(s) of the existing shape model of the nu-cleus (Jorda et al. 2016). The constant and linear trends of the curve are removed (according to the remark C in AppendixB). Thus, the profile captures only the undulation arising from sur-face roughness but does not improve the measurement of abso-lute surface elevation from the shape model. The undulations of the curve suggest that depths of the indentations are typically a few decimeters. The depths are insignificant compared with the width of the entire honeycomb of tens of meters.
The roughness model in terms of elevation is derived by con-necting profiles for all paths across the image (Fig.15c). How-ever, there seems to be a lack of unique method for connecting profiles. The reason is simply that, while ∆r can be estimated via Eq. (5), the initial value, r0, for each profile is arbitrary. We approximate the initial value by the distance from the camera to the local nucleus surface represented by the shape model. Er-rors arise from the improper initial value, discreteness of sig-nals, and accumulation of noises along the path of integration that will sometimes cause unrealistically large undulation across profiles (Horn 1977). To alleviate this issue somewhat, we sup-press any separation between adjacent profiles that can be fitted by the polynomial,∆r0 = Pk=0aksk, up to degree five. It is not an unrealistic assumption that there should be no abrupt, large-scale topographic change, extensive cliffs for example, between two adjacent profiles.
The roughness model was used to simulate an image to be compared with the original image under the instantaneous illu-mination (Figs.16a,b). Our aim is not to develop an elaborate shape model that minimizes the difference of a simulated im-age from the actual. Nevertheless, the similar sunlit patterns of
Fig. 13.Map of surface changes in cylindrical projection. Morphological regions are defined according toEl-Maarry et al.(2015,2016). Dark blue regions correspond to smooth terrains; light blue regions contain distinct dust deposits; regions in dark or light red are consolidated. We note that dust deposits were present in Serqet (SEQ) which was diverse in morphology but categorized generally as weakly consolidated byEl-Maarry et al. (2015). Honeycombs are indicated by hexagons. Other surface changes are marked by triangles.
Fig. 14.Photometric longitude in relation to the incidence, emission, and phase angles. This figure is reproduced from Fig. 4 inRindfleisch (1966), with symbols adapted to the notation ofShkuratov et al.(2011).
surface in the images suggest that the derived topography is a valid characterization of the prominent surface roughness.
It is found that MAT05 was not present six months before; otherwise, it would have exhibited a resolved roughness that is not observed from the real observation which instead showed a far smoother texture (Figs.16c,d). This analysis was repeated for many other features. Another example is provided in Fig.17for
feature ASH01. The absence of the feature from earlier images in November 2014 cannot be attributed to visual effects, since the roughness would have been noticeable and differed from that in the real image.
We therefore confirm that the honeycombs were not endur-ing morphological features or surface texture, whose appearance varies significantly and can be concealed by illumination and viewing conditions. Instead, they indicate an increase in the sur-face roughness of the dust cover over time, on spatial scales from decimeters to meters.
3.2. Thickness of surface erosion
The surface changes in volume can be rigorously quantified by assessing the difference in shape models for the correspond-ing epochs of interest. It has been shown that the widths of the individual indentations are a few meters while their depths are typically a few decimeters. Thus, an accurate quantification would necessitate development and detailed comparison of mul-tiple shape models with high resolution (Preusker et al. 2015; Jorda et al. 2016), an effort far beyond the present treatment in complexity.
We limited ourselves to the probable scenario in which the increase in surface roughness resulted from net (uneven) mass loss from the dust deposits (Schulz et al. 2015), that is, ero-sion caused by ice sublimation and dust ejection. This sce-nario is in keeping with the observed increase in activities of outgassing and dust ejection with decreasing heliocentric distance (Bockelée-Morvan et al. 2015;Della Corte et al. 2015; Fougere et al. 2016; Fulle et al. 2016c). Since the thickness of the dust cover is small relative to the width of a single honey-comb feature, it suffices to quantify the surface erosion in thick-ness. The topography or elevation of the roughness model is
Fig. 15.Illustration of topography profiling for honeycomb MAT05. a) Real image of the feature with path of profile indicated by the blue line. b) Profile of topography in elevation that corresponds to the path in a), c). Oblique view of the roughness model by connecting all profiles in (a). The elevation is exaggerated by a factor of three in order to accentuate the pattern of surface undulations.
Fig. 16.Synthetic views of the roughness model for feature MAT05 in comparison with the real images. a) Real image of the feature. b) Syn-thetic image of the feature in the same view and illumination as in (a), (c). Real image of the feature location before the feature was detected. d) Synthetic image of the feature in the same view and illumination as in (c). The same brightness scale is used for the real and synthetic images for each comparison.
measured from an arbitrary level close to the nucleus. It is not possible to assess changes of the dust cover by directly compar-ing the two roughness models.
Fig. 17.Synthetic views of the roughness model for feature ASH01 in comparison with the real images. a) Real image of the feature. b) Syn-thetic image of the feature in the same view and illumination as in (a), (c). Real image of the feature location before the feature was detected. d) Synthetic image of the feature in the same view and illumination as in (c). The same brightness scale is used for the real and synthetic images for each comparison.
In the case of surface erosion, the thickness of the dust cover could only decrease, meaning that, the surface could only be lowered over time. Figure18a is a comparison of the elevation
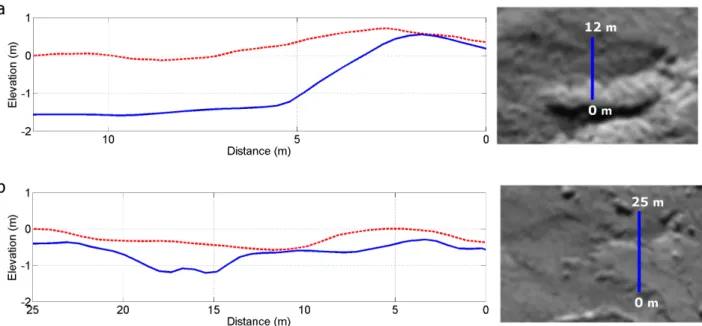
Fig. 18.Topographic profiles over the honeycomb feature MAT05 on Septemper 20, 2014 (dashed red curve) and March 28, 2015 (solid blue curve), respectively. The path is as indicated in Fig.15a. It is assumed that the red curve must overlie the blue curve. a) Profiles directly pro-duced by shape-from-shading. The end points of both curves are regis-tered to the shape model (Jorda et al. 2016), thereby removing the re-spective linear trends. The mean elevation difference is 1.3 m. b) Profiles detrended up to degree four. The mean elevation difference is 0.51 m.
profiles along the common path before and after change had oc-curred. The profile after the change exhibits a more abrupt and frequent variation, exemplifying the increase in surface rough-ness. The profile is placed below the earlier curve such that it grazes but does not cross the latter. The difference between the two profiles is 1.3 m on average. Due to multiple assumptions and many unknown sources of uncertainty, it is impractical to quantify the error of this estimate. To contain the uncertainty somewhat, we remove the quartic trend of the profiles in Fig.18b such that the difference arises only from the higher-frequency undulations of the blue curve, that indicate an increase in sur-face roughness. In this case, the average difference of 0.51 m is probably a lower limit of the actual erosion.
It can be argued that 1 m is a robust order-of-magnitude esti-mate for the thickness of erosion. The lower limit of this estiesti-mate is strictly given by the pixel resolutions of images, which are about 0.5 m and always larger than 0.1 m. Changes below this detection limit would not have been observed (in other words, we cannot distinguish between 1 m and 0.5 m). The upper limit, on the other hand, is given by the thickness of the dust cover, es-timated to be up to a few meters in general (Thomas et al. 2015a; Mottola et al. 2015). It follows that the erosion of the dust cover would not exceed a few meters. Thus, we may formally express the maximum uncertainty of this estimate as 0.5 m <∆x < 5 m, while the upper bound of the dust cover is fromThomas et al. (2015a).
The estimated thickness of erosion of approximately 1 m is also reflected from other types of surface changes (Sect. 2.3). In Fig.19, we compare the topographic profiles before and af-ter the surface change, where the overall deviation of the curves is, again, attributed to the recess of the surface level. The poten-tial outcropping structure shown in Fig.5 in Ma’at could have been exposed by thinning of the dust cover by at least 1 m in six months (Fig. 19a). The fresh, scarp-like feature shown in Fig.9b may have formed by the removal of the surrounding top few decimeters of dust deposits (Fig.19b).
4. Accumulated insolation and modeled erosion
The surface changes could be induced by various mechanisms. As a first attempt, we have concerned ourselves with the gen-eral scenario where the loss of dust deposits was driven by the outgassing of volatiles from the nucleus.
The sublimation of water ice, the most abundant volatile measured in the coma of 67P, is predominantly influenced by in-solation and exhibits clear diurnal variation (Keller et al. 2015). The sublimation of more volatile ices, such as CO2 and CO, is strongly dependent on the interior thermal and structural conditions of the nucleus (Yabushita 1995; Enzian et al. 1997; Belton 2010). The fact that the surface changes (in this work) all emerged between September 2014 and March 2015 suggests they were likely to have been the result of intensifying insolation due to a decreasing heliocentric distance from about 3.5 to 2 AU. In particular, the sub-solar latitude lowered from 45◦N to 15◦N during the aforementioned period, roughly the range in which the surface changes were distributed. This strongly suggests that the decrease in local solar zenith (incidence) angle had further invigorated changes of the surface.
4.1. Accumulated insolation
For a given location on the nucleus, we evaluate the accumulated energy of insolation from t0to t1by,
E (t0, t1)= Z t1 t0 Q (t)dt (J m−2), (6) where Q (t)= " rAU r (t) #2 C (1 − AB)δ cos i (t) (W m−2), (7) is the instant flux of absorbed energy. C = 1361 W m−2 is the solar constant and AB = 0.05 is adopted for the surface Bond albedo. The heliocentric distance of 67P, r , and the solar inci-dence angle, i , are time-varying. They are calculated from the estimated position and orientation of the nucleus (approximated by a shape model) from SPICE kernels (Acton 1996). δ = 1 if the local surface is illuminated and δ = 0 otherwise, that is, if i ≥ 90◦or if the local surface is shadowed by surrounding to-pography. rAUdenotes one AU in unites of r (introduced for the sole purpose of nondimensionalization).
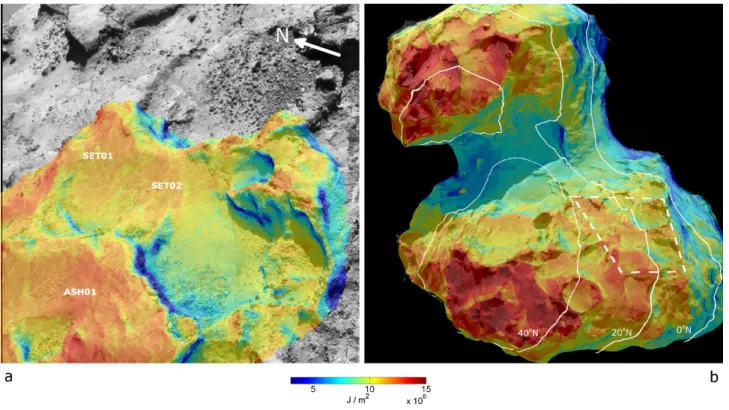
We applied local shape models truncated from the global SPG shape model with a spatial resolution of approximately 10 m (Preusker et al. 2015) to derive the accumulated insolation from early September 2014 through February 2015. We focused on the areas around honeycombs MAT02-11 and that around ASH01, SET01 and SET02, located at roughly the same lati-tudes on separate lobes (Fig. 13). Figures 20a and 21a show the areal pattern of accumulated insolation superposed on the respective context images. The insolation is influenced by to-pography. The accumulated insolation over the cliffs (as always inferred from their rugged, fractured appearance) shows clear di-chotomy: the south-facing walls and the nearby shielded floors absorbed limited energy below 6 × 10⁸J m−2as a result of scarce sunlight during the northern summer; whereas, those looking to the north had been amply illuminated, accumulating more than 109J m−2of energy, over six months. This contrast is also widely observable with other abrupt topographies such as out-crops and boulder-like monoliths. The honeycombs were all lo-cated within open smooth terrains with an accumulated inso-lation above E ≈ 109J m−2. More locally, some honeycombs
Fig. 19.Comparison of topographic profiles before and after the surface change. a) The solid blue curve corresponds to the path over an exposed outcrop indicated in the right-panel image (cropped from Fig.5b) on March 28, 2015, the dashed red curve is for October 1, 2014. b) The solid blue curve follows the path over a fresh scarp indicated in the right-panel image (cropped from Fig.9b) on March 28, 2015. The dashed red curve refers to December 2, 2014.
Fig. 20.Accumulated insolation from September 1, 2014 through February 28, 2015. a) Local accumulation in Ma’at superimposed on the context image of Fig.1e showing honeycombs MAT02-10. b) Global accumulation over the nucleus from a more distant view than (a). The field of view of (a) is indicated by the quadrilateral of dashed white outline in (b).
could be distinguished by patches bounded by higher and lower accumulated insolation on opposite sides, for example, MAT03-05 (Fig.20a). This illustrates that these honeycombs were within locally flat areas bordered by slopes or scarps well illuminated on northward side but less so on the southward side.
Higher accumulation in Fig.20a occurred near the rim of a large pit within the dust-covered plateau to the north (see Vincent et al. 2015 and Ip et al. 2016 for a description of the
pits on 67P). The enhancement toward the north was also some-what noticeable in Fig.21a. It can be inferred that the areas fur-ther north were more persistently, albeit softly, illuminated over-head when the comet remained further out from the Sun (before 2015).
This observation is more conspicuous on the global scale. The accumulated insolation overall increases toward higher lat-itudes, warmed by the trailing heat from a prolonged yet mild
Fig. 21.Accumulated insolation from September 1, 2014 through February 28, 2015. a) Local accumulation at the border between Ash and Seth superimposed on the context image of Fig.1b. b) Global accumulation over the nucleus from a more distant view than (a). The field of view of (a) is indicated by the quadrilateral of dashed white outline in (b).
summer in the northern hemi-nucleus (Figs.20b,21b). As noted, sharp variations may occur over large-scale abrupt topogra-phies, for example, the (north-facing) cliffs had been subject to strongest insolation. We also note that the bi-lobed shape and abrupt topography of the nucleus give rise to unintuitive lines of (equi-)latitudes and, accordingly, notable variation of insolation along the same latitudes.
4.2. Modeled erosion of water ice
In light of the surface changes as an evident consequence of in-tensifying insolation, it is of primary importance to assess the role of water ice in driving or facilitating the surface erosion. On the other hand, there is a lack of observational indication that the activities of supervolatiles played a vital role in triggering the surface changes (the discussion is given Sect.6.1).
We employed a thermal model to assess the accumulated erosion of water ice in response to varying insolation. It is as-sumed that nucleus is covered by a dry, porous dust mantle that is insulating and (gas-)flow-resistant. The dust mantle, some mil-limeters up to a few centimeters thick, should be distinguished from the dust cover as an observed morphology. The subsur-face below the dust mantle is a mixture of water ice and dust (Fig.C.1). Hence, it is stipulated here that the dust cover is icy (however slightly) from some shallow depths (De Sanctis et al. 2015;Spohn et al. 2015;Shi et al. 2016a). The thermal model is hereafter referred to as the “dust mantle” model.
Sublimation of water ice occurs at the ice front with water vapor diffusing through the overlying dust mantle. The mass flux per unit surface area is given by (AppendixC),
Z= f · ¯Z(Ti, Xi, dp) (kg m−2s−1), (8)
where ¯Z is the sublimation flux of pure solid water ice beneath the dust mantle, that varies with layer thickness, Xi, size of the
constituent dust particles, dp, and temperature at the ice front, Ti (Gundlach et al. 2011). The empirical factor, 0 <f ≤ 1, loosely characterizes the “icy area fraction” and arises from the fact that the nucleus interior is composed of dusty ice (or icy dust) rather than pure ice, as clarified byCrifo(1997). For instance, a high dust-to-ice ratio gives rise to lowf in the dust cover.
The topography of the nucleus is represented by a shape model. The resolution (the size of a single facet) of the shape model exceeds the diurnal thermal skin depth for 67P (likely a few centimeters at most) by at least two orders of magni-tude. With the plane-parallel assumption, the profile of subsur-face temperatures can be derived by solving the 1D heat equation for each facet with boundary conditions of energy balance. The reader is referred to AppendixCfor details of the solution.
The thermal model is laterally homogeneous over the nu-cleus, that is, it does not reflect any variation of the (sub)surface structural or thermal properties with different morphologies. While it is a consensus that activity was stronger in Hapi on a global scale, the contrast is hardly striking (Fougere et al. 2016; Fink et al. 2016). For the time being, we have considered a ho-mogeneous model viable and instructive for a preliminary study. We further assume the thickness of the dust mantle to be con-stant, in spite of the complex, varying vertical structures ob-served both experimentally and in situ (Spohn & Benkhoff 1990; De Sanctis et al. 2015;Biele et al. 2015). The erosion of the dust cover can be conceptualized as a top-down steady-state process that is always commensurate with erosion of the water ice for a given dust-to-ice ratio.
4.2.1. Choice of model parameters
The modeled temperatures and sublimation flux are sensitive to the choice of parameters, which is not unique. For both the
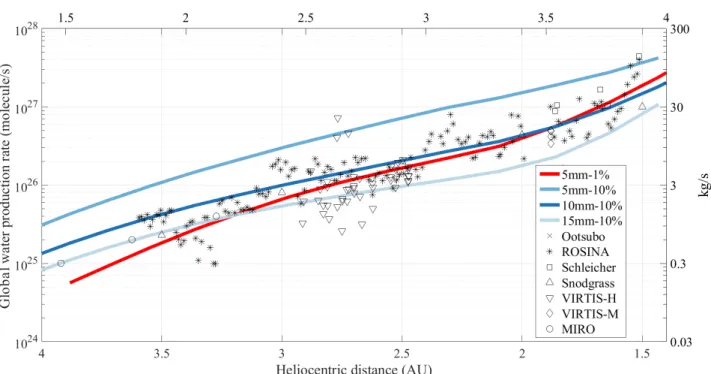
Fig. 22.Modeled water production rate as a function of heliocentric distance from 4 AU inbounds in comparison with measurements. Measure-ments are marked by discrete symbols. MIRO data are given byGulkis et al.(2015). All other data are adapted from Fig. 15 inFougere et al. (2016). Model results assuming different thickness of the overlying dust mantle for f = 0.1 are indicated by solid blue lines. The solid red curve corresponds tof = 0.01 with a mantle thickness of 5 mm.
dry dust mantle and the underlying icy dust, we adopt κ = 0.002 W K−1m−1, c = 1000 J K−1kg−1, and ρ = 500 kg m−3. They correspond to a thermal inertia of I = (κcρ)1/2 ≈ 30 W K−1m−2s1/2, being the median in the range between 10 and 50 W K−1m−2s1/2derived by MIRO (the Microwave Instru-ment for the Rosetta Orbiter) measureInstru-ments around September 2014 (Gulkis et al. 2015). We assume that the dust mantle con-sists uniformly of particles 1 mm in diameter. The choice of dust mantle thickness, Xi, and the icy area fraction of the subsurface, f , will be discussed later.
4.3. Comparison with in situ measurements
The water production rate of 67P has been measured in situ by various instruments onboard Rosetta and derived from ground based observations. Figure22shows the data of measurements presented byFougere et al.(2016) from a heliocentric distance of 4 AU to 1.5 AU inbound. Some estimates based on the early measurements of MIRO are appended (Gulkis et al. 2015; Biver et al. 2015). These measurements allow us to assess the feasibility of the thermal model for estimating the erosion of wa-ter ice.
We modeled the water production of 67P averaged over one comet rotation during the period of reported measurements, ζ = 1 tP Z t0+tP t0 Z S ZdS dt (kg s−1), (9)
where dS denotes differential element of the total surface area, S, of the nucleus, and where tP ≈ 12.5 h4is the rotation period of the nucleus. In this calculation, dS is given by the area of a single triangular facet of the shape model.
4 Keller et al.(2015) showed that the rotation period of 67P changes
and somewhat increased during the period of our interest. Our experi-ence suggests that the time-averaged ζ is not strongly affected by tP.
At first, we adoptedf = 0.1 for the icy area fraction, which is roughly compatible with the ice content of about 10% relative to the refractory materials observed in Hapi (De Sanctis et al. 2015). A range of values has been tested for the thickness of the dust mantle, Xi, a parameter strongly affecting the production rate. In the first case, we assumed that the dust mantle is 5 mm thick. The model overestimates the measurements by a factor of about six. Increasing the thickness of the dust mantle reduces the production rate. For a thickness of 1 cm, the modeled pro-duction rates are best-fitting the measured. With an even thicker dust mantle of 1.5 cm, the model tends to underestimate the wa-ter production rate. Additionally, we reduced the icy fraction to f = 0.01 that corresponds to the water ice abundance of about 1% in the subsurface. It is found that the water production of the nucleus with a mantle thickness of Xi = 5 mm is similar to the results for Xi= 1 cm and f = 0.1. In all cases, the modeled pro-duction shows a temporal trend in general agreement with that of the measurements, obviously in response to the intensifying in-solation as the comet approached perihelion. Hereafter, we adopt Xi = 1 cm and f = 0.1 for the thickness of the dust mantle for deriving the erosion of water ice.
4.4. Results
The total erosion of water ice from time t0to t1is calculated as, ∆mH2O=
Z t1
t0
Zdt (kg m−2), (10)
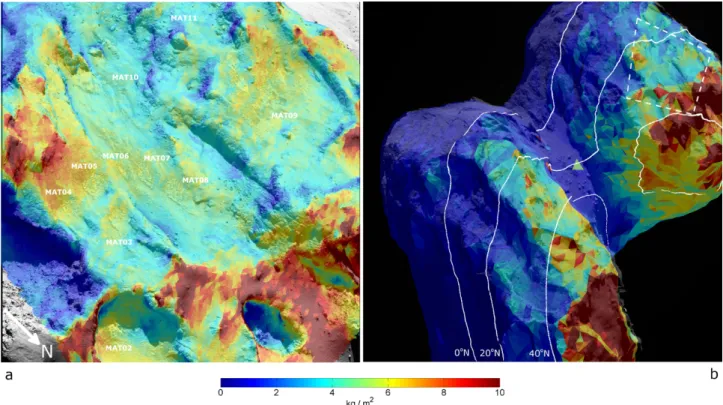
where the instant outgassing flux, Z, is given by Eq. (8). Figures23and24show the modeled water ice erosion in the areas around MAT02-11, and near ASH01, SET01 and SET02, respectively, accumulated in six months from early September 2014. The graphs are superposed on the same context images as in Figs.20and21, respectively. The pattern of∆mH2Oresembles
Fig. 23.Total erosion of water ice from September 1, 2014 through February 28, 2015. a) Local erosion in Ma’at superimposed on the context image of Fig.1e showing honeycombs MAT02-10. b) Global erosion over the nucleus from a more distant view than (a). The field of view of (a) is indicated by the quadrilateral of dashed white outline in (b).
water ice is essentially insolation driven. The north-facing cliffs were subject to the strongest erosion of nearly 10 kg m−2, while the minimum occurred at the least insolated locations, for ex-ample, southward walls, the nearby floors as well as the bottom of pits. The open areas where the honeycombs emerged were subject to a moderate amount of erosion, mostly in excess of 5 kg m−2(induced by E
> 109J m−2; see Figs.20and21). The total erosion overall increases further north, as a direct result of higher accumulation of insolation.
It can be shown that 5 kg m−2is a reasonable model estimate for the lower limit of water ice erosion at any locations where the surface changes were detected. The derived pattern of∆mH2O,
which conforms to that of accumulated insolation, supports the interpretation of the observed surface changes that the erosion had probably occurred widely over the northern hemi-nucleus of 67P.
5. Seasonal erosion and restoration of the dust cover
Most of the surface changes were distributed from about 20◦N to 40◦N (Table1, Fig.13). The fact that the changes occurred5
concurrently with the movement of the sub-solar point across the same latitudes suggests the change over the dust cover is a seasonal phenomenon. We recall a timeline of detections of
5 In the case of ideally accumulative erosion as modeled in this work,
the question of temporal “occurrence” of changes taking place gradu-ally seems irrelevant. Nevertheless, we refer the occurrence to when the accumulation becomes substantial with respect to observational resolu-tion, that is, approximately 1 m in thickness. We note that the timing of some changes such as the retreating scarp (Figs.11b,c) and evolution of the pitted deposits (Figs.12c–e) is known from observations.
certain cases, which, however, may not specify their temporal occurrence:
1 MAT01, MAT02 were detected in January while MAT03-08 were detected in mid February 2015 (though MAT06 and MAT08 were less distinguishable, Fig.3b).
2 Changes around ASH01, SET01 and SET02 by the Ash-Seth border were perceptible in February 2015 (Fig.4b); the mov-ing scarp in Seth occurred at the end of January (Figs.11b and c).
3 There was a lack of significant changes around BAB01, BAB02 before the features were detected at the end of March 2015. However, hints of changes around BAB02 date back to February (Figs.D.1c and d).
We also note:
4 The prominent changes of moving scarps in Imhotep occurred between late May and early July in 2015 (Groussin et al. 2015). The removal of the pitted dust de-posits at the border between Ma’at and Maftet probably oc-curred around the same time.
Meanwhile, it is shown that (Table1; Fig.13):
i MAT01, MAT02 are at around 33◦N; MAT03-08 are further south at 25 ± 5◦N.
ii ASH01, SET01 and SET02 are located at about 25◦N. iii BAB01 and BAB02 are at about 21◦N and 15◦N,
respec-tively, among other southernmost features (MAT11 and SEQ03, for example).
iv Changes in Imhotep are further south than all surface changes analyzed in this work (Groussin et al. 2015). The erased pitted terrains were located near the equator.
Inspecting the above points by the number (numeral), we infer that the features far north, MAT01 and MAT02, appeared first,
Fig. 24.Total erosion of water ice from September 1, 2014 through February 28, 2015. a) Local erosion at the border between Ash and Seth superimposed on the context image of Fig.1e. b) Global erosion over the nucleus from a more distant view than (a). The field of view of (a) is indicated by the quadrilateral of dashed white outline in (b).
followed by ASH01, SET01, SET02, and MAT03-08, slightly lower in latitude. BAB01 and BAB02 were possibly the last hon-eycombs to emerge with local insolation to peak still later. All these changes predated the changes in Imhotep as well as the era-sure of the pitted terrains in Ma’at and Maftet. Most of the other honeycombs were detected at the end of March 2015 and scat-tered in latitudes. The timing of their occurrences proved more difficult, owing to the fewer images found and often long gaps in between. The inferred temporal occurrence of the changes supports the scenario that they were directly responding to the seasonal migration of the sub-solar point and the decreasing he-liocentric distance.
5.1. Transition strip of global morphology
More insight into this seasonal phenomenon is gained by not-ing that the latitudinal strip between about 20◦N to 40◦N where most of the surface changes took place marks a global transition in surface roughness between the general morphologies in the northern and southern hemi-nuclei (Fig. 25). Smooth dust de-posits are prominent and likely perennial at higher latitudes on each lobe; whereas, they were diminished further south reveal-ing the prevalent, more rugged terrains. The transition strip is where the dust cover overall tapers off toward the south. How-ever, due to the sheer topography, local variations are expected to be common.
5.2. Thinning of the dust cover pre-perihelion
By the northern autumnal equinox, the surface roughness had increased along the transition strip, as evidenced by the emer-gence of honeycombs and other changes in plenty, marginally (un)covering the subsurface and showing a moderate surface roughness. Our thermal modeling analysis suggests that the areas
further north had been subject to greater accumulated insolation and hence erosion. If the erosion had occurred uniformly as mod-eled, that is, due to water ice sublimation driven purely by inso-lation and below a dust mantle of constant thickness, it is then likely that the initial thickness of the dust cover was not uni-form. This means that the stronger erosion had not exhausted the dust cover further north, while the thinner deposits between about 20◦N and 40◦N had been rapidly depleted.
Another possibility should not be dismissed, however. The prominent change along the transition strip might be attributable to the non-uniform erosion over different latitudes. In this case, the erosion would increase more rapidly or steeply than induced only by decreasing heliocentric distance. One possible indica-tion is the late emergence of all changes from early 2015. Re-call, for instance, that the earliest, subtle textual development with BAB01, ASH01, SET01 and SET02, did not appear until February 2015.Gundlach et al. (2015) showed that 2.5 AU (in January 2015) may mark the onset of dust ejection efficiently driven by water outgassing. The ejected particles were likely sized around 1 dm. The significant ejection of large particles could have enhanced the erosion of the dust cover from early 2015. The present thermal model with fixed parametrization did not reflect this “acceleration”, as it neglected the micro-physics of ejection of the dust particles by outgassing and, not least of all, assumed constant thickness of overlying dry dust mantle for simplification. We note that the two possibilities, namely, the non-uniform dust cover and accelerated erosions, are not mu-tually exclusive. However, it is beyond the scope of the present analysis to disentangle the two scenarios.
5.3. Restoration of the dust cover post-perihelion
The dust cover probably consists of large particles (Mottola et al. 2015). Thomas et al. (2015a) demonstrated that the local and
Fig. 25.Distribution of honeycombs on 67P indicated on two context images with complementary views of the nucleus. Honeycombs are marked by white arrows. Three lines of latitudes, the equator, 20◦
N, and 40◦
N, are denoted by green lines. The latitudinal line at 40◦
N is disconnected and circumscribing each lobe, which arises from the ambiguity of the latitude-longitude system (Preusker et al. 2015).
global redistribution of dust particles over the nucleus is plausible and probably a general phenomenon. Particles not celerated to escape speed by gas drag tend to fall back and ac-cumulate on the nucleus. Large and heavy particles are likely the main source of contribution6. We also refer the reader to the
dedicated analysis on dust transport on 67P byLai et al.(2016). Keller et al.(2015) envisioned a prominent dust deposition process in the northern hemi-nucleus during the upcoming peri-helion passage of 67P. The particles would originate dominantly from the south, which is subject to the strongest insolation and, hence, surface erosion during perihelion. This is substantiated by the more recent observations several months after perihe-lion, where the pitted texture of honeycombs was no longer vis-ible. The disappearance of some pronounced features is shown in Fig. 26. The cluster of honeycombs in Ma’at and three fea-tures at the Ash/Seth border had vanished. The scarp in Seth had been erased. The sheer edges exposed by thinning of the overly-ing dust deposits before perihelion had been smoothed out. The surface texture of the feature locations had reverted to that of smooth dust deposits with more random and uniform roughness. Here, we have omitted the roughness analysis as discussed in Sect. 3.1. It suffices to note that the disappearance of features likely suggests that the lower limit of dust deposition during the perihelion is comparable to that of erosion before perihelion, which is approximately 1 m.
5.4. Seasonal retreat and expansion of the dust cover The pre-perihelion erosion of the dust cover in the northern hemi-nucleus of 67P was compensated by a prominent dust
6 We regard dust particles around 1 mm or bigger as “large”. The dust
size distribution in terms of the power law index pivots around 1 mm (Rotundi et al. 2015;Fulle et al. 2016c). The steeper size distribution of bigger particles may be indicative of their stronger tendency to be redeposited onto the nucleus (Fulle et al. 2016a). We note that dust par-ticles at least down to roughly 1 cm in size were distinguished by ROLIS (Mottola et al. 2015).
deposition at perihelion. These notable changes are a manifes-tation of the seasonality in the surface texture as well as in the activity of 67P.
It is along the transition strip that the surface changes would appear most prominent. As noted, this prominence could result from the thinner dust cover than higher latitudes; additionally, it may result from the more significant dust erosion over mid latitudes, for example, due to removal of sizable particles. Both cases accommodate the significant disturbance and even deple-tion of the dust cover along the transideple-tion strip with the de-posits further north remaining thick and smooth (Fig.25). Sim-ilarly, the dust deposition around perihelion altered more sig-nificantly the surface texture along the transition strip, when the reinstated dust cover masked the honeycombs distinguishable af-ter the overlying deposits had thinned out before perihelion. The textural change of dust deposits in higher latitudes would proba-bly be less notable, since the further enrichment to the (already) eminent dust cover would not alter its surface roughness. In ef-fect, the edges of the dust cover retreat and advance on each lobe of the nucleus, as the dust deposits are removed and re-stored along the transition strip. We may expect this morpholog-ical phenomenon to repeat in each orbit (assuming the current orbital and rotational states to remain).
6. Discussion
6.1. Plausibility of surface erosion caused by sublimation of water ice
In our thermal analysis it was assumed that the sublimation of water ice was the main driver of the observed dust erosion (Sect.4). The validity of this assumption lies with the source of observed dust activity on 67P.
Thermal modeling by Keller et al. (2015) illustrated that the dust activity driven by water outgassing follows insola-tion over the nucleus.Vincent et al.(2016) showed that the vi-sual pattern of jet collimation is indeed repetitive on a diur-nal basis.Kramer & Noack(2016) demonstrated that the pattern
Fig. 26.Renewed dust deposits covering the observed surface changes after perihelion. a), b) Honeycombs MAT03-08. c), d) Honeycombs ASH01, SET01 and SET02. e), f ) Honeycombs BAB01 and BAB02. g), h) Scarps in Seth as shown in Figs.11b,c.