HAL Id: inserm-02917087
https://www.hal.inserm.fr/inserm-02917087
Submitted on 18 Aug 2020
HAL is a multi-disciplinary open access archive for the deposit and dissemination of sci-entific research documents, whether they are pub-lished or not. The documents may come from teaching and research institutions in France or abroad, or from public or private research centers.
L’archive ouverte pluridisciplinaire HAL, est destinée au dépôt et à la diffusion de documents scientifiques de niveau recherche, publiés ou non, émanant des établissements d’enseignement et de recherche français ou étrangers, des laboratoires publics ou privés.
ACTN3 genotypes: Contribution to TMD prevalence in
a cohort of dentofacial deformities
Romain Nicot, Kay Chung, Alexandre Vieira, Gwénaël Raoul, Joël Ferri,
James Sciote
To cite this version:
Romain Nicot, Kay Chung, Alexandre Vieira, Gwénaël Raoul, Joël Ferri, et al.. Condyle modeling stability, craniofacial asymmetry and ACTN3 genotypes: Contribution to TMD prevalence in a co-hort of dentofacial deformities. PLoS ONE, Public Library of Science, 2020, 15 (7), pp.e0236425. �10.1371/journal.pone.0236425�. �inserm-02917087�
RESEARCH ARTICLE
Condyle modeling stability, craniofacial
asymmetry and ACTN3 genotypes:
Contribution to TMD prevalence in a cohort of
dentofacial deformities
Romain NicotID1*, Kay Chung2, Alexandre R. Vieira3, Gwe´nae¨l Raoul1, Joe¨l Ferri1, James J. Sciote2
1 Department of Oral and Maxillofacial Surgery, Univ. Lille, Inserm, CHU Lille, U1008—Controlled Drug
Delivery Systems and Biomaterials, Lille, France, 2 Department of Orthodontics, Temple University, Philadelphia, PA, United States of America, 3 Department of Oral Biology, University of Pittsburgh School of Dental Medicine, Pittsburgh, PA, United States of America
*romain.nicot@gmail.com
Abstract
Craniofacial asymmetry, mandibular condylar modeling and temporomandibular joint disor-ders are common comorbidities of skeletally disproportionate malocclusions, but etiology of occurrence together is poorly understood. We compared asymmetry, condyle modeling sta-bility and temporomandibular health in a cohort of 128 patients having orthodontics and orthognathic surgery to correct dentofacial deformity malocclusions. We also compared
ACTN3 and ENPP1 genotypes for association to clinical conditions. Pre-surgical
posterior-anterior cephalometric and panometric radiographic analyses; jaw pain and function ques-tionnaire and clinical examination of TMD; and SNP-genotype analysis from saliva samples were compared to assess interrelationships. Almost half had asymmetries in need of surgi-cal correction, which could be subdivided into four distinct morphologisurgi-cal patterns. Asym-metric condyle modeling between sides was significantly greater in craniofacial asymmetry, but most commonly had an unanticipated pattern. Often, longer or larger condyles occurred on the shorter mandibular ramus side. Subjects with longer ramus but dimensionally smaller condyles were more likely to have self-reported TMD symptoms (p = 0.023) and significantly greater clinical diagnosis of TMD (p = 0 .000001), with masticatory myalgia most prominent. Genotyping found two significant genotype associations for ACTN3 rs1671064 (Q523R mis-sense) p = 0.02; rs678397 (intronic SNP) p = 0.04 and one significant allele association rs1815739 (R577X nonsense) p = 0.00. Skeletal asymmetry, unusual condyle modeling and TMD are common and interrelated components of many dentofacial deformities. Imbal-anced musculoskeletal functional adaptations and genetic or epigenetic influences contrib-ute to the etiology, and require further investigation.
a1111111111 a1111111111 a1111111111 a1111111111 a1111111111 OPEN ACCESS
Citation: Nicot R, Chung K, Vieira AR, Raoul G, Ferri J, Sciote JJ (2020) Condyle modeling stability, craniofacial asymmetry and ACTN3 genotypes: Contribution to TMD prevalence in a cohort of dentofacial deformities. PLoS ONE 15(7): e0236425.https://doi.org/10.1371/journal. pone.0236425
Editor: JJ Cray, Jr., Ohio State University, UNITED STATES
Received: February 11, 2020 Accepted: July 6, 2020 Published: July 29, 2020
Copyright: This is an open access article, free of all copyright, and may be freely reproduced, distributed, transmitted, modified, built upon, or otherwise used by anyone for any lawful purpose. The work is made available under theCreative Commons CC0public domain dedication. Data Availability Statement: All relevant data are within the paper and its Supporting Information files.
Funding: YES - This work is supported by the National Institute of Dental & Craniofacial research through a grant to Dr. Sciote; Musculoskeletal Heritable Influences on Malocclusion -R21DE022427.
Competing interests: The authors have declared that no competing interests exist.
1. Introduction
Growth and stability of the mandibular condyle is essential for attainment and maintenance of mandibular size and morphology. Agenesis, trauma, local infectious pathologies and juvenile idiopathic arthritis all produce similar and distinctive mandibular morphologic disruptions, due to decreased growth in length and normal attainment of transverse width. [1] These con-dylar growth deficiencies result in skeletal class II open bite malocclusions characterized by a downward and backward growth rotation at the joint articulation and a pronounced antigo-nial notch. Variability in diminished mandibular length and severity of the dysmorphology is directly related to the chronologic age at which condylar disturbance is first encountered, as demonstrated in case reports of patients with either infections or trauma. [2] In normal joint growth, the condyles are adaptive to variable forces produced by differences in jaw morphol-ogy and muscle function. [3] This can result in quite variable changes in length, area and ori-entation when jaw growth is imbalanced or disproportionate. [4] When transverse skeletal or dental imbalances develop, the condyles adapt by not obtaining normal growth in size, espe-cially in the medio-lateral dimension. [5] These transverse adaptations are reportedly more at risk for development of condyle displacement within the joint and temporomandibular joint disorders (TMD). [6–8]
Dentofacial deformity patients develop the most disproportionate skeletal variations of nor-mal growth and are most likely to have TMJ dysfunction and symptoms. [9] Orthodontic and orthognathic surgical treatments have recently been documented as effective therapies in restoring facial balance and relieving TMD signs and symptoms, especially for related arthral-gia or myalarthral-gia. [10,11] TMD is also more likely to be associated with dentofacial deformities when a component of the malocclusion involves a significant imbalance in facial symmetry. [12] Well know arthritic conditions like idiopathic condylar resorption may produce skeletal malocclusions and TMD, but in most dentofacial deformity patients condylar modeling is more subtle, and therefore not always considered in treatment planning and outcomes. We recently developed a method for measuring normal condyle geometry variations in a group of patients with dentofacial deformities which revealed differences in condylar length or area between left and right sides. [13] Through genetic analysis we identified a genetic variant in theENPP1 gene (rs937300) which associated with these variations as a potential causal factor,
since it functions as an inhibitor of hydroxyapatite formation during mineralization. The find-ing indicates that some individuals may be more susceptible to condyle modelfind-ing due to both functional influences and inherent quality of bone adaptation.
When craniofacial asymmetry was present, these patients reported a significantly elevated level of pain and jaw dysfunction. [14] This coincided with significantly elevated clinical diag-nosis of disc displacement with reduction, myalgia, arthralgia and TMD related headache. In discriminating between different patterns of asymmetry, we developed a new posterior ante-rior cephalometric analysis which distinguishes four anatomic subclassifications (group one— four), each with a different rate of TMD symptoms. The mandibular asymmetry categories are described in the Materials and Methods, Section 2.3. In group three, chin deviation is displaced to the side of the face which also has the longer ramus length. This unusual subclassification of asymmetry is very common and results in the highest rate of patient reported TMD symptoms. [14] Genetic analysis revealed that an additional variant inENPP1 (rs858339) associated with
this asymmetry pattern. Group two and three had the highest rates of reported TMD symp-toms, and four had the lowest—even though skeletal imbalance was the most pronounced in this group. Therefore the posterior anterior cephalometric classification of asymmetry may indicate which groups are at higher risk for having or developing TMD, but does not discern which individuals within a group are predisposed. Although other predisposing factors such as
variations in the functional environment are arguably a primary factor influencing TMD, two possible explanations could be differences in condyle geometry variation, during or after growth, and genotype.
Since mandibular morphology is a heritable trait, it is important to consider genetic and epigenetic (functional) influences upon condylar growth and adaptation. [15,16] Fibroblast growth factor 2 (FGF-2) is a primary growth promoter of condylar cartilage growth during development. [17] In animal models where lateral functional shift of the mandible are intro-duced, condylar FGF-2 expression is increased on the protruded ramus side and decreased on the contralateral retrusive side, introducing asymmetric changes in chondrocyte activity and cartilage morphology. [18] FGF-2 promotes ENPP1 activity, resulting in enhanced subcondral bone mineralization. [19]ENPP1 has at least 66 functional variants, some of which might
respond differently to condylar environmental influences. [20] Therefore, changes in left ver-sus right condyle morphology demonstrated in condyle geometry variation could be the result of developing facial asymmetry during growth, rather than the primary cause. An additional influence on ENPP1 expression isACTN3 genotype. In Actn3-/- mice ENPP1 gene expression
is increased, resulting in lowered limb bone mineralization apposition rate, trabecular number and bone volume. [21] We recently associated the commonACTN3 R577X mutation which
results in lack of protein expression, with skeletal Class II malocclusion. The initial hypothesis is the lack of ACTN3 protein results in diminished subcondral bone growth or maintenance through increased ENPP1 activity. [22]
To further understand variation in presentation of TMD signs and symptoms, we evaluated how different patterns of craniofacial asymmetry, asymmetric condyle geometry variation and
ENPP1 or ACTN3 genotypes might interact, in a cohort of dentofacial deformities subjects
already included in previous studies. [13,14,22,23] These findings may be of diagnostic predic-tive value in counseling patients for their potential risk for developing or aggravation of TMD.
2. Materials and methods
2.1 Subjects
Subjects with dentofacial deformities who were undergoing elective orthognathic surgery for correction of dento-maxillo-facial dysmorphology (normal variations in jaw geometry which produce malocclusion and facial imbalance) were recruited for study from the Department of Oral and Maxillofacial Surgery, Roger Salengro Hospital, Lille France, after signing an informed consent to participate. The clinic serves an area of northern France of about 4 mil-lion inhabitants under the country’s National Health Service, and is the region’s primary cen-ter for maxillofacial surgery. The population for recruitment were non-growing adolescents or adults with a mean age of 26 years and 76% female. They were undergoing combined ortho-dontic and surgical treatments which included pre-surgical orthoortho-dontics, at least a mandibular bilateral sagittal split osteotomy, in conjunction with Lefort osteotomies of the midface as nec-essary, and a second round of post-surgical orthodontics to finalize occlusion. The study included subjects without other systemic conditions, and excluded those undergoing surgery for facial trauma, tumor, condylar hypertrophy or idiopathic resorption, rheumatoid or osteo-arthritis, and congenital craniofacial syndromes or developmental conditions that might influ-ence craniofacial growth. [24] Clinical diagnoses of each patient were summarized at the time of surgery to include the sagittal and vertical malocclusion classification, based upon the extent of required sagittal, vertical and transverse repositioning of jaws estimated in the surgical treat-ment plan. De-identified information for study included radiographic and diagnostic images, calibrated for magnification, details of the surgery along with information for height, weight, race, ethnicity, age and sex. Subjects signed an informed consent form, and the research
protocol was validated by the French independent ethical committee (Certificate CPP12/44), the Temple University Temple (Certificate 13438) and the University of Pittsburgh institu-tional review boards (Certificate PRO12080373).
2.2 Condyle geometry variation assessment
Although there is no widely accepted method to assess condyle modeling as part of normal growth or physiologic adaptation after maturation, the metric method (two dimensional radio-graphic measurements) have historically been utilized. [25,26] In our patient population, we recently developed a metric measurement method that compares morphometric differences between left and right condyle height or condyle area on panoramic radiographs. [13] Two lines were constructed to evaluate condylar height, one drawn tangential to the posterior edge of the mandible passing through the most posterior points of the condyle and mandibular ramus, and the perpendicular line passing through the lower end of the mandibular notch. Condylar height was measured perpendicular to the latter between the mandibular notch and the highest point of the condylar unit (Fig 1A). The surface of the condylar unit was measured, contouring the lowest point of the mandibular notch to thelingula mandibulae, then
perpen-dicular to the rear edge of the mandibular ramus (Fig 1B). Bone modeling was determined by a differential measurement of condylar height or condylar surface defined by a percentage in relation to the larger side between right and left sides on a pre-surgical panoramic radiograph. From this patient data we were able to associate a genetic variant inENPP1 with mandibular
condyle geometry variation. [13] For comparison, we utilized this existing data base, in combi-nation with an assessment of craniofacial asymmetry to determine associations with TMD or genetic variations. Differences greater than 3% between sides were considered positive for condyle modeling and recorded as percentage difference between sides. Differences less than 3% were recorded as no difference between sides or 0%. Landmarks have been defined on
Fig 1. Panoramic landmarks related to condyle modelling measurements. A–Two lines were constructed to evaluate condylar height, one drawn tangential to the posterior edge of the mandible passing through the most posterior points of the condyle and mandibular ramus, and the perpendicular line passing through the lower end of the mandibular notch. Condylar height was measured perpendicular to the latter between the mandibular notch and the highest point of the condylar unit. B— The surface of the condylar unit was measured, contouring the lowest point of the mandibular notch to thelingula mandibulae, then perpendicular to the rear edge of
the mandibular ramus. Bone modeling was determined by a differential measurement of condylar height or condylar surface defined by a percentage in relation to the larger side between right and left sides on a pre-surgical panoramic radiograph.
calibrated radiographs, using a cephalostat. Data acquisition has been performed by two observers, jointly defining the landmarks. All measures were done using ImageJ software (National Institute of Health, Bethesda, MD, USA).
2.3 Asymmetry assessment and classification
Craniofacial asymmetry is a type of dentofacial deformity which has a unique set of morpho-logic variations for which there have been many classification approaches. We recently devel-oped a new diagnostic assessment based upon 17 anatomic landmarks on posteroanterior cephalometric radiographs. [14] These landmarks were converted into 6 cephalometric metric assessments which characterized four different asymmetry subtypes present in the population (Fig 2). We characterized these as group 1: asymmetry of the mandibular body, but symmetry in mandibular rami (sometimes termed “mandibular yaw”); group 2: differences in left and right ramus heights, with mandibular chin deviated towards the shorter ramus height side (what most clinicians would refer to as a typical facial asymmetry); group 3: differences in ramus heights with mandibular chin point deviated towards the longer ramus height side (an “atypical” facial asymmetry); and group 4; differences in left and right ramus heights, with mandibular chin deviated towards the shorter ramus height side (as with group 2) but in addi-tion with pronounced maxillary midfacial canting. From the cephalometric analysis patients were classified as symmetric or asymmetric, and if asymmetric into subtypes. From these patient groupings we previously found asymmetry group 2 and 3 had the highest incidence of pre-surgical TMD, and groups 1, 3 and 4 had significant associations with genetic variants in
ENPP1 [14]. In the present study we compared these classifications for asymmetry to differ-ences on condyle geometry, as determined in section 2.2.
2.4 Assessment of temporomandibular disorders
Temporomandibular joint functioning was assessed as a routine part of the pre-surgical evalu-ation using the Diagnostic Criteria for TMD (DC/TMD). [27] Overall this young population is not presenting with fibromyalgia or pain related disability diagnosed in Axis II of the diagnos-tic criteria. The three common Axis I disorders associated with asymmetry in the population were disc displacement with reduction (DDR) (78%), myalgia (61%) and arthralgia (33%). [14] We use the jaw pain and function (JPF) questionnaire to assess patient reported symptoms as an indication of perceived severity before and one year after jaw surgery. [23] The JPF was developed as a simple screening tool to determine presence of TMD. [28] It consists of eight questions about jaw pain and five questions related to jaw function. The questionnaire has been validated to reliably distinguish between normal (scores < 6) and TMD subjects
(scores � 6) with up to 98% sensitivity and 100% specificity. [29] It has been validated in Euro-pean translations [30] and we use a French version. [14,23] In this assessment, we included TMD patients with positive diagnosis for DDR, myalgia and/or arthralgia. Patients with posi-tive clinical diagnosis for other, less common forms of TMD were excluded from study since they were insufficient number to investigate.
2.5 Comparing condyle variation with facial asymmetry
A total of 128 subjects had complete data sets for comparison of condyle variation with sym-metry classification. We compared condyle height or condyle surface as percent differences between sides, and which side, either left or right, was longer or larger to the symmetry classifi-cation of patients. Symmetric subjects and those in asymmetry group 1 had equal left and right mandibular ramus length. In the other three asymmetry groups one ramus was larger in length and one smaller. In groups 2 and 4 the chin, as indicated by the mandibular menton landmark,
was deviated away from the facial midline towards the shorter ramus length side. In group 3 the chin however was deviated away from the facial midline towards the longer ramus length side.
In comparing condyle differences to these patterns of chin and ramus asymmetry, we antic-ipated finding that the longer or larger condyle would be located on the same side as the longer ramus. However, this was not true in the majority of patients. Rather, it was more likely that increased condyle dimension was located on the side with the shorter ramus dimension. Because of this unexpected finding, we further classified asymmetry groups into those who fol-lowed the normal, expected pattern or those with an unexpected pattern as follows: (Table 1).
This criteria recognizes that in asymmetry group 3 the menton is deviated towards the shorter ramus side, but since the ramus is longer on this side, it is anticipated that condyle dimension would also be larger. Figs3and4compare of one subject in group 3 which had nor-mal condyle modeling (1) and one with abnornor-mal modeling (2).
Based upon this realization the anatomical investigation to study had two primary end-points: 1) determine the frequency of condyle variation in patients with symmetry compared to asymmetry and 2) determine if condyle variation could have contributed to differences in TMD, in the differing patterns of asymmetry.
2.6 Genotyping
Saliva samples were collected during the pre-surgical evaluation and processed utilizing DNA Genotek kits. Genomic DNA was used for profiling of polymorphisms using TaqMan chemis-try [31] and for sequencing using an automatic sequence-detection instrument (ABI Prism 7900HT, Applied Biosystems). Seven single nucleotide polymorphisms were selected if geno-typing: inACTN3 rs1671064, rs1815739 and rs678397 [22] and inENPP1 rs937300,
rs6569759, rs858339, and rs1409181. [23] The asymmetry population was compared for SNP variants between normal versus abnormal modeling, as summarized inTable 1, section 2.5.
2.7 Statistical testing
Differences in condyle height or condyle area were compared between all symmetric and all asymmetric subjects using an unpairedt test, and an ANOVA for comparison between the
dif-ferent asymmetry groups. For relationship to TMD, JPF scores were compared for each indi-vidual asymmetry group between normal growth and abnormal growth by indiindi-vidual unpairedt tests. In cases where individual asymmetry group comparisons revealed no
signifi-cant differences for JPF, all asymmetry groups were averaged together (normal vs. abnormal
Fig 2. Prototypes for four asymmetry subtypes and illustration of PA cephalometric tracing. Group 1—mandibular body asymmetry, but symmetry in mandibular rami (sometimes termed “mandibular yaw”); Group 2—ramus asymmetry: differences in left and right ramus heights with mandibular chin deviated towards the shorter ramus height side; Group 3—atypical asymmetry: differences in ramus heights with mandibular chin point deviated towards the longer ramus height side; and Group 4—C-shaped asymmetry: differences in left and right ramus heights, with mandibular chin deviated towards the shorter ramus height side (as with group 2) but in addition with pronounced maxillary midfacial canting. Landmarks used for cephalometric analysis labeled on Group 4.
https://doi.org/10.1371/journal.pone.0236425.g002
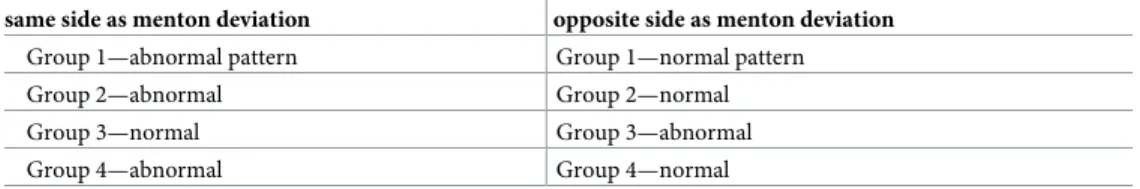
Table 1. Criteria for normal vs. abnormal condyle variation in asymmetry condyle height or area difference. same side as menton deviation opposite side as menton deviation
Group 1—abnormal pattern Group 1—normal pattern
Group 2—abnormal Group 2—normal
Group 3—normal Group 3—abnormal
Group 4—abnormal Group 4—normal
condyle height and area), and compared by Studentt tests to determine significance. For
clini-cal diagnoses of TMD, Chi-square tests were used to compare individual and all TMD diagno-ses between individual asymmetry groups, and for the number of TMD diagnosis between all normal vs. abnormal condyle height and area groups. Chi-square and Fisher’s exact tests were used to determine the over-representation of genotypes and alleles.
3. Results
3.1 Differences in condyle modeling between symmetry and asymmetry
Complete data was available from 128 subjects, 56 were classified within one of four craniofa-cial asymmetry groups from posterior anterior cephalometric analysis. When compared for differential bone modeling of mandibular condyles from panoramic radiographic analysis, there were very significant differences between symmetric vs asymmetric subjects. In the sym-metric group there was a mean condyle height variation between sides of 7.37%± 5.49, com-pared to 10.89%± 7.39 for the asymmetric group, which was significantly different
(p = 0.0025). The condyle area mean difference in symmetrics was 8.22% ± 5.53, while the
asymmetric group difference was 10.35%± 8.35, which was nearly significantly different at (p = 0.08).
Within the asymmetry population individual groups were compared to determine if there was a difference in the amount of left compared to right condyle height or area modeling. There was no significant differences for condyle height, but there was a significant difference for condyle area (p = 0.02). For condyle area, the amount of difference between sides increased
as the severity of asymmetry became more pronounced. Group 1 had a mean area difference of 4.41%, group 2–11.62%, group 3–14.17% and group 4–16.56%.
3.2 TMD differences in asymmetries between normal and abnormal
condyle modeling
We investigated whether normal vs abnormal condyle growth modeling, based upon study cri-teria (Table 1), might contribute to differences in TMD prevalence. This revealed that abnor-mal condyle modeling was the most common finding throughout the classifications of asymmetry (Table 2). For condylar height, abnormal modeling ranged from 50 to 70 percent. For condylar area, modeling rates were higher in most groups, at rates between 50 and 75. Only asymmetry group 2 had and almost equal distribution of normal versus abnormal modeling.
We compared patient reported TMD symptoms using the JPF questionnaire between nor-mal and abnornor-mal condyle height or area, for each asymmetry group. The abnornor-mal condyle height group had a mean JPF score or 6.3 while the normal group score was 4.7, demonstrating an almost significant difference in symptomsp = 0.055. Those with abnormal condyle area
reported mean JPF score of 5.8 compared to the normal area group score of 5.5, resulting in no significant differencep = 0.75. When abnormal condyle height or area were grouped
together for the entire population, there was an elevation in mean JPF score to 6.65 by compar-ison to 5.33 in normal modeling group (p = 0.023). Patient symptoms were greater in
asymme-try groups 2 and 3, and either abnormal height or areas contributed to pain and functional differences at approximately the same rate.
Fig 3. Illustration of normal condyle modeling. Subject from asymmetry group 3, atypical asymmetry, with menton deviated toward longer ramus side. Condyle geometry variation defined as “normal” due to longer and larger condyle on side with longer ramus length.
Clinical diagnosis of TMD was compared between normal and abnormal modeling for the population. Since multiple positive diagnoses were common, we first assessed if TMD was present or absent, regardless of single or multiple diagnoses in each patient, which we called “all TMD” patients. This overall positive versus negative comparison revealed a strong trend with a relative higher prevalence of ‘all TMD” in the abnormal group (p = 0.05) (Table 3). In individual TMD diagnoses of headache, myalgia, arthralgia, disc displacement with reduction and disc displacement without reduction there were no significant differences. However, there was a trend for diagnosis of myalgia (p = 0.06). When total, multiple individual diagnoses were
grouped for overall comparison, there was affirming data that abnormal condyle modeling resulted in increased problems with TMD (p = 0 .000001).
3.3 Genotype differences
For genotype comparisons we grouped all abnormal condyle height and abnormal condyle area modeling subjects together and compared them to those with normal modeling in each individual asymmetry group. ForENPP1 there were no significant differences in genotypes or
alleles for SNPs rs937300 (p range values 0.29 to 0.88), rs6569759 (p range values 0.85 to 0.92)
or rs858339 (p range values 0.37 to 0.51). ForACTN3 however there were significant
differ-ences in group 2 for genotypes rs1671064 (p = 0.02), rs678397 (p = 0.04) and alleles 1815739
(p = 0.00) (Table 4). There was a trend for rs1815739 genotypes (p = 0.08). Results were most
likely positive in group 2 since it had the most subjects for comparison.
4. Discussion
4.1 Condylar role in mandibular modeling
Modeling is the process by which bone enlarges and takes shape during normal growth. Modeling is a complimentary process of resorption or deposition to generate new tissue dur-ing homeostasis or for modification of size and shape. The condyle contributes to both man-dibular modeling and modeling during normal growth, and has inherent capacity to remodel after growth is completed through chondrocyte sensitivity to variations in mechanotransduc-tion. [32] These effects are well documented in orthodontic treatment of Class II malocclu-sions with repositioning appliances, where condyles enlarge in anterior-posterior dimension, compared to untreated controls in adolescent or even young adult patients. Ramus modeling can also occur at the same time as changes in condyle dimensions. [33] This ability to adapt and transition from chondrogenesis to osteogenesis is a unique anabolic feature of condylar
Fig 4. Illustration of abnormal condyle modeling. Subject from asymmetry group 3, atypical asymmetry, with menton deviated toward longer ramus side. Condyle geometry variation defined as “abnormal” due to longer and larger condyle on side with shorter ramus length.
https://doi.org/10.1371/journal.pone.0236425.g004
Table 2. Condyle modeling proportions in asymmetries.
height modeling area modeling
abnormal normal abnormal normal
n % n % n % n % asymmetry group 1 5 62.5 3 37.5 6 75 2 25 asymmetry group 2 11 48 12 52 12 52 11 48 asymmetry group 3 12 66.6 6 33.3 13 72 5 28 asymmetry group 4 5 71 2 29 4 57 3 43 https://doi.org/10.1371/journal.pone.0236425.t002
cartilage. In environments where forces differ in the transverse occlusal plane due to crossbite, some reports have identified asymmetrical condylar modeling, while other have not. In most studies considering skeletal asymmetries of the mandible, condyles are reported to be asym-metric, with decreased cross sectional area, surface size and ramal height on the deviated side. [34,35]
As descriptive morphology of craniofacial asymmetries has advanced, several classification approaches which emphasize mandibular roll, pitch and yaw have established that ramus length, menton deviation and condylar morphological variations do not always match each other, and ramus height may be longer on the same facial side to menton deviation. [14] We recently developed a posterior–anterior celphalometric analysis utilizing six measurements, with four of these detecting mandibular differences between the body, width, ramus length and menton deviation. When viewed by principal component analysis, symmetric and asymmetric faces cluster as distinct groups. Variability in asymmetric groups 1–4 revealed that principal compo-nents clustered by differences between the left and right mandibular sides, indicating that a con-sistent geometric variability explained differences in morphology between them. [14] The main fluctuating variable between groups is the relationship of chin deviation in the transverse plane to left vs right ramus length differences between sides. With regard to these relationships, this study has demonstrated two distinct patterns of asymmetry which have not been commonly recognized previously. First, it is almost equally common to have longer ramus length on the same side as chin deviation as it is to have a longer ramus on the contralateral side. Second, the condyle on the longer ramus side may be geometrically smaller than on the shorter ramus side, regardless of the specific menton to ramus relationship. Insight into these different patterns of
Table 3. Differences in TMD diagnosis between normal and abnormal condyle modeling.
Condyle group 1 group 2 group 3 group 4 total
area + height abnormal (11)� normal (5) abnormal (23) normal (23) abnormal (25) normal (11) abnormal (9) normal (4) abnormal (68) normal (43) Chi-squared test all TMD 3 1 13 8 11 3 1 0 28 10 p = 0.05 headache 0 0 3 1 2 0 1 1 6 2 p = 0.41 myalgia 3 1 8 5 15 2 1 2 27 10 p = 0.06 arthralgia 0 0 3 4 6 4 0 0 9 8 p = 0.42 DDR 2 0 9 5 15 6 1 1 27 12 p = 0.19 DD w/o R 0 0 2 0 5 1 0 0 7 1 p = 0.11
total positive TMD Diagnoses (including multiple diagnosis for each subject) 68 33 p = 0 .000001
�(n) indicates total number of subjects per group; DDR = Disc displacement with reduction; DD w/o R = Disc displacement without reduction without limited opening.
https://doi.org/10.1371/journal.pone.0236425.t003
Table 4. Comparison of SNP genotypes by condyle modeling pattern.
Gene ACTN3 rs1671064 (Q523R) p value rs1815739 (R577X) p value rs678397 (intronic) p value
SNP GG GA AA genotype/allele TT CC TC genotype/allele TT CC CT genotype/allele
Group 1 normal 2 (15) 7 (54) 4 (31) p = 0.15/ 0.08 2 (15) 4 (31) 7 (54) p = 0.11/ 0.07 2 (15) 4 (31) 7 (54) p = 0.15/ 0.07 abnormal 2 (66) 1 (33) 0 2 (66) 0 1 (33) 2 (66) 0 1 (33) Group 2 normal 5 (22) 18 (78) 0 p = 0.02/ 0.08 9 (33) 1 (4) 17 (63) p = 0.08/ 0.00 10 (40) 1 (4) 14 (56) p = 0.04/ 0.08 abnormal 5 (26) 9 (48) 5 (26) 5 (26) 6 (32) 8 (42) 6 (31) 6 (31) 7 (38) Group 3 normal 2 (8) 14 (61) 7 (31) p = 0.69/ 0.49 2 (4) 6 (33) 16 (63) p = 0.84/ 0.34 2 (10) 7 (33) 12 (57) p = 0.72/ 0.64 abnormal 2 (12) 11 (69) 3 (19) 2 (12) 3 (19) 11 (69) 2 (15) 3 (21) 9 (64) Group 4 normal 4 (40) 6 (60) 0 p = 0.73/ 0.79 4 (40) 0 6 (60) p = 0.3/ 0.79 4 (40) 2 (20) 4 (40) p = 0.62/ 0.45 abnormal 2 (50) 2 (50) 0 2 (50) 0 2 (50) 2 (50) 0 2 (50) https://doi.org/10.1371/journal.pone.0236425.t004
asymmetry most likely arise from the number of subjects we have been able to evaluate and compare, rather than previous studies with a more limited population from which these more subtle variations would be less possible to distinguish. These findings raise important clinical questions in patient diagnosis, treatment and management, since differences may relate to intrinsic genetic factors and risk of pre or post treatment TMD and stability.
4.2 Condyle modeling and signs or symptoms of TMD
In our population, asymmetric subjects have both higher clinical diagnoses of TMD and higher reported TMD symptoms, as indicated by the JPF survey. [14] Yet within individual asymmet-ric groups, the standard deviation for mean values of patient reported symptoms are quite high. This is especially true for group three which had a mean JPF score of 9.11±5.62. Likewise group two, also with elevated symptoms had JPF score of 6.94±5.46. Therefore we evaluated if the pattern of condyle modeling might influence symptom variability by comparing expected versus unexpected geometry variations (Table 1). This resulted in a significantly elevated (p = 0.02) level of patient reported symptoms when modeling did not match with ramus height
or area differences. For TMD diagnosis the same comparison revealed a significant difference for subjects with at least one positive finding (p = 0.05) (Table 3). While the individual types of TMD were not significant, when the total number of patient diagnoses were compared, there was very significantly elevated differences (p = 0.0001). This resulted since those with
abnor-mal condyle modeling most often had multiple combinations of different types of TMD. The most common TMD diagnoses in both normal and abnormal groups were masticatory muscle myalgia and disc displacement with reduction, with abnormals almost three times more likely to have myalgia and twice as likely to have disc displacement. Arthralgia rates were almost equal between groups. In abnormal modeling arthralgia was not nearly as likely, with a ratio of 3:1 compared to myalgia. Since presence of arthritic conditions or condylar resorption were part of the study exclusion criteria, the study considered if differences in condylar modeling produced different rates of arthralgia, and found no difference.
An opposite finding occurred for myalgia and disc displacement with reduction, which are much more likely with abnormal condyle modeling. Myalgia was the only individual TMD diagnosis which was almost significantly different for condyle modeling (p = 0.06), and
emerged as the solitary clinical diagnosis most related to abnormal modeling (Table 3). The asymmetric patients under study had significant skeletal imbalances, when evaluated by poste-rior-anterior cephalometric analysis, with the greatest skeletal variation being ramal height dif-ferences at p < 0.0001. [14] Muscle functioning is also imbalanced in craniofacial asymmetry, with a significant increase in fast twitch skeletal muscle fibers on the side to which the menton was deviated, when analyzed from masseter muscle biopsy during surgery. [14] Imbalanced force during whole muscle contraction in repetitive athletic activity is a well-known cause of myalgia, especially in the lower back and shoulder. Women athletes with hip strength asymme-try, a type of hip muscle imbalance, are more likely to develop occurrences of low back pain. [36] For male wheelchair athletes, weakness in humeral head depressors, a shoulder muscle imbalance, can result in development of rotator cuff impingement syndrome. Muscle rather than joint pain may also arise from repetitive, unvaried, continuous locomotion and often affect women more than men in the upper extremities. [37]
The TMJ is a unique craniofacial joint since there are three articulations, each joint and the occlusion. Postural and functional position of the jaws is coordinated by afferent input from muscle spindles throughout the head and neck and imbalances in the trigeminal motor system can produce imbalanced stress distribution throughout the cervical spine. [38] Facial skeletal asymmetry produces functional imbalances in masticatory muscles with greater activation on
the longer ramus side. This produces an uneven stress distribution in the mandible, which may occur due to either differences in masticatory muscle forces or skeletal geometry. [38] The TMJ can buffer imbalanced mechanical stress by alteration in rates of chondrogenesis, which may be the etiology of abnormal condyle modeling. In animal models, imbalance in masticatory muscle activity results in asymmetric growth of subcondral bone to normalize stress distributions. [39] This presents the interesting possibility that individual patients adapt better to craniofacial asymmetry if condyle geometry differences provide positive stress sup-port within the joint. Imbalances may also explain why patients experience high rates of myal-gia, since increased peripheral activation of masseter muscle spindles can contribute to and help maintain chronic muscle pain. [40]
4.3
ACTN3 anpd ENPP1 genotypes
ENPP1 is a trans membrane glycoprotein which synthesizes inorganic phosphate from extra-cellular ATP, inhibiting hydroxyapatite formation. SNPs inENPP1 are associated with a large
number of bone diseases and abnormal bone and joint morphology. Different mechanical strain environments changeENPP1 expression which can lead to either protection or
calcifica-tion of endplate cartilage chondrocytes. [41] In the mandible we recently found the rs937300 SNP associated with variation in condyle geometry between left and right sides. [13] The GG genotype was protective against condyle height reduction. Therefore it is likely that both geno-type and functional variations contribute to the pattern of condyle modeling. Two SNPs also associated with either group 1 or group 3 craniofacial asymmetry. [14] Therefore, we evaluated the possibility thatENPP1 variants also contributed to abnormal condyle modeling, but have
so far found no associations.
ENPP1 and ACTN3 are connected in bone adaptation by an unknown biologic mechanism. Nevertheless, in Actn3-/- mice osteoblasts have up-regulated expression of ENPP1 which may lead to differences in mineralization rates. [21] Thisin vitro connection is consistent with
dis-ruption of normal mineralization resulting in an overall decrease in bone mass inα-actinin-3 deficiency. In humans theACTN3 R577X (rs1815739) null polymorphism associates with
higher serum levels of modeling markers, which may make bone more susceptible to geometry variations. [42] We found a very significant association (p < 0.0001) for R577X allele
differ-ences, with the X allele (null polymorphism) elevated in the normal condyle modeling group. There were additional significant associations forACTN3 rs1671064 and rs678397 genotypes.
rs1671064 is the Q523R polymorphism which produces an A to G transition not know to have functional consequences. Q523R however has been found to have linkage disequilibrium with R577X, [43] and this may indicate that R577X being tested is in close proximity (in linkage dis-equilibrium) with Q523R, which we could speculate is the actual genetic variant (mutation) that is leading to condyle modeling and TMD symptoms. rs678397 is an intronic SNP which has previously been identified as having a very significant association (p = 0.003) with skeletal
class II malocclusions, most likely through variations in condylar growth. [22] All of these findings indicate that bothENPP1 and ACTN3 genotypes associate with varying patterns of
condyle modeling in ways which are not yet understood.ACTN3 genotypes can influence ENPP1 expression, as can changes in cartilage mechanical strain environments. [40] Differing biomechanical forces as epigenetic factors and intrinsic genetic differences, both contribute to the pattern of condyle modeling stability or instability, and require further investigation.
4.4 Study shortcomings
The study used conventional posterior anterior cephalograms and panoramic radiographs to determine morphologic differences in the pattern of craniofacial asymmetry and condyle
modeling. These imaging modalities are routinely utilized in radiographic evaluation of dental patients. Although commuted tomography (CBCT) is more precise, current clinical guidelines from the American Dental Association and American Association and Pediatric Dentistry rec-ommend prescription of panoramic radiographs for routine periodic imaging.
Although the study investigated a relatively large number of patients, the study protocol separated participants almost in half for symmetry, and the asymmetric subjects were eventu-ally sub divided into 8 groups for asymmetry type and condyle remolding differences. This resulted in statistical comparisons between limited numbers of patients between groups, and the most important study shortcoming. Future directions will include ongoing studies with larger subject numbers to further understand how condyle modeling and craniofacial asym-metry arise and interact.
4.5 Conclusions
In dentofacial deformity subjects, craniofacial asymmetry, abnormal patterns of condyle modeling and TMD are common comorbidities. Condyle geometry variations between man-dibular sides and TMD are more common if asymmetry is present as part of the deformity. Often, asymmetric condyle geometry variation does not match differences in ramus length, found in different classifications of facial asymmetry. TMD signs and symptoms are more likely when condyle variations and ramus asymmetry do not match. The most common TMD diagnosis is masticatory muscle myalgia, which likely results from unequal force distributions.
ACTN3 genotypes under study associate with asymmetric condyle modeling and Q523R
(mis-sense) may be in linkage disequilibrium with R577X, the common null polymorphism. These findings further diagnostic precision for interpreting which individual patients might have or develop TMD with or without symptoms. Those in asymmetry groups two and three with imbalanced condyle geometry variation seem to be most at risk, and this is useful diagnostic information. As patients develop asymmetries during maturation, evaluating these features could be important considerations in patient counseling regarding risks for not undergoing surgical treatment to correct skeletal discrepancies.
Supporting information
S1 Data.
(XLS)
Author Contributions
Conceptualization: Romain Nicot, Alexandre R. Vieira, James J. Sciote.
Data curation: Romain Nicot, Kay Chung, Alexandre R. Vieira, Gwe´nae¨l Raoul, Joe¨l Ferri. Formal analysis: Romain Nicot, Kay Chung, Alexandre R. Vieira.
Funding acquisition: James J. Sciote. Investigation: James J. Sciote.
Methodology: Romain Nicot, Alexandre R. Vieira. Project administration: James J. Sciote.
Supervision: James J. Sciote.
Validation: Romain Nicot, Alexandre R. Vieira, Gwe´nae¨l Raoul, Joe¨l Ferri, James J. Sciote. Writing – original draft: Romain Nicot, James J. Sciote.
Writing – review & editing: Romain Nicot, Kay Chung, Alexandre R. Vieira, Gwe´nae¨l Raoul,
Joe¨l Ferri, James J. Sciote.
References
1. Prowler JR, Glassman S. Agenesis of the mandibular condyles: Diagnostic findings and treatment of deformity by polyethylene implant. Oral Surg Oral Med Oral Pathol 1954; 7: 133–139.https://doi.org/10. 1016/0030-4220(54)90043-2PMID:13133340
2. Rabey G. Craniofacial morphogenesis. Proc R Soc Med 1971; 64:103–111. PMID:5548917
3. Mizoguchi I, Toriya N, Nakao Y. Growth of the mandible and biological characteristics to the mandibular condylar cartilage. Jap Dent Sci Rev 2013; 49:139–150.
4. Bjork A. Facial growth in man, studied with the aid of metallic implants. Acta Odontol Scand 1955; 13:9– 34.https://doi.org/10.3109/00016355509028170PMID:14398173
5. Tadej G, Engstrom C, Borrman H, Christiansen EL. Mandibular condyle morphology in relation to mal-occlusions in children. Angle Orthod 1988; 59:187–194.
6. Mohlin B, Ingervall B, Thilander B. Relationship between malocclusion and mandibular dysfunction in Swedish men. Eur J Orthod 1980; 2:229–238.https://doi.org/10.1093/ejo/2.4.229PMID:6961042 7. Williamson EH. Oriented lateral TMJ laminograph symptomatic and nonsymptomatic joints compared.
Angle Orthod 1983; 53:228–233.https://doi.org/10.1043/0003-3219(1983)053<0228:OLTJL>2.0.CO;2
PMID:6579872
8. Al-Rawi NH, Uthman AT, Sodeify SM. Spatial analysis of mandibular condyles in patients with temporo-mandibular disorders and normal controls using cone beam computed tomography. Eur J Dent 2018; 155:99–104.
9. Dhalberg G, Petersson A, Westesson PL, Eriksson L. Disk displacement and temporomandibular joint symptoms in orthognathic surgery patients. Oral Surg Oral Med Oral Pathol 1995; 79:273–277.
10. Abrahamsson C, Henrikson T, Nilner M, Sunzel B, Bondemark L, Ekberg EC. TMD before and after cor-rection of dentofacial deformities by orthodontic and orthognathic treatment. Int J Oral Maxillofac Surg 2013; 42:252–258.
11. Al-Moraissi EA, Wolford LM, Perez D, Laskin DM, Ellis E 3rd. Does Orthognathic Surgery Cause or Cure Temporomandibular Disorders? A Systematic Review and Meta-Analysis. J Oral Maxillofac Surg 2017; 75:1835–1847.https://doi.org/10.1016/j.joms.2017.03.029PMID:28419845
12. Miyatake E, Miyawaki S, Morishige Y, Nishiyama A, Sasaki A, Takano-Yamamoto T, et al. Class III mal-occlusion with severe facial asymmetry, unilateral crossbite, and temporomandibular disorders. Am J Orthod Dentofacial Orthop 2003; 124:435–445.https://doi.org/10.1016/s0889-5406(03)00562-6PMID:
14560275
13. Constant M, Nicot R, Vieira AR, Raoul G, Sciote JJ, Ferri J, et al. Condylar geometry variation is associ-ated with ENPP1 variant in a population of patients with dento-facial deformities. J Craniomaxillofac Surg 2017; 45:826–830.https://doi.org/10.1016/j.jcms.2017.02.020PMID:28381371
14. Chung K, Richards T, Nicot R, Vieira AR, Cruz CV, Raoul G, et al. ENPP1 and ESR1 genotypes associ-ated with subclassifications of craniofacial asymmetry and severity of temporomandibular disorders. Am J Orthod Dentofac Orthop 2017; 152:631–645.
15. Lobb WK. Craniofacial morphology and occlusal variation in monozygotic and dizygotic twins. Angle Orthod 1987; 57:219–233.https://doi.org/10.1043/0003-3219(1987)057<0219:CMAOVI>2.0.CO;2
PMID:3477969
16. Sˇ idlauskas M, SˇalomskienėL, AndriusˇkevičiūtėI, Sˇ idlauskienėM, Labanauskas Zˇ , Vasiliauskas A, et al. Heritability of mandibular cephalometric variables in twins with completed craniofacial growth. Eur J Orthod 2016; 38:493–502.https://doi.org/10.1093/ejo/cjv062PMID:26503948
17. Aoyama Y, Ochiai T, Shen FC, Hasegawa H. Subcutaneous basic FGF-injection accelerates the devel-opment of mandibular condyle of newborn mice during lactation period. J Hard Tissue Biol 2013; 22:293–300.
18. Fuentes MA, Opperman LA, Buschang P, Bellinger LL, Carlson DS, Hinton RJ, et al. Lateral functional shift of the mandible: Part II. Effects on gene expression in condylar cartilage. Am J Orthod Dentofac Orthop 2003; 123:160–166.
19. Nam HK, Liu J, Li Y, Kragor A, Hatch NE. Ectonucleotide pyrophosphatase/phosphodiesterase-1 (Enpp1) regulates osteoblast differentiation. J Biol Chem 2011; 286:39059–71.https://doi.org/10.1074/ jbc.M111.221689PMID:21930712
20. Stella J, Buers I, van de Wetering K, Ho¨hne W, Rutsch F, Nitschke Y, et al. Effects of different variants in the ENPP1 gene on the functional properties of ectonucleotide pyrophosphatase/phosphodiesterase family member 1. Hum Mut 2016; 37:1190–1201.https://doi.org/10.1002/humu.23057PMID:
27467858
21. Yang N, Schindeler A, McDonald MM, Seto JT, Houweling PJ, Lek M, et al.α-Actinin-3 deficiency is associated with reduced bone mass in human and mouse. Bone 2011; 49: 790–798.https://doi.org/10. 1016/j.bone.2011.07.009PMID:21784188
22. Zebrick B, Teeramongkolgul T, Nicot R, Horton MJ, Raoul G, Ferri J, et al. ACTN3 R577X genotypes associate with Class II and deep bite malocclusions. Am J Orthod Dentofac Orthop 2014; 146:603–611.
23. Nicot R, Vieira AR, Raoul G, Delmotte C, Duhamel A, Ferri J, et al. ENPP1 and ESR1 genotypes influ-ence temporomandibular disorders development and surgical-treatment response in dento-deformities. J Craniomaxillofac Surg 2016; 44:1226–1237.https://doi.org/10.1016/j.jcms.2016.07.010PMID:
27519661
24. McCarthy JG, Cutting CB. The timing of surgical intervention in craniofacial anomalies. Clin Plast Surg 1990; 17:161–182. PMID:2406094
25. Bjork A, Skieller V. Normal and abnormal growth of the mandible. A synthesis of longitudional cephalo-metric implant studies over a period of 25 years. Eur J Orthod 1983; 5:1–46.https://doi.org/10.1093/ejo/ 5.1.1PMID:6572593
26. Dibbets K, Muller B, Krop F, van der Welle L. Deformed condyles and craniofacial growth: findings of the Groningen longitudional study. Sem Orthod 2013; 19:71–80.
27. Schiffman E, Ohrbach R, Truelove E, Look J, Anderson G, Goulet JP, et al. Diagnostic criteria for temporomandibular disorders (DC/TMD) for clinical and Research Applications. J Oral Facial Pain Headache 2014; 28:6–27.https://doi.org/10.11607/jop.1151PMID:24482784
28. Clark GT, Seligman DA, Solberg WK, Pullinger AG, et al. Guidelines for the examination and diagnosis of temporomandibular disorders. J Craniomandib Disord 1989; 3:7–14. PMID:2606995
29. Gerstner GE, Clark GT, Goulet JP, et al. Validity of a brief questionnaire in screening asymptomatic subjects from subjects with tension-type headaches or temporomandibular disorders. Comm Dent Oral Eipdemiol 1994; 22:235–42.
30. Undt G, Murakami K, Clark GT, Ploder O, Dem A, Lang T, et al. Cross-cultural adaptation of the JPF-Questionnaire for German-speaking patients with functional temporomandibular joint disorders. J Cra-niomaxillofac Surg 2006; 34:226–233.https://doi.org/10.1016/j.jcms.2005.12.005PMID:16621587 31. Ranade K, Chang MS, Ting CT, Pei D, Hsiao CF, Olivier M, et al. High-throughput genotyping with
sin-gle nucleotide polymorphisms. Genome Res 2001; 11:1262–1268.https://doi.org/10.1101/gr.157801
PMID:11435409
32. Papachristou DJ, Papachroni KK, Papavassiliou GA, Pirttiniemi P, Gorgoulis VG, Piperi C, et al. Func-tional alterations in mechanical loading of condylar cartilage induces changes in the bony subcondylar region. Arch Oral Biol 2009; 54:1035–1045.https://doi.org/10.1016/j.archoralbio.2009.08.010PMID:
19775676
33. Ruf S, Panchrez H. Temporomandibular joint remodeling in adolescents and young adults during Herbst treatment: A prospective longitudinal magnetic resonance imaging and cephalometric radio-graphic investigation. Am J Orthod Dentofacial Orthop 1999; 115: 607–618.https://doi.org/10.1016/ s0889-5406(99)70285-4PMID:10358242
34. Kilic N, Kiki A, Oktay H. Condylar asymmetry in unilateral posterior crossbite patients. Am J Orthod Den-tofacial Orthop 2008; 133: 382–387.https://doi.org/10.1016/j.ajodo.2006.04.041PMID:18331937 35. Iodice G, Danzi G, Cimino R, Paduano S, Michelotti A. Association between posterior crossbite,
skele-tal, and muscle asymmetry: a systematic review. Eur J Orthod 2016; 38:638–651.https://doi.org/10. 1093/ejo/cjw003PMID:26823371
36. Nadler SF, Malanga GA, Feinberg JH, Prybicien M, Stitik TP, DePrince M, et al. Relationshp between hip muscle imbalance and occurance of low back pain in collegiate athletes. A prospective study. Am J Phys Med Rehabil 2001; 80:572–577.https://doi.org/10.1097/00002060-200108000-00005PMID:
11475476
37. Veiersted KB, Westgaard RH, Andersen P. Electromyographic evaluation of muscular work pattern as a predictor of trapezius myalgia. Scand J Work Environ Health 1993; 19:284–290.https://doi.org/10. 5271/sjweh.1472PMID:8235518
38. Shimazaki T, Motoyoshi M, Hosoi K, Namura S. The effect of occlusal alteration and masticatory imbal-ance on the cervical spine. Eur J Orthod 2003; 25:457–463.https://doi.org/10.1093/ejo/25.5.457PMID:
39. Miyazaki M, Yonemitsu I, Takei M, Kure-Hattori I, Ono T. The imbalance of masticatory muscle activity affects the asymmetric growth of condylar cartilage and subchondral bone in rats. Arch Oral Biol 2016; 63:22–31.https://doi.org/10.1016/j.archoralbio.2015.11.020PMID:26669214
40. Lund JP, Sadeghi S, Athanassiadis T, Caram Salas N, Auclair F, Thivierge B, et al. Assessment of the potential role of muscle spindle mechanoreceptor afferents in chronic muscle pain in the rat masseter muscle. Plos One 2010; 5:e11131.https://doi.org/10.1371/journal.pone.0011131PMID:20559566 41. Xu HG, Hu CJ, Wang H, Liu P, Yang XM, Zhang Y, et al. Effects of mechanical strain on ANK, ENPP1
and TGF-β1 expression in rat endplate chondrocytes in vivo. Mol Med Report 2011; 4:831–835.
42. Levinger I, Yan X, Bishop D, Houweling PJ, Papadimitriou I, Munson F, et al. The influence ofα -actinin-3 deficiency on bone remodeling markers in young men. Bone 2017; 98:26–-actinin-30.https://doi.org/10.1016/ j.bone.2017.02.010PMID:28254467
43. Paparini A, Ripani M, Giordano GD, Santoni D, Pigozzi F, Romano-Spica V, et al. ACTN3 genotyping by real-time PCR in the Italian population and athletes. Med Sci Sport Exerc 2007; 39:810–815.