Supplemental Materials for:
Infrared spectroscopy study of the in-plane response of YBa
2Cu
3O
6.6in magnetic fields up to 30 Tesla
F. Lyzwa1, B. Xu1, P. Marsik1, E. Sheveleva1, I. Crassee2, M. Orlita2, C. Bernhard1
1University of Fribourg, Department of Physics and Fribourg Center for Nanomaterials, Chemin du
Musée 3, CH-1700 Fribourg, Switzerland
2Laboratoire National des Champs Magnétiques Intenses (LNCMI), CNRS-UGA-UPS-INSA, 25, Avenue
des Martyrs, 38042 Grenoble, France
I. Magnetization measurements to determine TC
Figure 1. Vibration sample measurement (VSM) performed with a Quantum Design PPMS device. For the underdoped YBa2Cu3O6.6 crystal its superconducting transition temperature
II. Correction of the c-axis contribution and temperature-dependent shift of the plasma edge
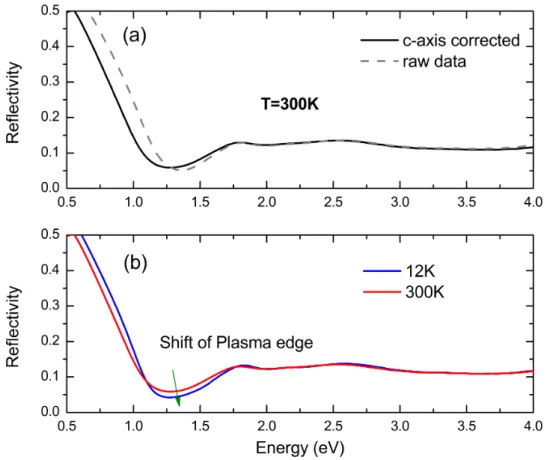
Figure 2. Visible to near-infrared reflectivity spectra of the YBa2Cu3O6.6 crystal. (a) By
measuring the reflectivity at an angle of incidence φ > 0, we are not only probing the in-plane (ab-in-plane) response of the sample, but also some contribution from the out-of-in-plane (c-axis) response. This can be corrected by measuring the c-axis component and applying a simple thin film model. (b) The plasma edge shifts to higher energies by going from 300 K to 12 K due to the stronger Drude response [1].
III. Magneto-optical measurements
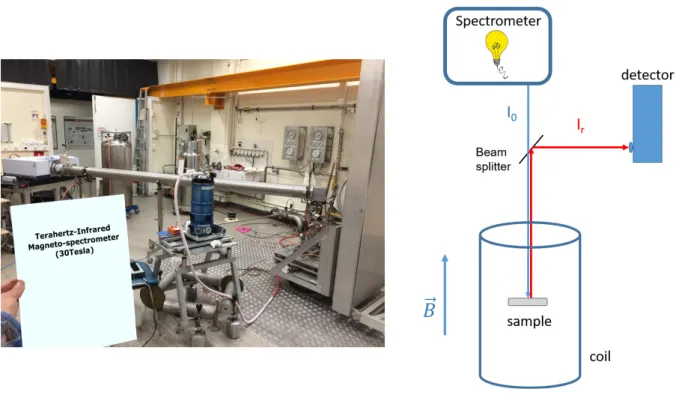
The magnetic field dependent measurements of the YBa2Cu3O6.6 crystal were performed via a
Bruker VERTEX 80v Fourier transform infrared spectrometer being attached to a long pipe (to ensure, that the optical components inside the spectrometer chamber get not affected by the magnetic field), which is connected to a beam splitter (BS) (see Fig. 3).
The sample was placed in a sealed volume with low-pressure helium exchange gas that was inserted into a liquid helium bath with T=4.2 K (or in a nitrogen bath with T=77 K) and surrounded by a resistive coil which creates the magnetic field, in a way that B is parallel to the incoming/outgoing light and perpendicular to the sample surface. In the so-called Faraday configuration, the light I0 travels from the spectrometer through the pipe to the BS until it hits
the sample surface, where it is reflected back to the BS and finally arrives at the Bolometer, where the total reflectivity Ir is detected.
Figure 3. Experimental setup for magnetic field dependent reflectivity measurements: Picture (left) and sketch (right).
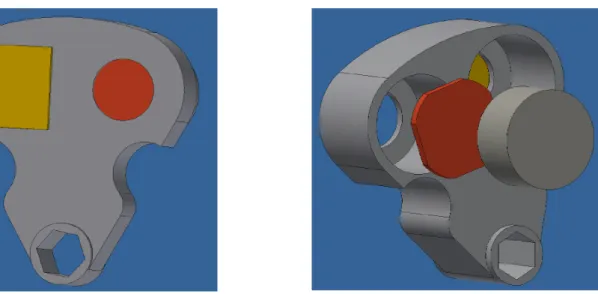
The magneto-optical measurements on the YBa2Cu3O6.6 crystal were always done by
referencing to a gold mirror placed in a special holder (see Fig. 4), in order to avoid contribution from the setup itself. Since the B-field was applied while the sample being already in the superconducting state, the strong repulsion forces were acting on the crystal and causing a movement. To avoid this sample movement, we fixed the sample with an additional holder piece from the backside.
Figure 4. Sample holder configuration for magnetic field measurements. The reference gold mirror (yellow) is fixed from the frontside of the holder (left image), whereas the YBa2Cu3O6.6 crystal (red) is fixed with an additional holder piece from the backside (right
IV. Magnetic-field-induced changes in the low-energy spectra
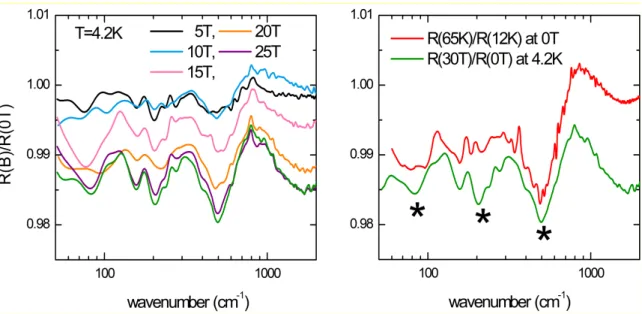
Figure 5. Enlarged view of Fig 2(a), (c) in the manuscript, showing several reflectivity ratios for the low-energy part of the spectra. Left panel: Evolution of the spectra for different magnetic fields applied (B II c-axis). Right panel: Magnetic field (green) and temperature (red) effect are compared to each other. The stars label the two enhanced electronic modes (at 240 cm-1 and
90 cm-1) and as well as the dip around 500cm-1, which is attributed to the suppression of the
V. Impact of the choice of the extrapolation to higher energies
Figure 6. (a) Possible extrapolations for the high-energy side of the magnetic field dependent data. In order to perform a Kramers-Kronig transformation, we assumed that the off-diagonal terms of the dielectric function tensor are relatively small and can therefore be neglected. (b) and (c): The choice of the extrapolation do not lead to significant differences for the low energy region of the spectra, as can be seen in the difference plots Δε1 and Δσ1. For the maindraft, we chose extrapolation type 3. It presents the most
simplistic assumption, that the reflectivity curve (when B=30 Tesla applied) smoothly approaches the one for zero-field.
References
[1] A. V. Boris, N. N. Kovaleva, O. V. Dolgov, T. Holden, C. T. Lin, B. Keimer and C. Bernhard, "In-Plane Spectral Weight Shift of Charge Carriers in YBa2Cu3O6.9," Science, vol. 304, pp. 708-710, 2004.